
I met some new friends this morning

And some old friends

She is very busy protecting her nest now from other birds and squirrels.
I met some new friends this morning
And some old friends
She is very busy protecting her nest now from other birds and squirrels.
Experts tell us that declining spring snow cover and an early spring are proof of global warming. I have been hearing this for years.
Snowpack is above normal across almost the entire western US.
Basin Snow Water Content Map (SNOTEL)
April 29 was the 4th coldest on record here in Boulder. Last year was 5th coldest. It was the first time we ever had two consecutive cold April 29th’s in a row.
We had 8 inches of snow on April 29, second largest April 29 snow on record. It snowed last year too.
Last year I attended a meeting of the Boulder Clean Power Plan at the University of Colorado. People there said they were very traumatized by climate change. I asked a prominent educator how she perceived the local climate was changing. The only thing she could think of was :
Well it seems like it snows more in the Spring than it used to.
I just took this picture with a Canon SX-720 pocket camera.
The fake news press continues to bombard the public with claims that Arctic multi-year sea ice is disappearing. As recently as one hour ago.
As with almost everything else reported by the press about climate, the claims are completely fraudulent. The coverage of multi-year sea ice has tripled since 2008.
This animation shows the huge increase in the areal coverage of multi-year ice.
In 2009, experts announced that Arctic sea ice was “effectively gone.” Since then, the coverage of multi-year sea ice has more than tripled, and experts say it is “disappearing.”
Multiyear Arctic ice is effectively gone: expert | Reuters
You can reproduce my work on a Linux, Mac or Cygwin system using this script. On the other hand, you can’t reproduce the work of government climate scientists, because they are doing propaganda, not science.
#!/bin/tcsh

set MONTH=`date -v -1d +%m`
set DAY=`date -v -1d +%d`
set DATE=${MONTH}${DAY}
rm -f MYI_${DATE}.csv

foreach year (2008 2009 2010 2011 2012 2013 2014 2015 2016 2017)
    set LABEL=${MONTH}/${DAY}/${year}
    rm -f ice_type_nh_${year}${DATE}1200.jpg
    rm -f ice_type_nh_${year}${DATE}1200.gif
    echo ice_type_nh_${year}${DATE}1200.jpg
    echo http://osisaf.met.no/quicklooks/prod/ice/${year}/${MONTH}/ice_type_nh_${year}${DATE}1200.jpg
    curl -O http://osisaf.met.no/quicklooks/prod/ice/${year}/${MONTH}/ice_type_nh_${year}${DATE}1200.jpg
    convert ice_type_nh_${year}${DATE}1200.jpg -gravity center -pointsize 72 -background blue label:$LABEL -append                 ice_type_nh_${year}${DATE}1200.gif
    rm ice_type_nh_${year}${DATE}1200.jpg
    convert ice_type_nh_${year}${DATE}1200.gif ice_type_nh_${year}${DATE}1200.txt
    echo $year","`grep '#F' ice_type_nh_${year}${DATE}1200.txt | wc | awk -F" " '{print $1}'` >> MYI_${DATE}.csv
end
In the year 2000, NASA showed 0.5C warming from 1880 to 1999. Now they show 1.0C warming during that same period. The animation below was made using images captured directly from the NASA GISS web site.
This change was made via a hockey stick of data tampering.
But it is worse than it seems. Not only did NASA double warming by altering data, but they hid the warmth prior to 1880. In the 2000 version, there was little or no warming from the 1870’s to the 1970’s, and about 0.4C warming after the 1970’s.
As bad as this story is already, it gets worse. The 2016 version shows a very rapid increase in temperature after the year 1998, but satellites show little warming during that period.
Wood for Trees: Interactive Graphs
NASA is hiding pre-1880 warmth, tampering with the 1880-1999 data, and showing a huge amount of imaginary warming since then. Junk science doesn’t get any worse than this.
Following the snowstorm, she wants to make her nest bigger.

She finds a twig she likes.
Tugging on it with the only tool available, her beak.

It takes about 30 seconds, but she gets the twig and flies back to the nest.
While this chick sings in the tall grass of the wetlands.

Progressive CU and the City of Denver are hoping to destroy this wetlands.
If everyone saw this video, the global warming scam would disappear. Please pass it around.
I was at the National Center for Atmospheric Research in Boulder on Saturday, and took this picture there. There was close to a foot of snow on the ground.
Inside their fossil fuel powered building, they had this graph, which claimed to show their models exactly match the global temperature record.
The global temperature record they were referring to, shows warming prior to 1940, a flat period from 1940 to 1970, and rapid linear warming ever since.
NASA Global Land Only Temperature
One huge problem with NCAR’s claim is that the NASA graph looks nothing like NCAR’s own graph from 1974, which showed 1970 0.1C cooler than 1870, and a 0.4C drop in global temperature from 1940 to 1970.
14 Jul 1974, Page 1 – Lincoln Evening Journal
Overlaying the 1974 NCAR graph on the 2017 graph, it becomes clear that the 1940 to 1970 cooling has been erased.
NCAR’s top scientists were pushing global cooling at the time.
12 Jun 1974, Page 20 – at Newspapers.com
Scientists wanted to melt the polar ice cap to save the world from global cooling.
?www.denisdutton.com/newsweek_coolingworld.pdf
There was unanimous consensus among scientists that the Earth was cooling.

TimesMachine: July 18, 1970 – NYTimes.com
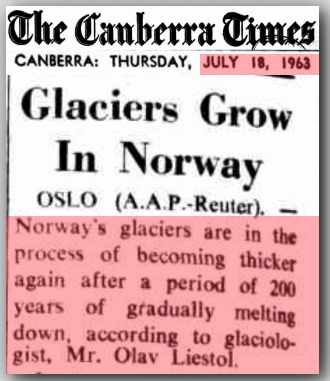
18 Jul 1963 – Glaciers Grow In Norway
Lawrence Journal-World – Google News Archive Search
It is clear that NCAR’s “actual temperature record” is actually fake data from 1940 to 1970, but what about the rest of the graph which shows steady warming since 1970? That is also fake. As of 2013, there was a pause in warming after the year 2000, which was central to the IPCC report.
Global warming pause ‘central’ to IPCC climate report – BBC News
Government agencies later erased the post-2000 hiatus, because Obama needed to push his scam climate treaty through. NCAR’s director knows perfectly well that the hiatus is real.
The fact is that we can’t account for the lack of warming at the moment and it is a travesty that we can’t.
- Kevin Trenberth. NCAR Director 2009
Satellites show that the hiatus is real, and that the surface temperature record from NASA is fake.
Wood for Trees: Interactive Graphs
The bottom line is the fake NCAR models have been parametrized to exactly match the fake NASA surface temperature record. Both the models and surface temperature record are utter junk science.
The hawks finally emerged from the nest after spending three days protecting the eggs from the snow and cold.

