Understanding Alternative Facts (Part 1)

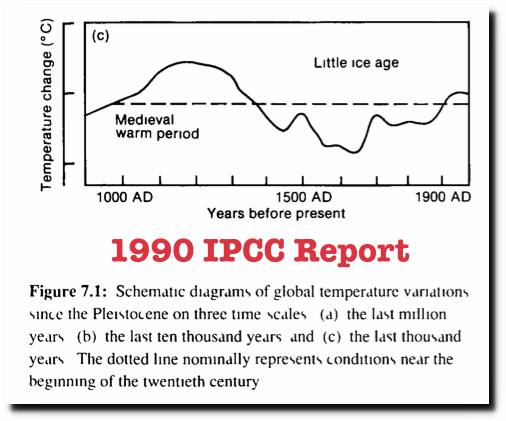
The Medieval Warm Period (MWP) was well established science for decades, and it completely wrecked the global warming scam.

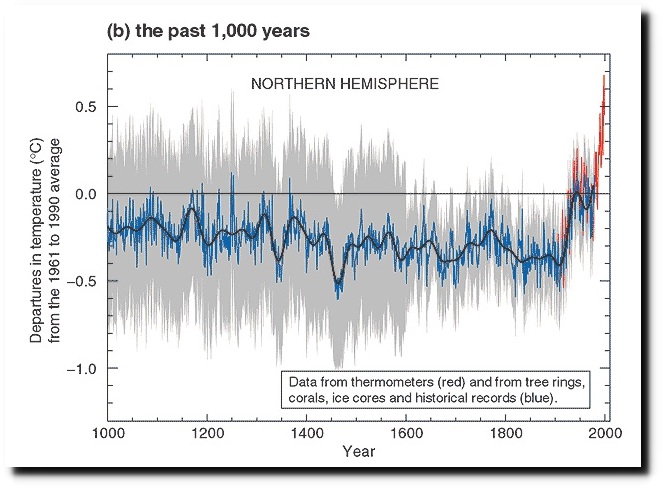
But that simply wasn’t going to raise any revenue for climate scamsters, so Michael Mann was commissioned to create alternative facts, erase the MWP, and tack James Hansen’s fake hockey stick blade on to the end.

This is now officially known as Mike’s Nature Trick alternative fact.

Posted in Uncategorized | Leave a comment

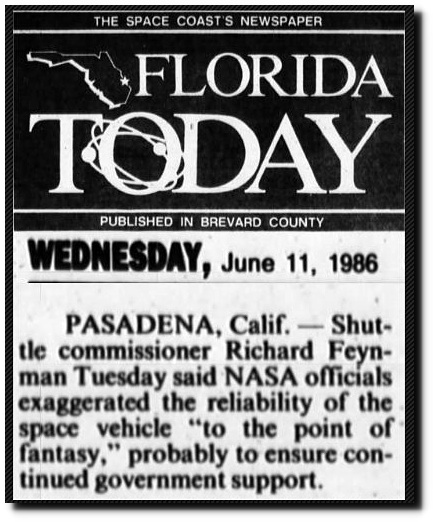
NASA Lies Kill

Posted in Uncategorized | Leave a comment

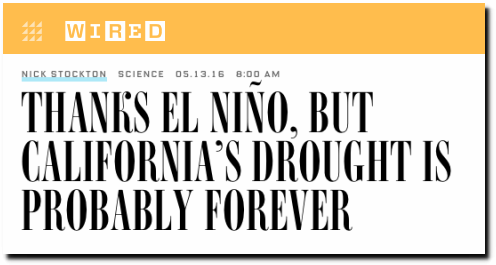
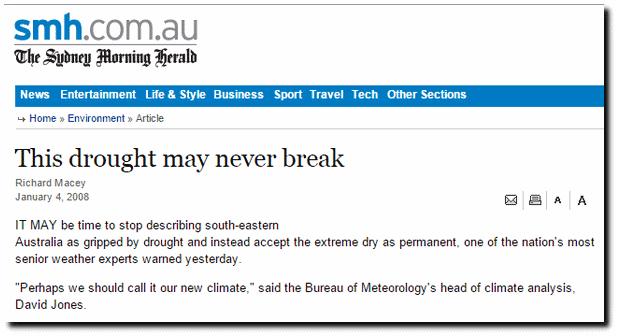
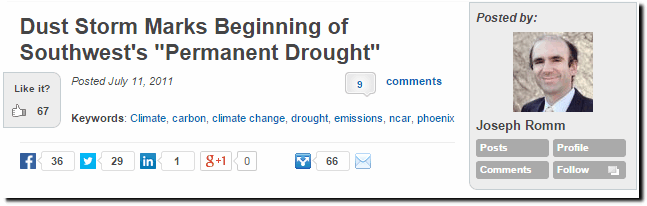
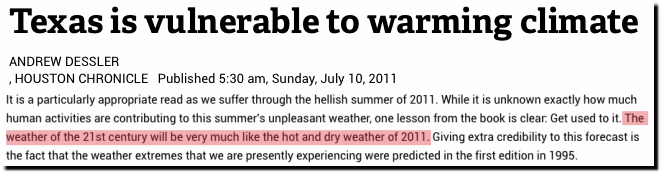
The 100% Consensus On Drought

Government climate scientists’ drought forecasts have been 100% wrong. Now that is a consensus.

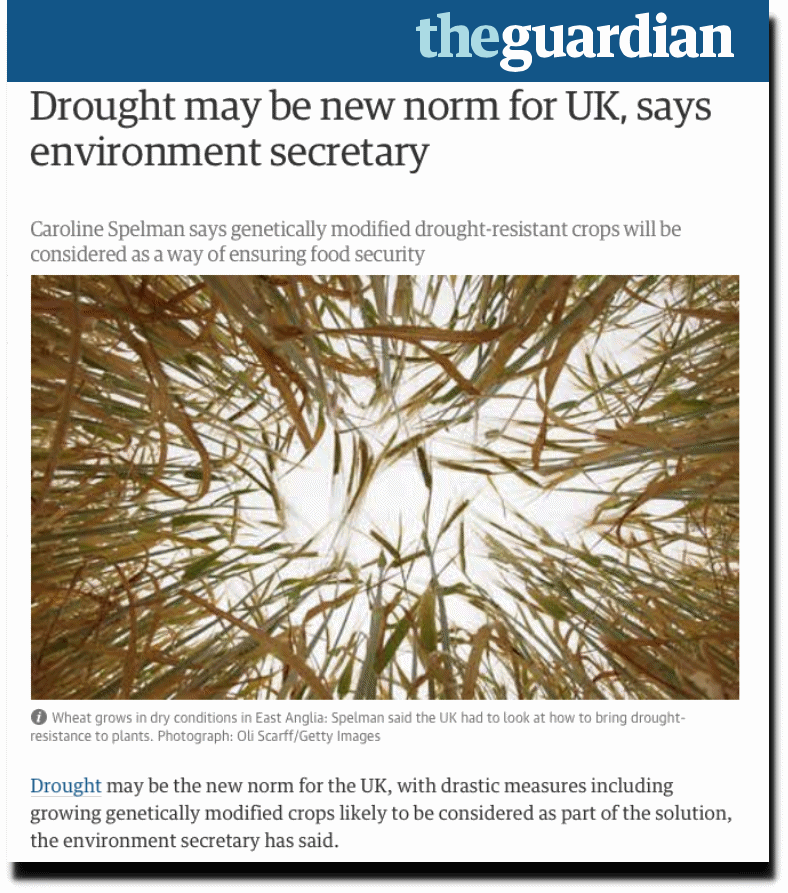
Drought may be new norm for UK, says environment secretary | Environment | The Guardian

Thanks El Niño, But California’s Drought Is Probably Forever | WIRED

This drought may never break – Environment – smh.com.au

California Braces for Unending Drought – The New York Times

Dust Storm Marks Beginning of Southwest’s “Permanent Drought” | The Energy Collective

Texas is vulnerable to warming climate – Houston Chronicle

Posted in Uncategorized | Leave a comment

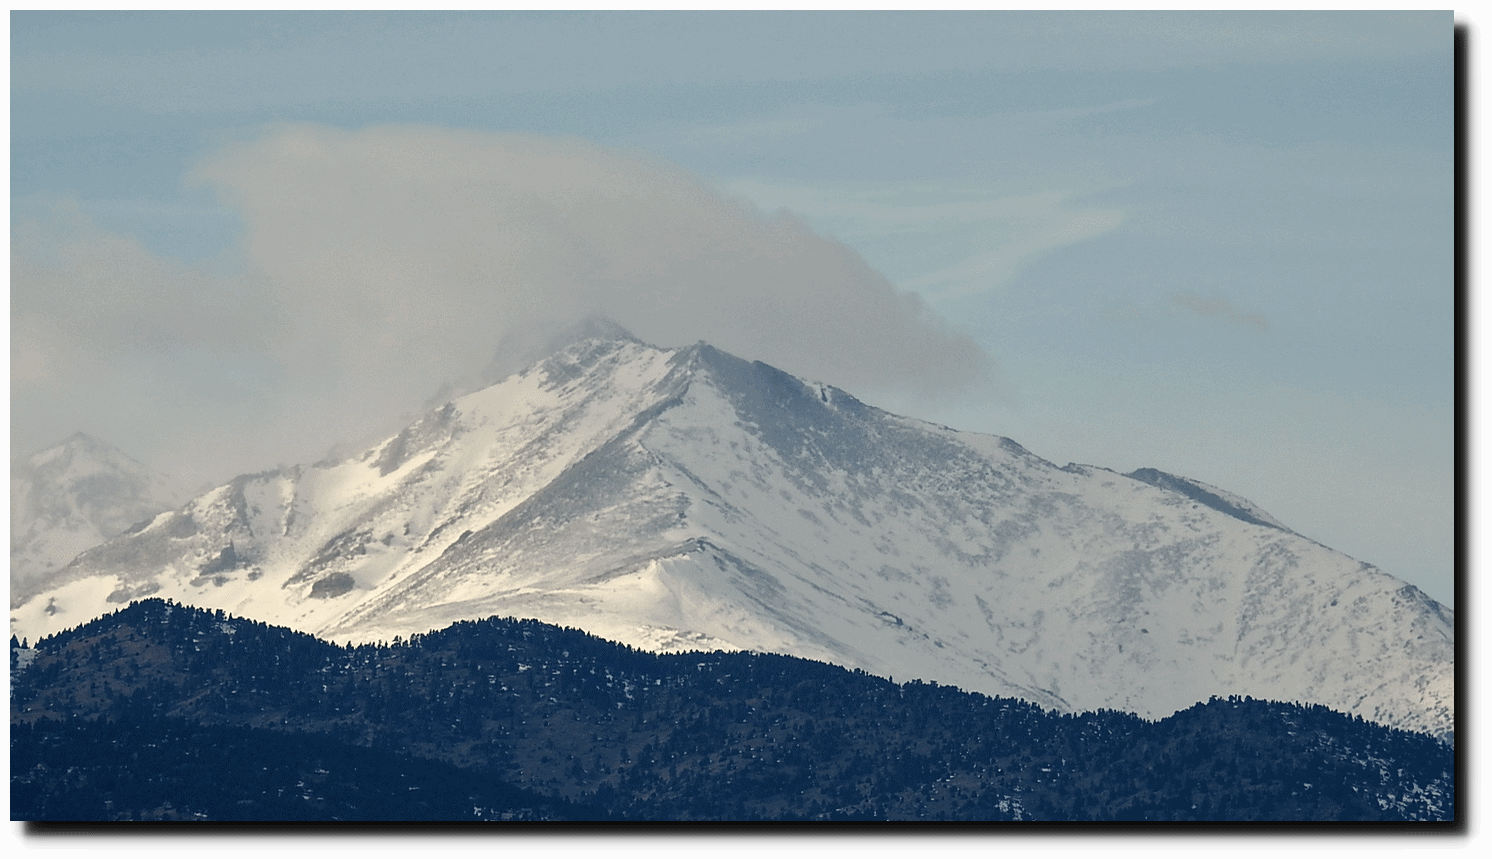
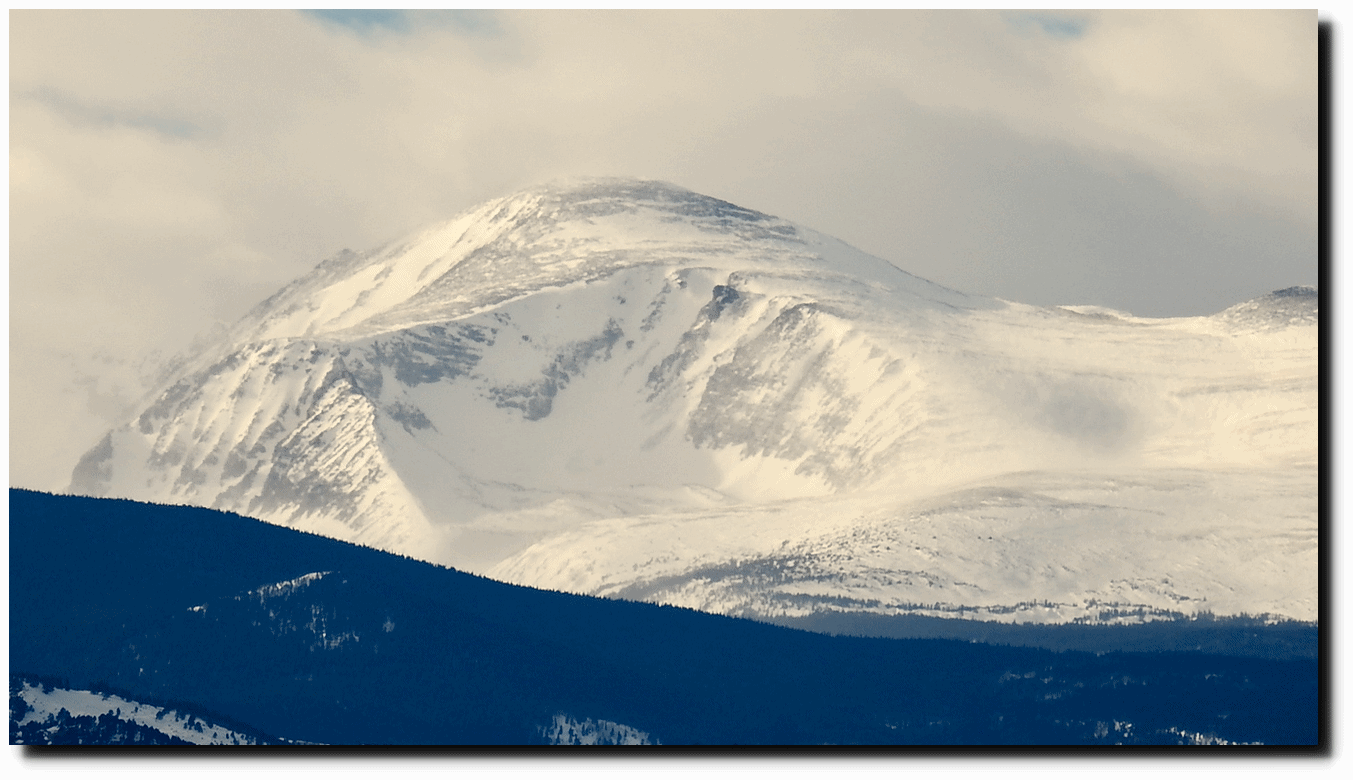
Jet Stream Across The Front Range

Longs Peak

North Arapahoe Peak

Posted in Uncategorized | Leave a comment

US Climate Becoming Much Less Extreme

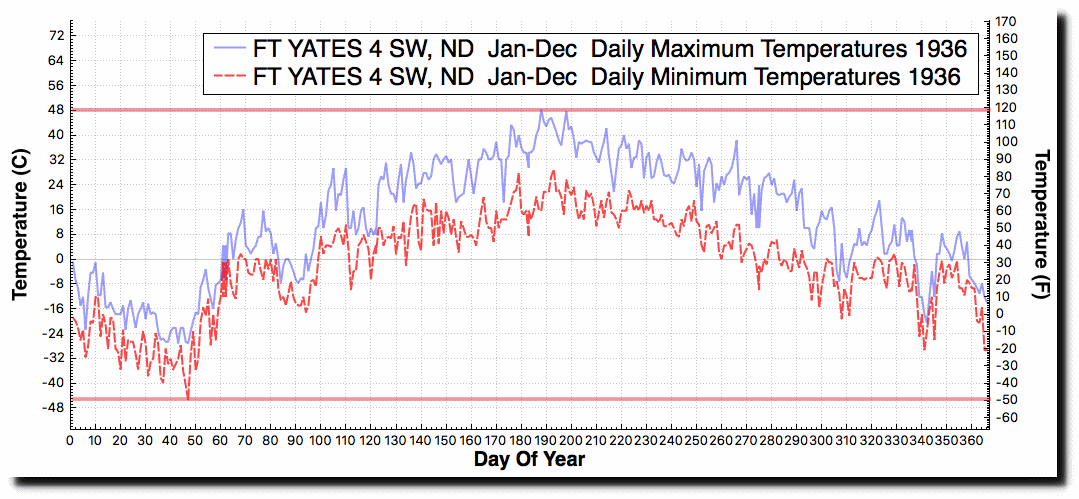
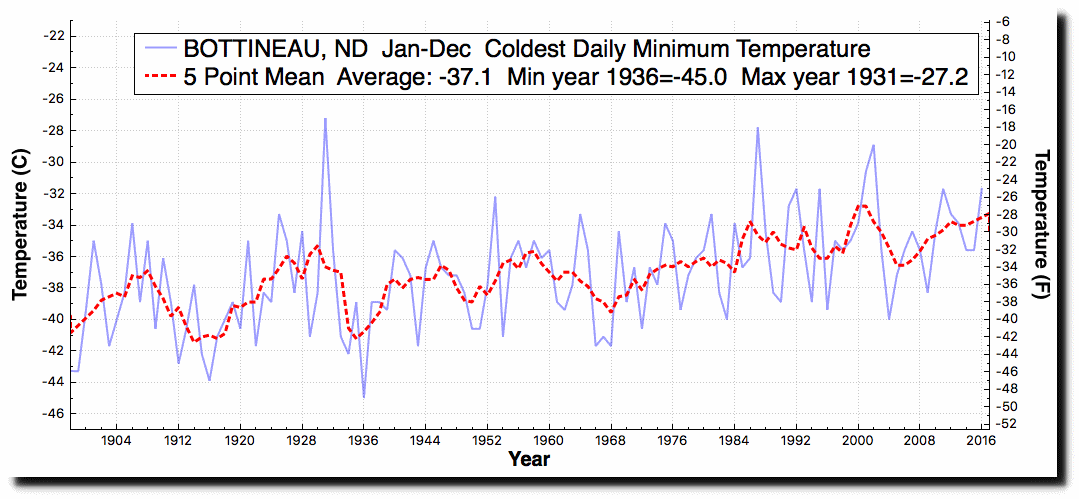
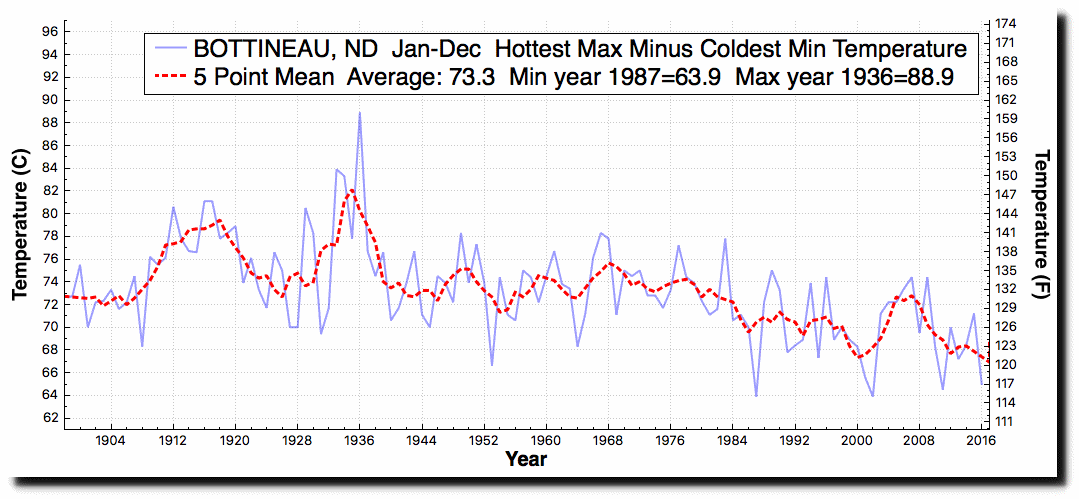
In 1936, temperatures at Fort Yates, ND ranged from -49F up to 119F.

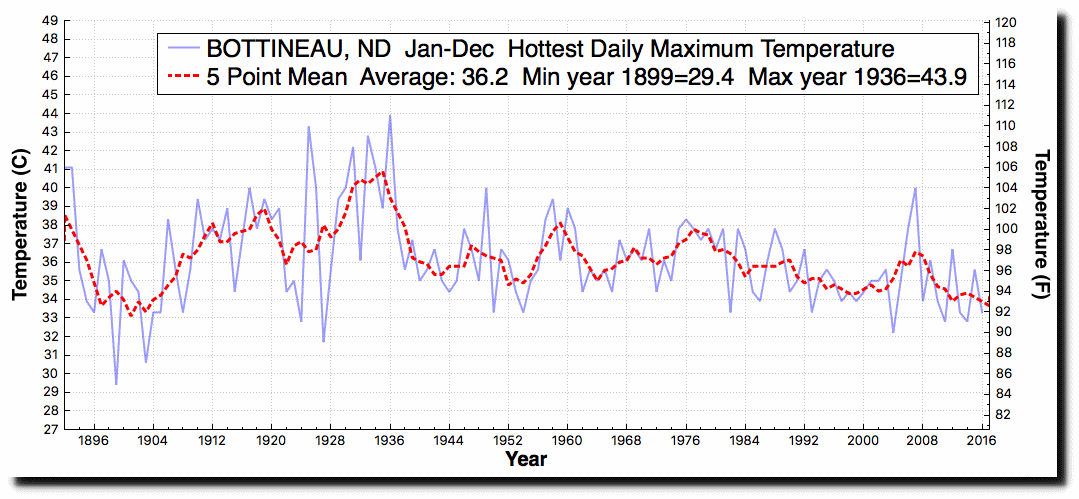
That station isn’t active any more, but since 1936 peak North Dakota temperatures have plummeted, and almost never get above 100F now.

Coldest minimum temperatures have steadily increased.

The range of temperatures has plummeted from 162 degrees in 1936, to around 120 degrees in recent years.

This of course is the exact opposite of what US government climate fraudsters claim. NOAA employees stand to make huge amounts of money by whistleblowing fraud. Contact Kent Clizbe for details.

Kent Clizbe
Fraud Detection Services
[email protected]
www.credibilityassurance.com
571 217 0714

Posted in Uncategorized | Leave a comment

Understanding Refugees

“There are signs that Allah will grant Islam victory in Europe – without swords, without guns, without conquests. The 50 million Muslims of Europe will turn it into a Muslim continent within a few decades.”

  • Muammar Gaddafi  2006

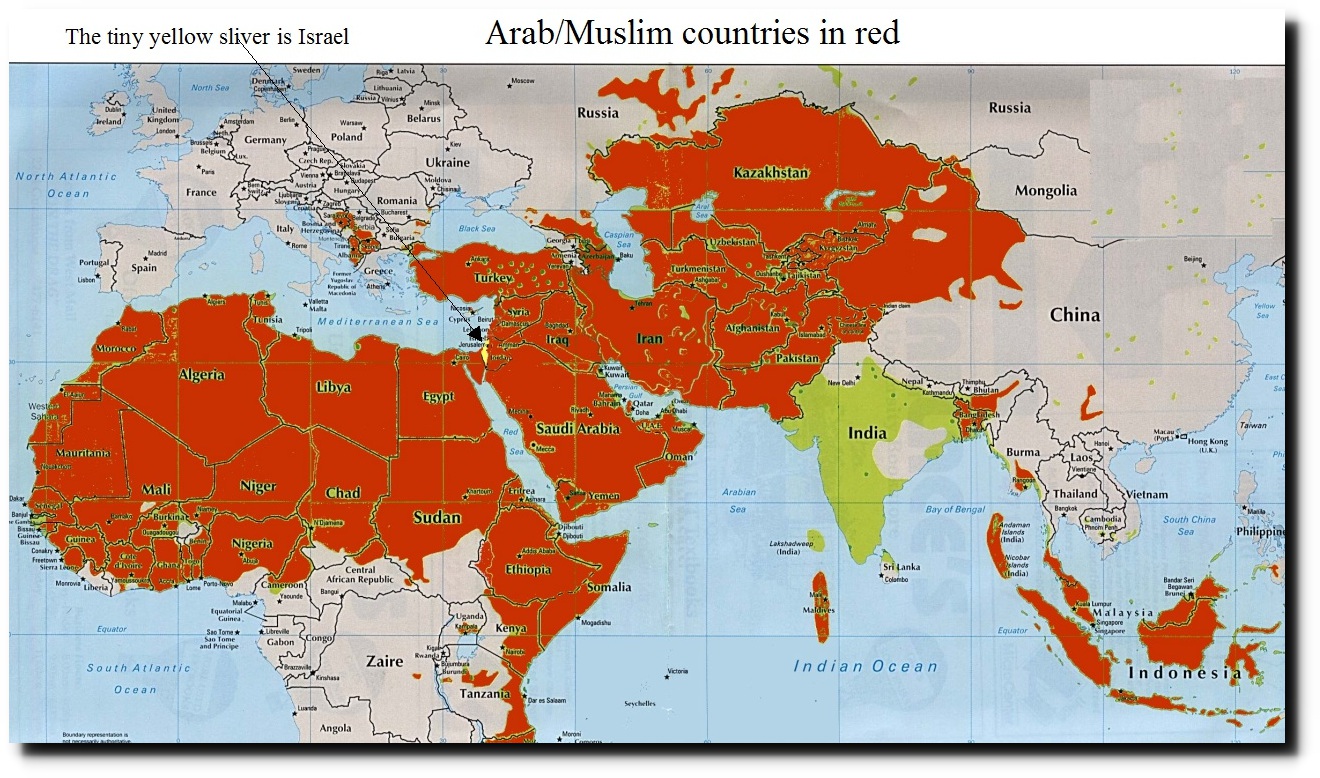
There is no reason why these military aged male widows and orphans can’t go to other Muslim countries.

Posted in Uncategorized | Leave a comment

What Is The Difference Between Leftists And Islamic Terrorists?

Both leftists and Islamic terrorists believe they are entitled to commit violence against people with different opinions.

Sundance filmgoers warn of ‘global warming’ impacts: ‘It affects our ability to reproduce’ – Warn ‘criminal’ deniers: ‘We are coming for you’ | Climate Depot

The difference is that Islamic terrorists dress better, and they normally kill leftists first.

Posted in Uncategorized | Leave a comment

Zooming In On The Mormon Tabernacle Choir

Posted in Uncategorized | Leave a comment

Visualizing The NOAA Red Hot Arctic

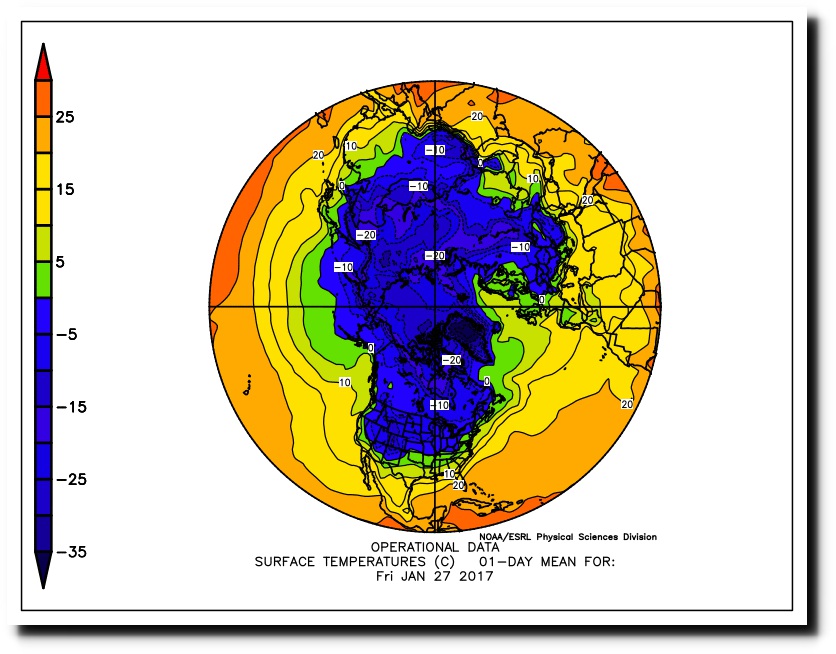
With temperatures below 0C from southern New Mexico to India, government climate experts say Earth is the hottest it has ever been, and the polar ice caps are melting down.
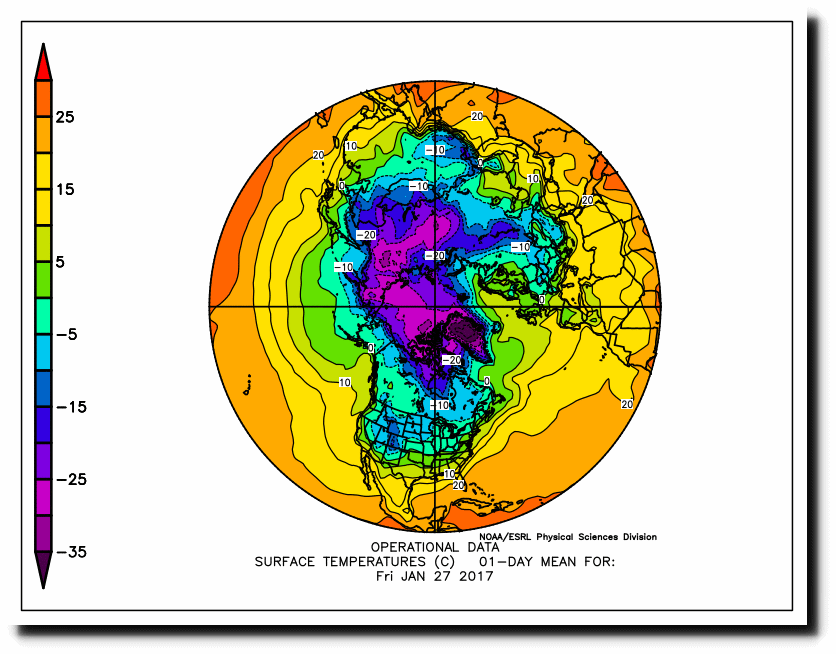
This is what the map looks like with all below 0C temperatures flattened to blue. Billions of people completely dependent on fossil fuels to survive in the cold.
ESRL : PSD : PSD Map Room: Weather Plots

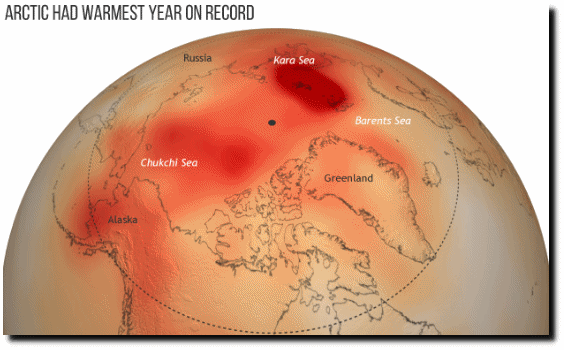
NOAA says the Arctic is red hot.
NOAA’s 2016 Arctic Report Card: Visual highlights | NOAA Climate.gov

Current temperature in Greenland is a red hot -48C.

summit:status:webcam

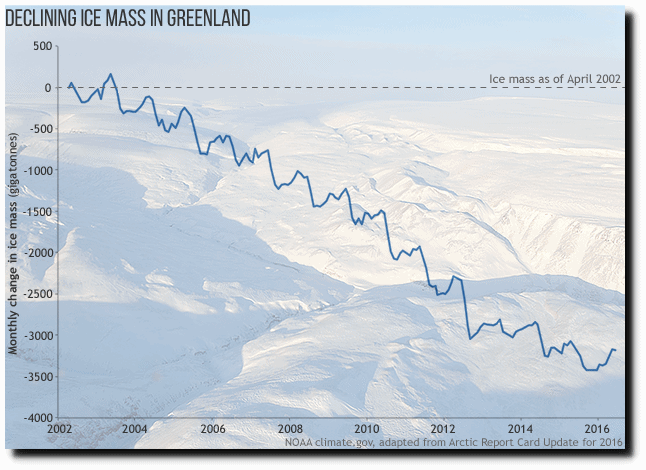
NOAA says Greenland is melting down.
NOAA’s 2016 Arctic Report Card: Visual highlights | NOAA Climate.gov

Rather than melting down, Greenland is blowing away all records for ice gain.

Greenland Ice Sheet Surface Mass Budget: DMI

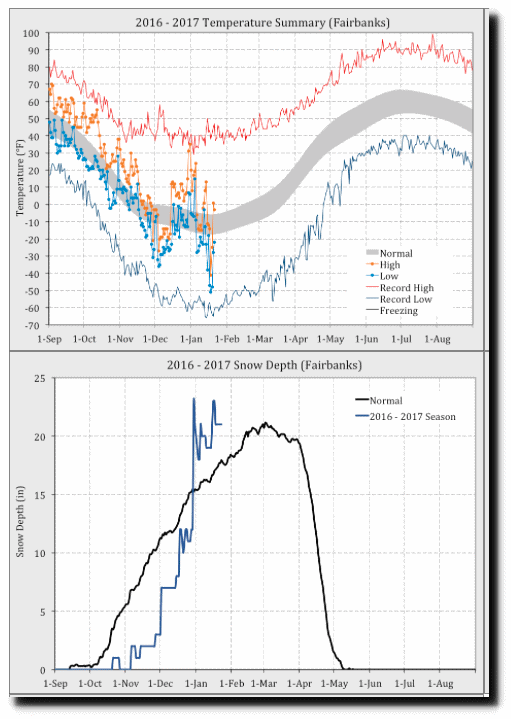
NOAA says Alaska is hot and melting, with temperatures at -50F and snow cover well above normal.
Fairbanks AP | Alaska Climate Research Center

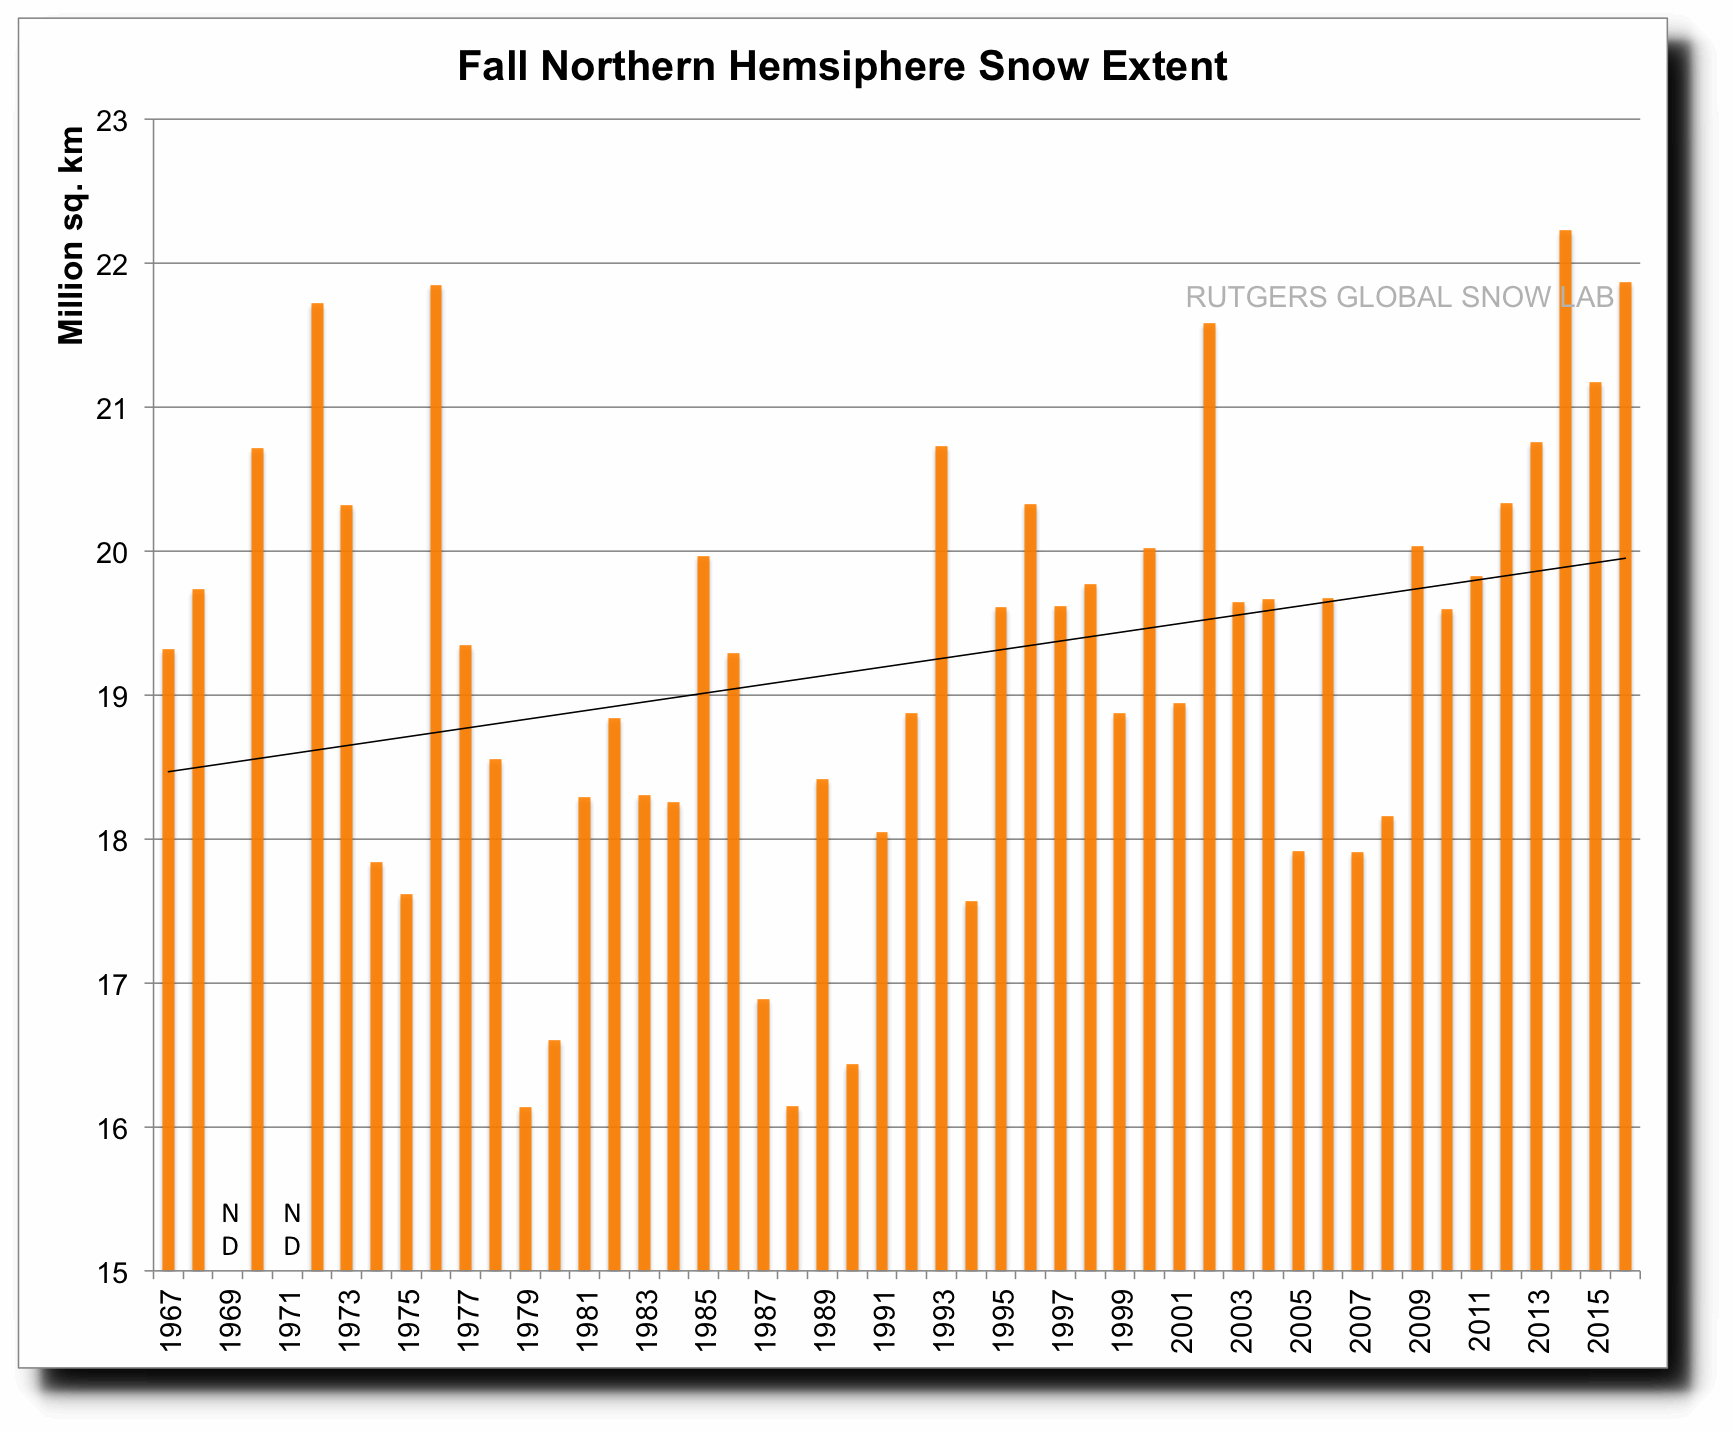
NOAA says that snow cover is receding, when the exact opposite is happening. Autumn 2016 had the second largest snow extent on record, indicating that Arctic air was penetrating very far south.
Rutgers University Climate Lab :: Global Snow Lab

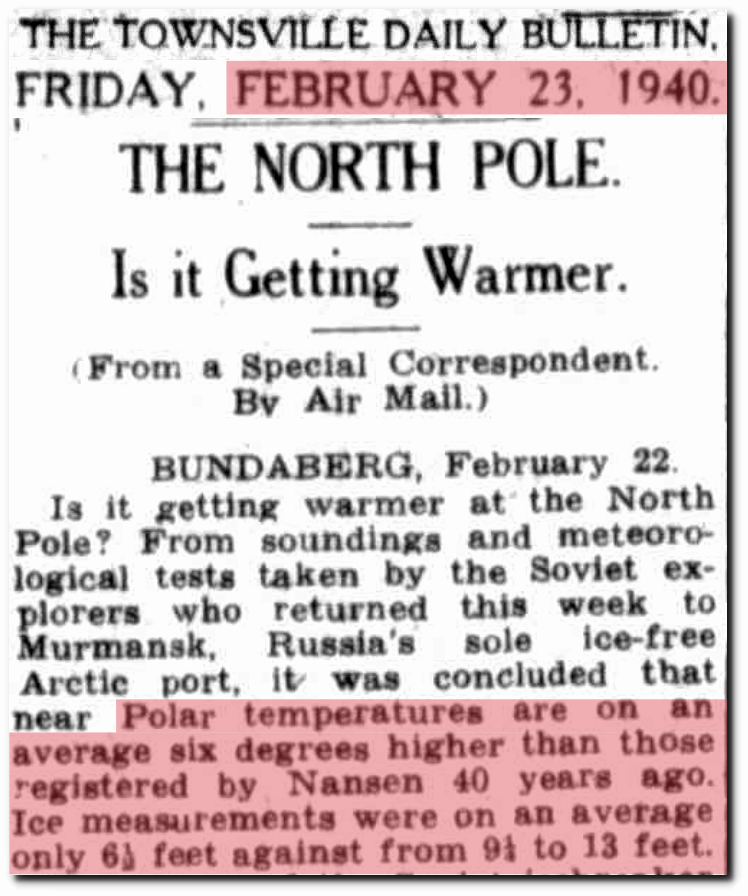
NOAA says Arctic sea ice is getting thinner. In 1940, Arctic sea ice was two meters thick.
23 Feb 1940 – THE NORTH POLE

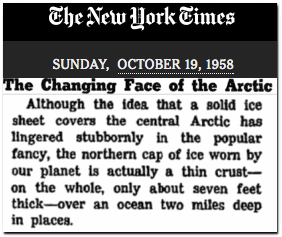
In 1958 Arctic sea ice was about two meters thick, and the New York Times debunked the current NOAA claim that Arctic sea ice is normally thick.
The Changing Face of the Arctic

Arctic sea ice is still about two meters thick.
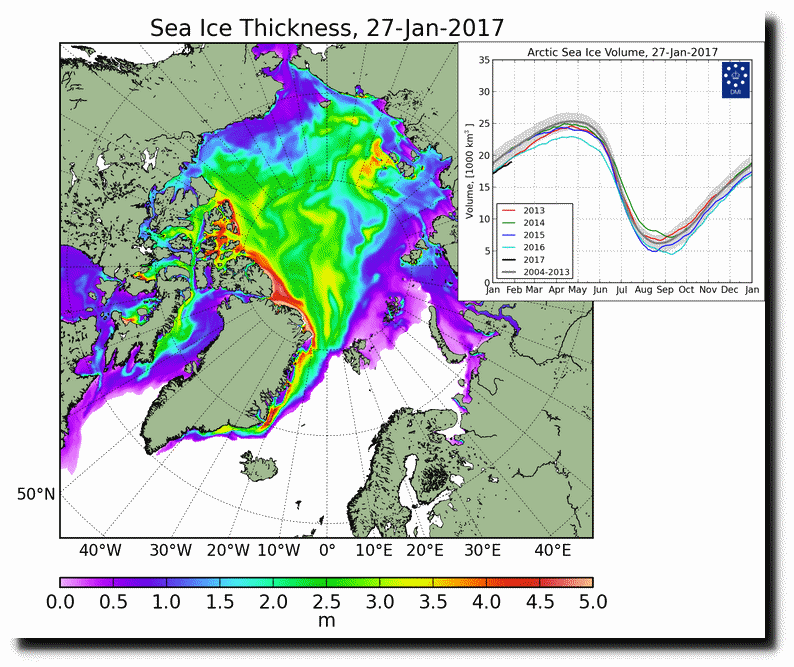
DMI Modelled ice thickness

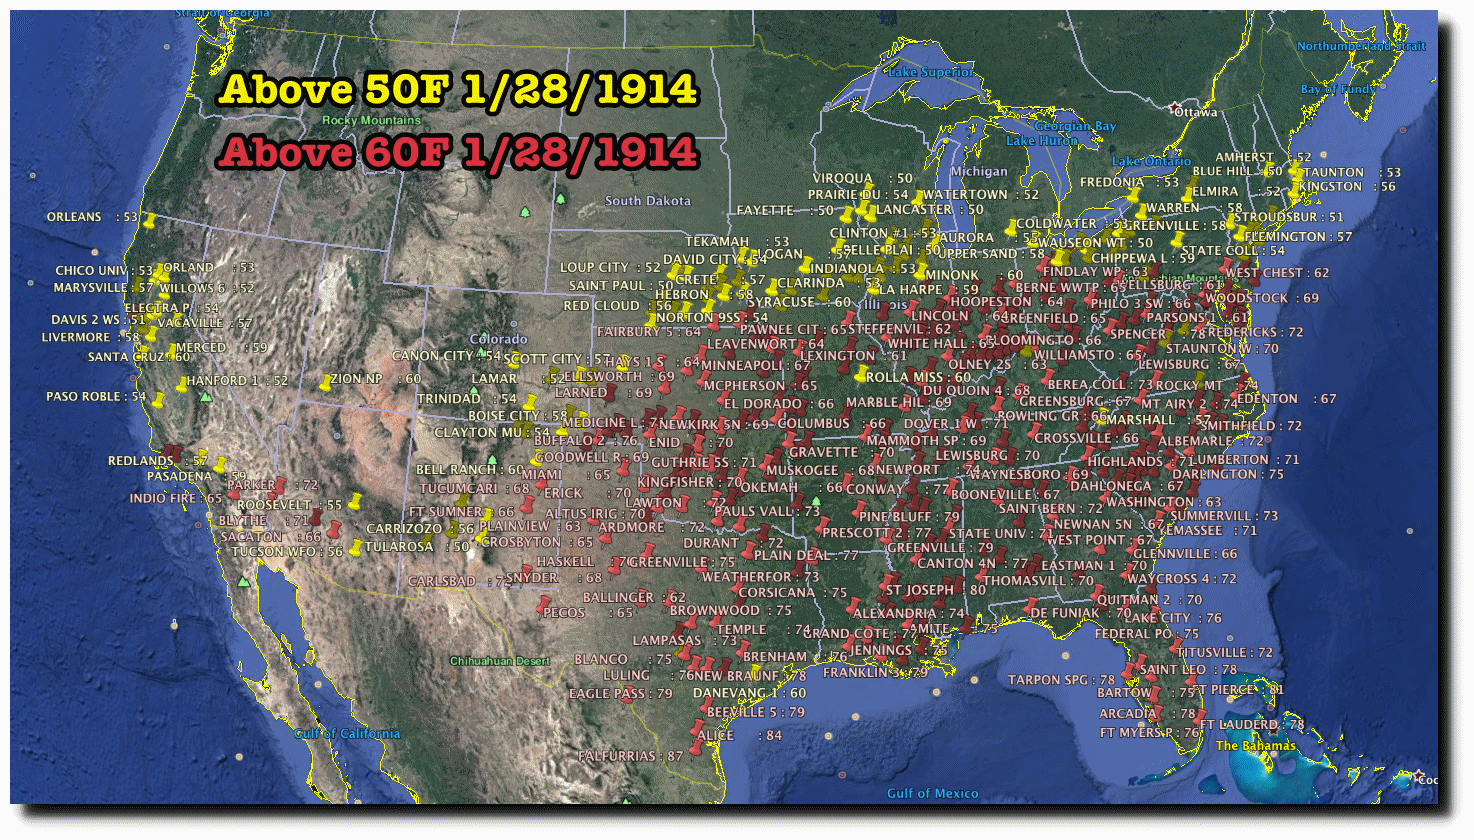
It wasn’t always cold like this though. On this date in 1914, most of the US was above 50F, and much was above 60F.
It is important that President Trump drains the swamp at NOAA. They are intentionally deceiving the public. NOAA employees stand to make huge amounts of money by whistleblowing fraud. Contact Kent Clizbe for details.

Kent Clizbe
Fraud Detection Services
[email protected]
www.credibilityassurance.com
571 217 0714

Posted in Uncategorized | Leave a comment

The US Has Cooled Since 1920, And The Frequency Of Hot Days Has Plummeted

Gavin Schmidt explained the correct way to measure temperatures. Use only good stations.

Gavin Schmidt: Global weather services gather far more data than we need. To get the structure of the monthly or yearly anomalies over the United States, for example, you’d just need a handful of stations, but there are actually some 1,100 of them. You could throw out 50 percent of the station data or more, and you’d get basically the same answers.

NASA Climatologist Gavin Schmidt Discusses the Surface Temperature Record

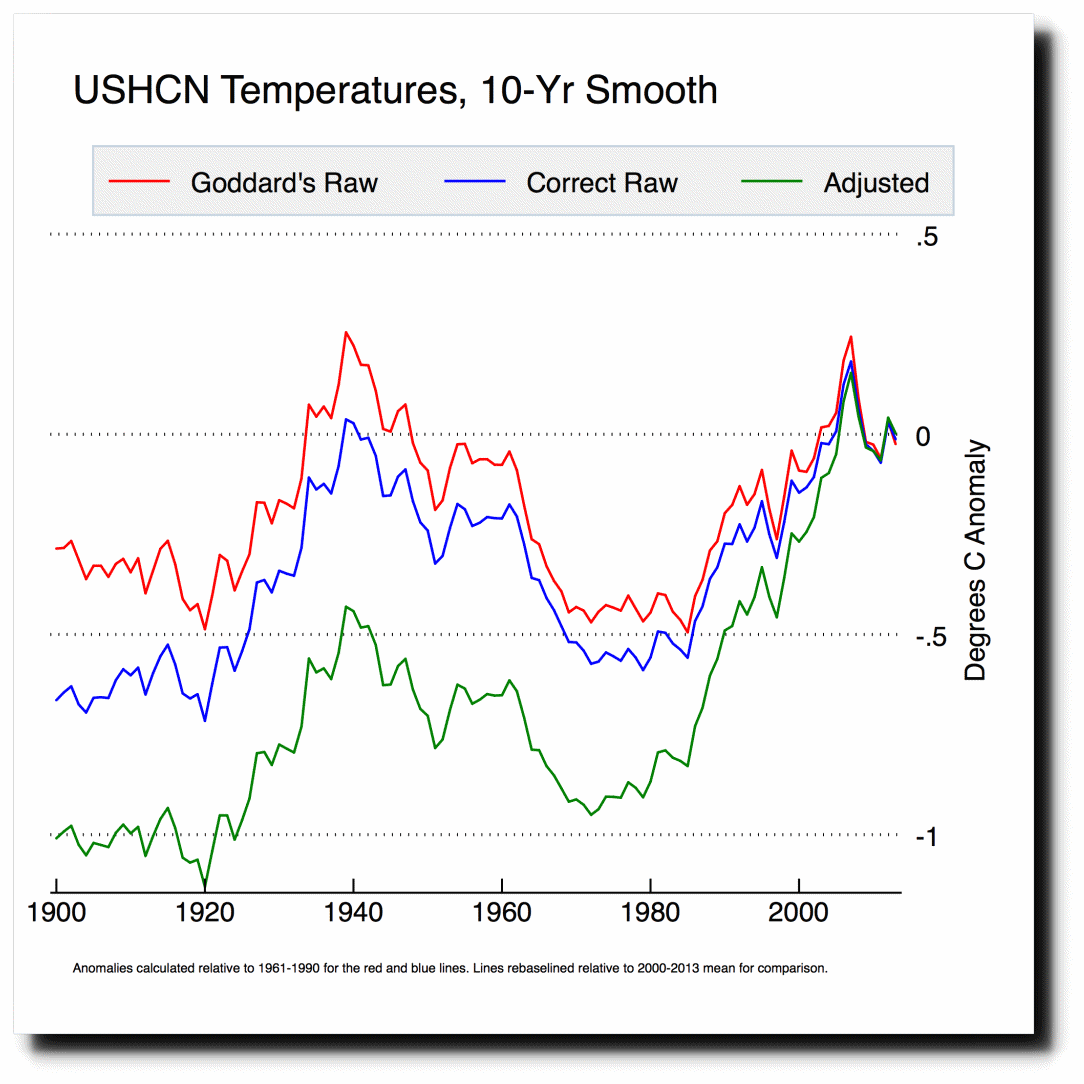
Unfortunately Gavin doesn’t follow this procedure, and neither does Zeke. Their approach is to use a set of stations which they claim is flawed, and then massively tamper with the data to produce a non-existent warming trend which suits their funding needs.

The Blackboard » How not to calculate temperatures, part 3

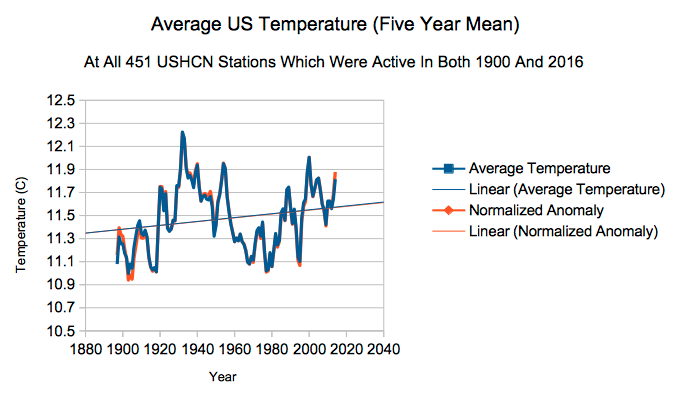
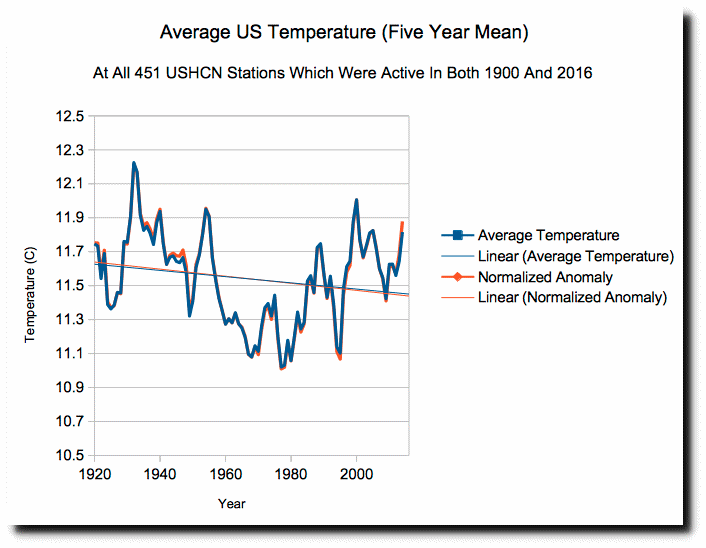
Gavin and Zeke have failed to take Gavin’s advice, so I did it for them. I used the entire subset of USHCN stations which were active from at least 1900 to 2016. Both the absolute temperature and the anomaly show nearly identical trends, with the 1930’s much warmer than the present.

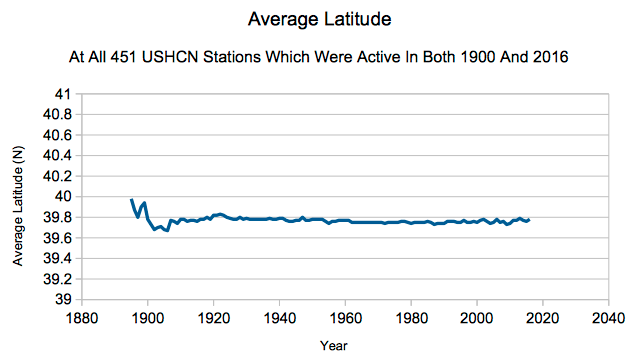
The average latitude of this group stations has hardly changed over time. The small variations are caused by some stations having missing years.

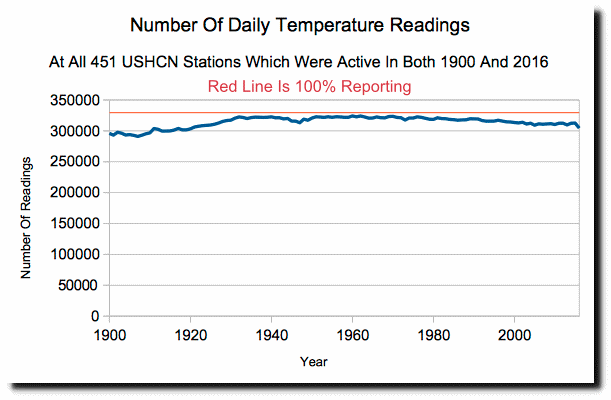
The number of daily temperature readings (highs and lows) has also scarcely changed over time, and is very close to the maximum possible.

This top notch set of stations shows that the US has cooled since 1920, and the frequency of hot days has plummeted.

The US now has about half as many hot days per year as it did during the 1930’s.

 Gavin and Zeke do their analysis the wrong way, and come up with the wrong answer. They are trying to control policy using worthless data.

Posted in Uncategorized | Leave a comment