
Gavin Schmidt explained the correct way to measure temperatures. Use only good stations.
Gavin Schmidt: Global weather services gather far more data than we need. To get the structure of the monthly or yearly anomalies over the United States, for example, you’d just need a handful of stations, but there are actually some 1,100 of them. You could throw out 50 percent of the station data or more, and you’d get basically the same answers.
NASA Climatologist Gavin Schmidt Discusses the Surface Temperature Record
Unfortunately Gavin doesn’t follow this procedure, and neither does Zeke. Their approach is to use a set of stations which they claim is flawed, and then massively tamper with the data to produce a non-existent warming trend which suits their funding needs.
The Blackboard » How not to calculate temperatures, part 3
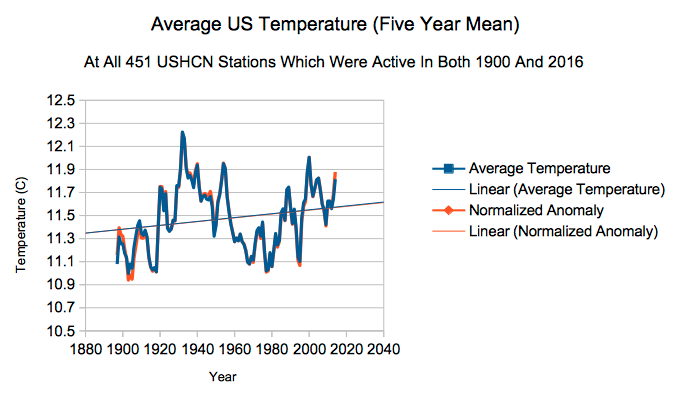
Gavin and Zeke have failed to take Gavin’s advice, so I did it for them. I used the entire subset of USHCN stations which were active from at least 1900 to 2016. Both the absolute temperature and the anomaly show nearly identical trends, with the 1930’s much warmer than the present.
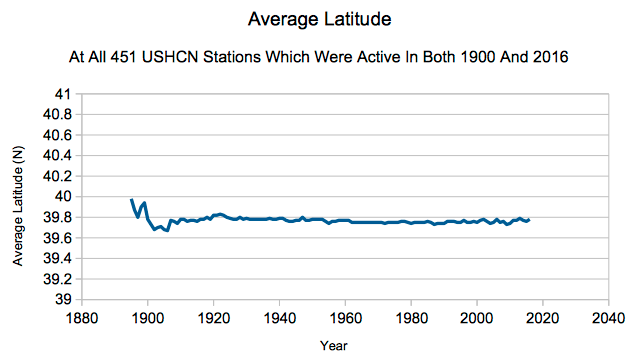
The average latitude of this group stations has hardly changed over time. The small variations are caused by some stations having missing years.
The number of daily temperature readings (highs and lows) has also scarcely changed over time, and is very close to the maximum possible.
This top notch set of stations shows that the US has cooled since 1920, and the frequency of hot days has plummeted.
The US now has about half as many hot days per year as it did during the 1930’s.

Gavin and Zeke do their analysis the wrong way, and come up with the wrong answer. They are trying to control policy using worthless data.
