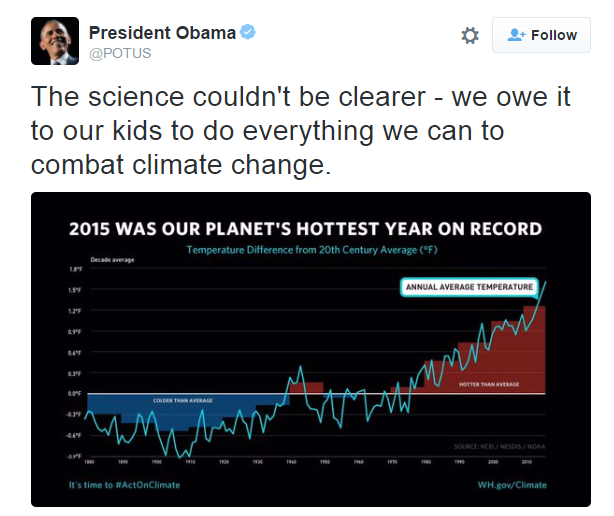
2015 was the most fraudulent year on record at the White House. Their claim is utter nonsense.
NASA’s surface temperature record shows 1.6C warming since the 1880’s, and 0.8C warming during the century from 1880 to 1980.
Fig.A.gif
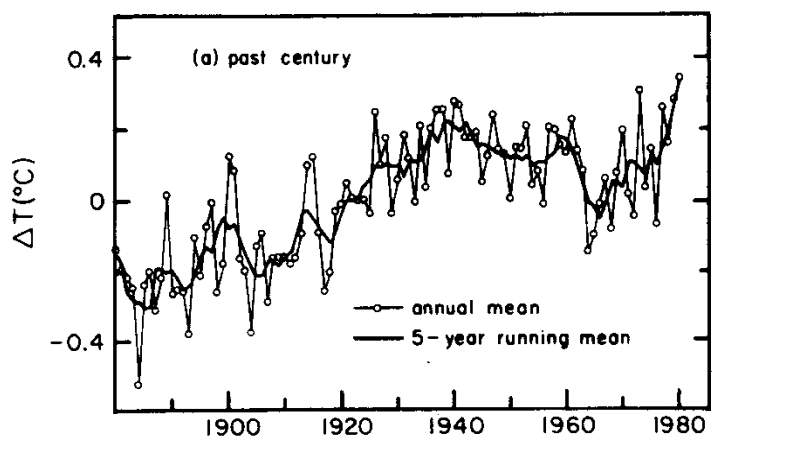
Their 1981 version of the same graph only shows a little over half that much warming from 1880 to 1980.
Challenge_chapter2.pdf
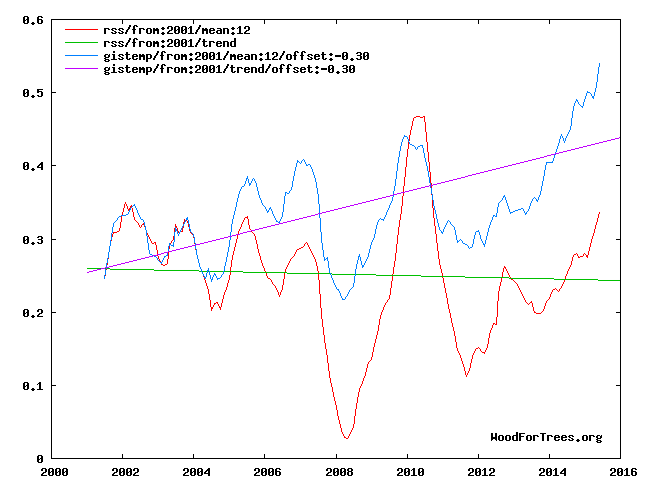
The next graph overlays the two above at the same scale, normalized to the late 1970’s. NASA has massively cooled the past, far outside of their own error bars.
They added about 0.3C warming prior to 1980 by altering the data, and show another 0.2C warming since 2001, during a time when satellites show cooling.
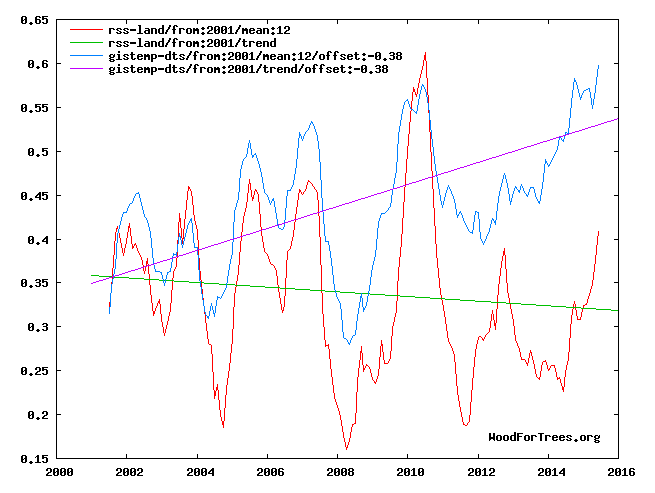
Wood for Trees: Interactive Graphs
Most of their surface temperatures are fake. There are vast areas of land with little or no temperature readings, and many of the thermometers they do have are contaminated by urban heat island effects.
201511.gif (990×765)
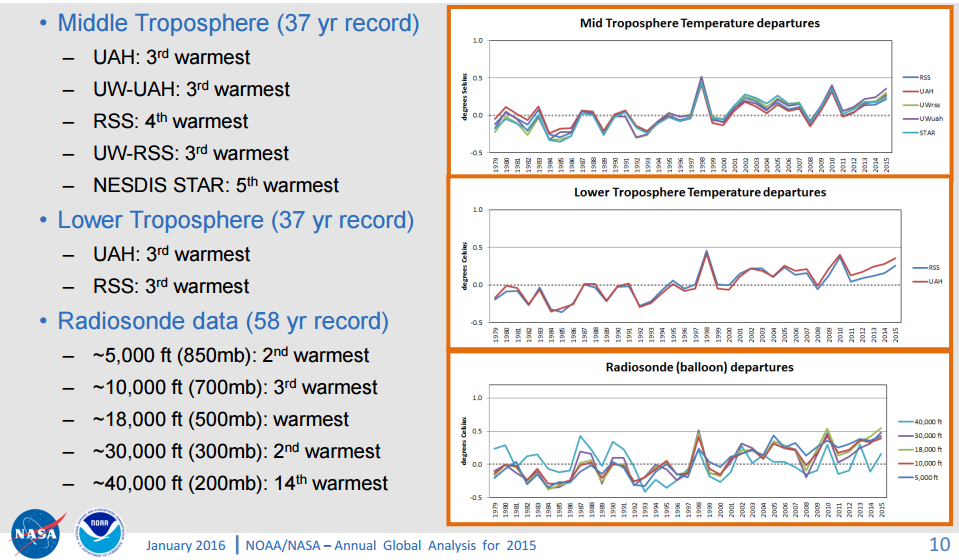
Global warming theory is based on warming in the troposphere, not in urban heat islands and fake data. NOAA and NASA’s own satellite and radiosonde data shows little or no warming in the troposphere over the last two decades, and that 2015 was not the warmest year.
201601.pdf
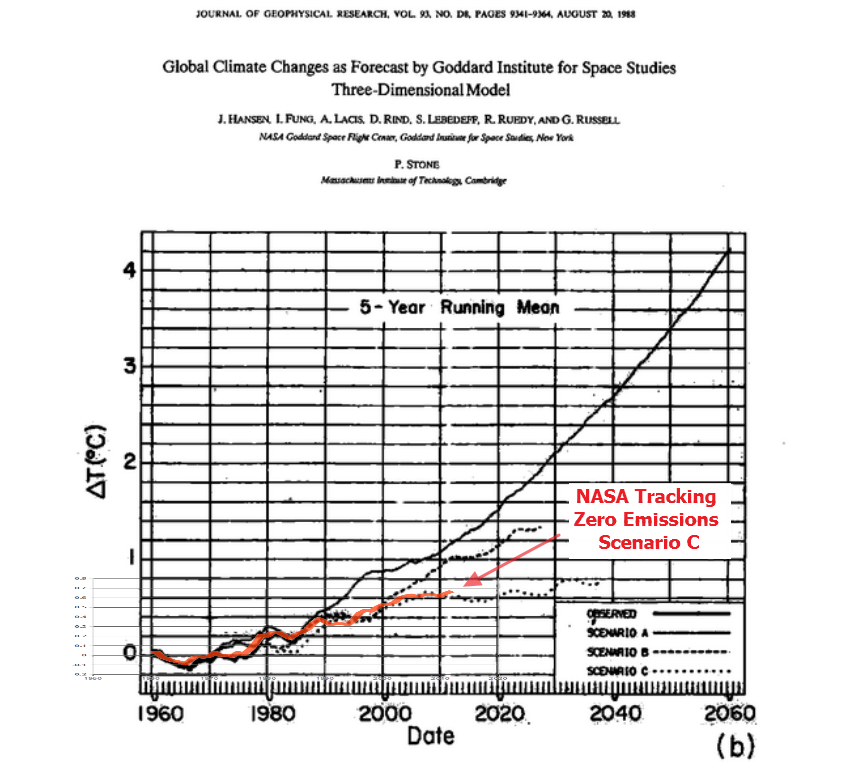
But the real fraud lies below. Even with all of the NASA and NOAA data tampering, they are still tracking Hansen’s zero emissions scenario C.
data.giss.nasa.gov/gistemp/graphs_v3/Fig.A2.txt
pubs.giss.nasa.gov/docs/1988/1988_Hansen_etal_1.pdf

1988_Hansen_Senate_Testimony.pdf
There isn’t any climate crisis. There is a massive fraud crisis – in Washington DC.


