I’ve been doing an experiment the last couple of days to lure in the clueless (like David Appell) and watch them drool when the bell rings.
Yesterday I posted a piece showing that 2014 was the coolest year on the record in the US, because it had the smallest areal coverage of hot weather. This is almost identical to how Arctic sea ice is evaluated.
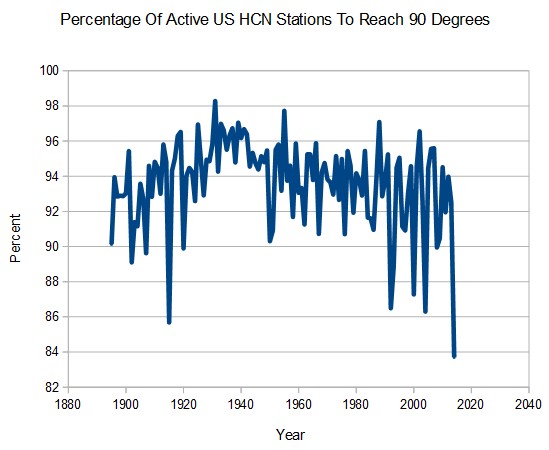
Predictably, this brought great wailing and gnashing of teeth from the usual morons. They demanded that “coolness” should be evaluated as the average temperature for the whole year. That approach is idiotic – I will show you why.
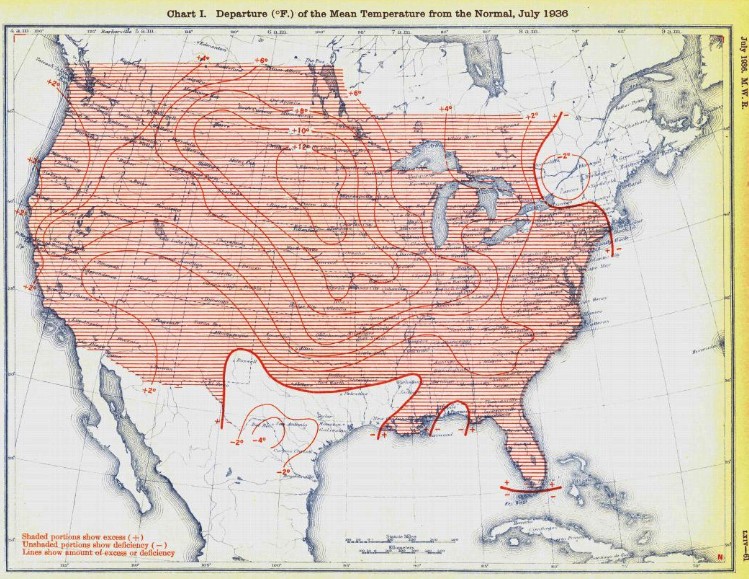
1936 had the hottest summer on record in the US. But it also had one of the coldest winters. Taken as an average for the whole year – 1936 appears to be an average year – when in fact it was both one of the hottest and coldest years on record.
The map below shows all of the stations which recorded temperatures below 0F in 1936 – all the way to central Mississippi!
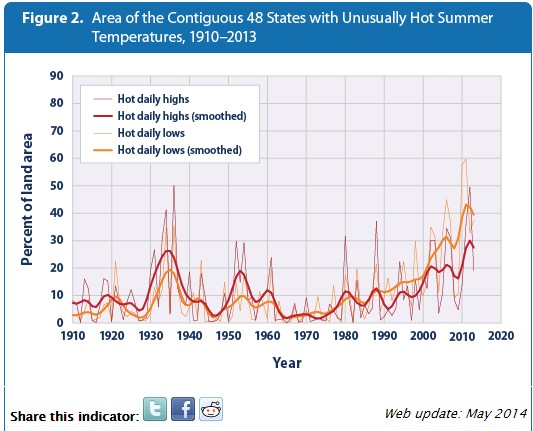
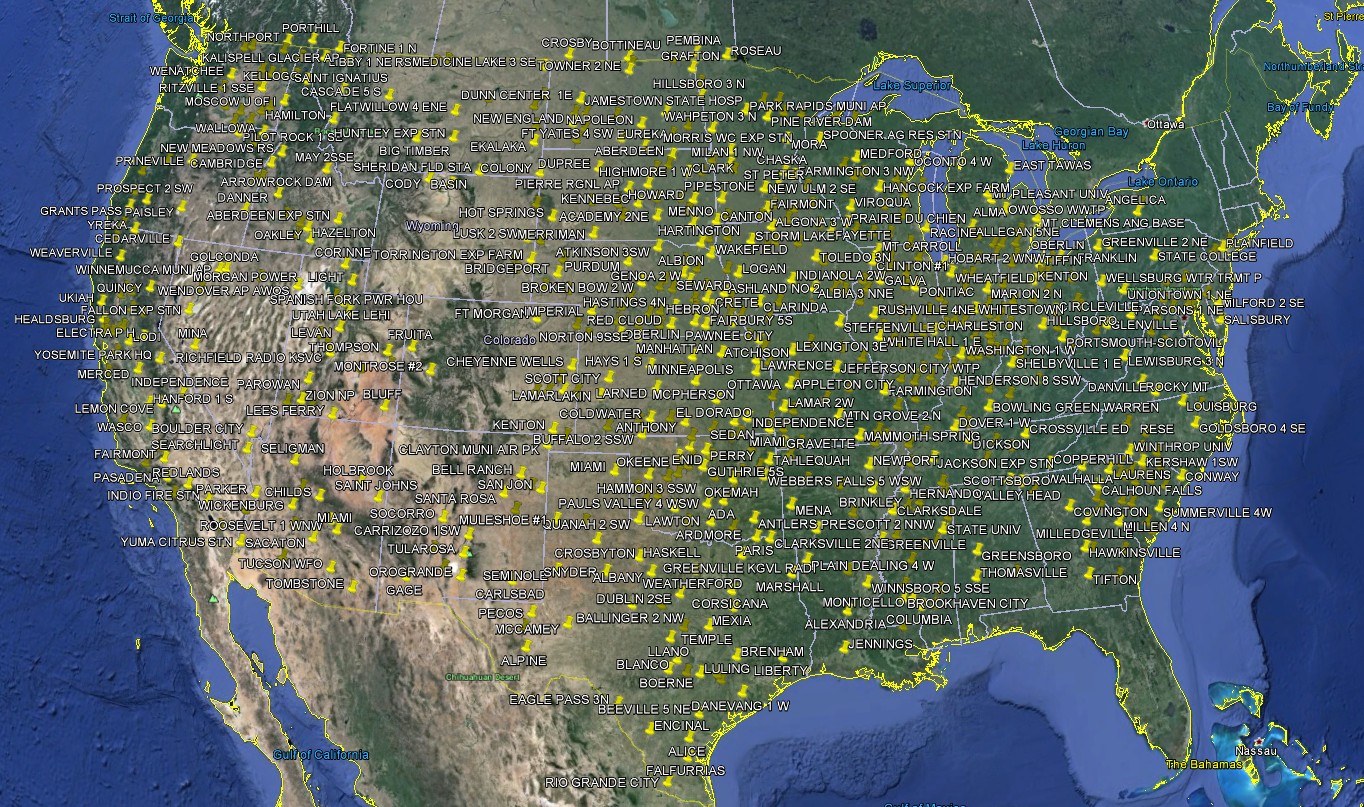
The following summer brought 110 degree weather to a huge swath of the country as shown below – completely unprecedented.
Average them all together and 1936 looks like a mild year – when in fact it was the most extreme year in US history.
Average temperature anomaly for the year was just about zero.
But the average of areal coverage of extremes shows that 1936 was the most extreme year on record. This is a much better measure of extremes than the meaningless average temperature.
Averaging temperatures can make people look really stupid, and come to really stupid conclusions. They should know better than to show up here intellectually disarmed.

 COI | Centre for Ocean and Ice | Danmarks Meteorologiske Institut


