
This map shows all the HCN stations which didn’t reach 90 degrees this year
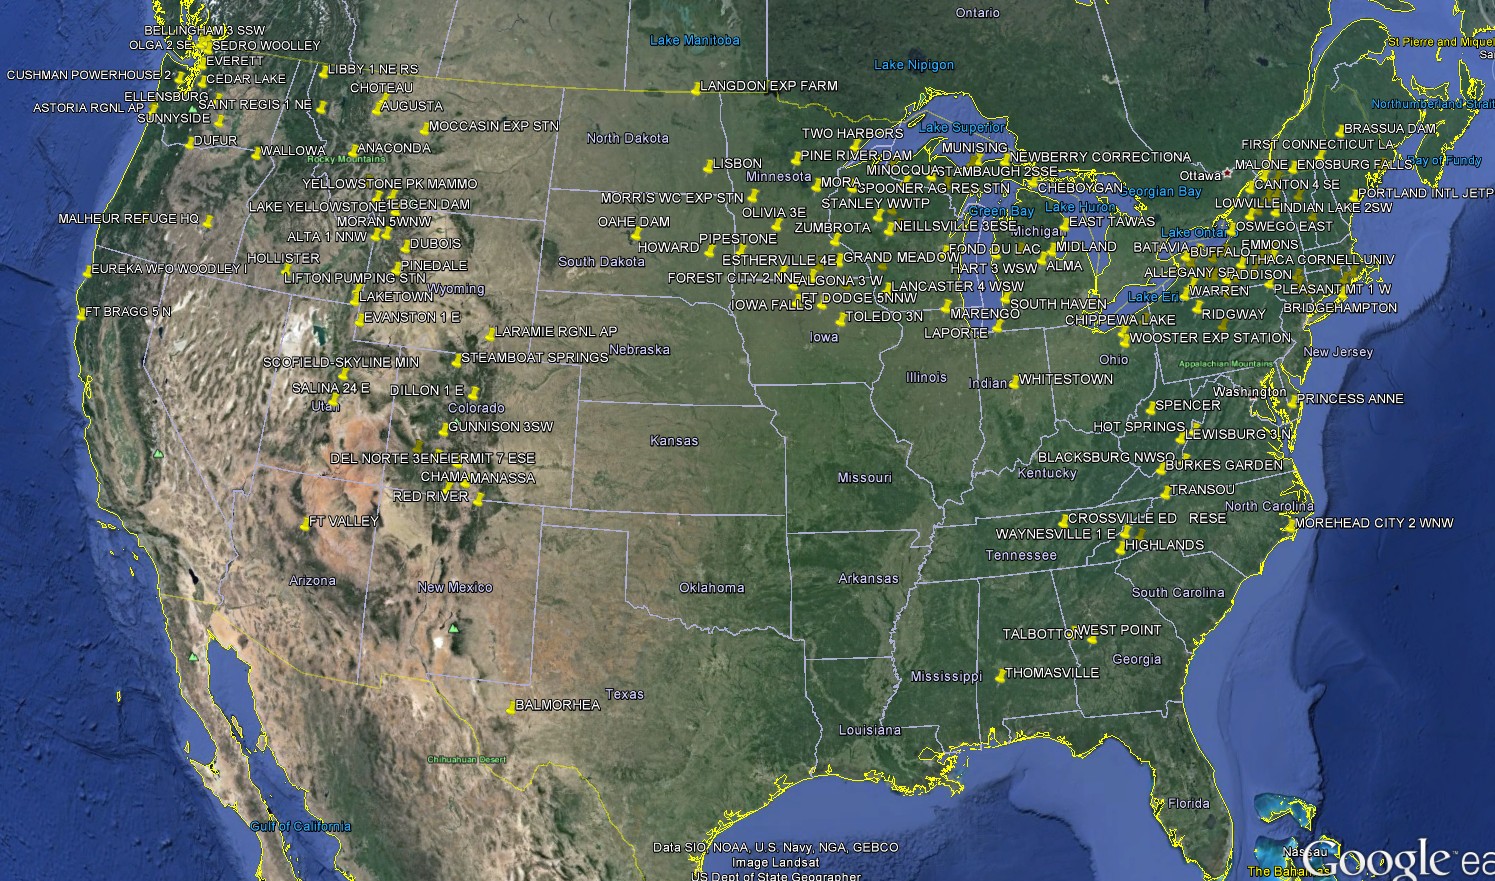
Compare vs. the same map from 1931
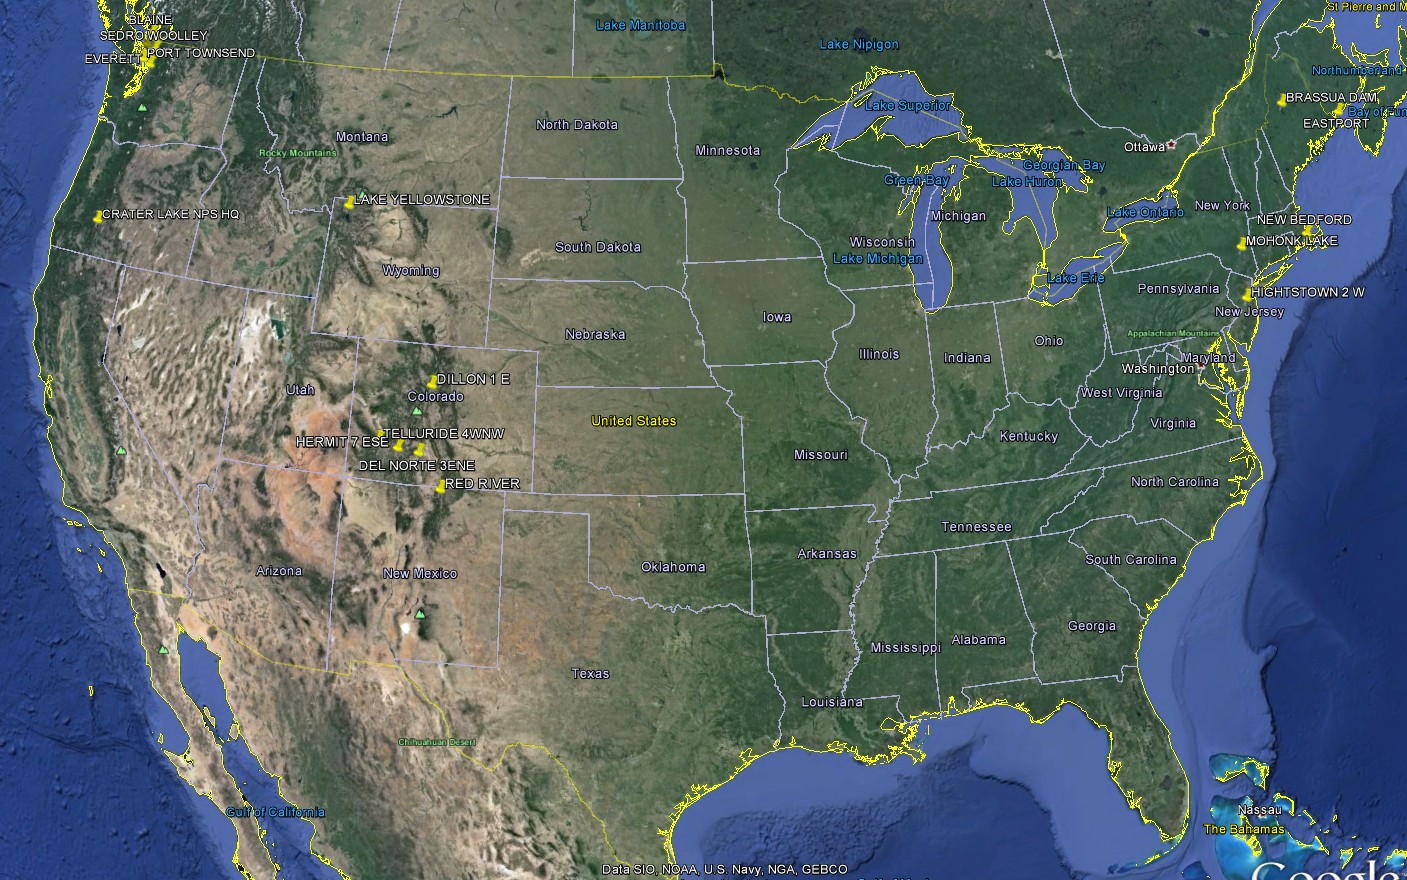
This map shows all the HCN stations which didn’t reach 90 degrees this year
Compare vs. the same map from 1931
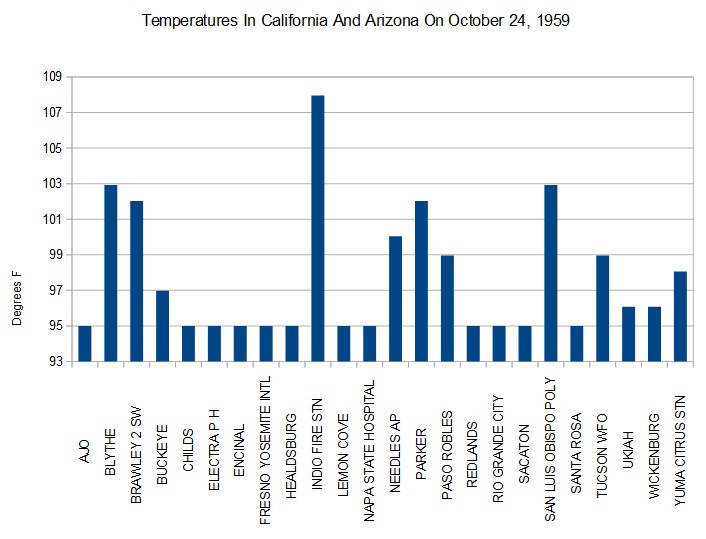
The latest BS from our friends is that they are having record heat in the west, which was 13 degrees warmer on the same date 55 years ago.
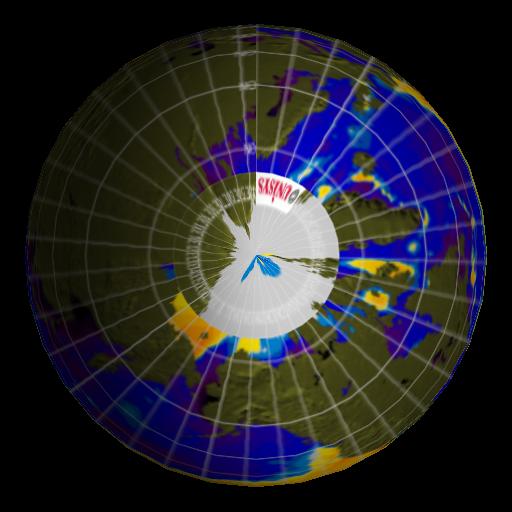
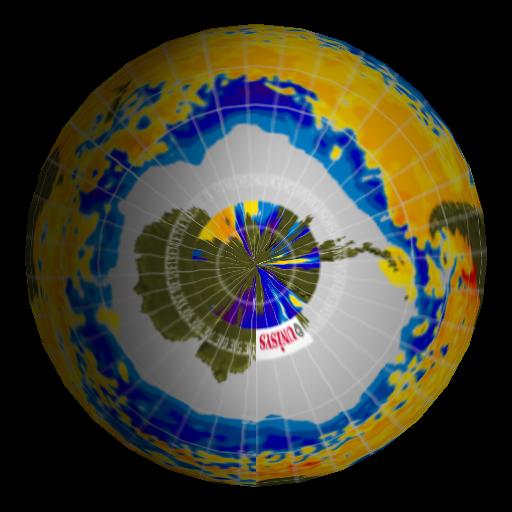
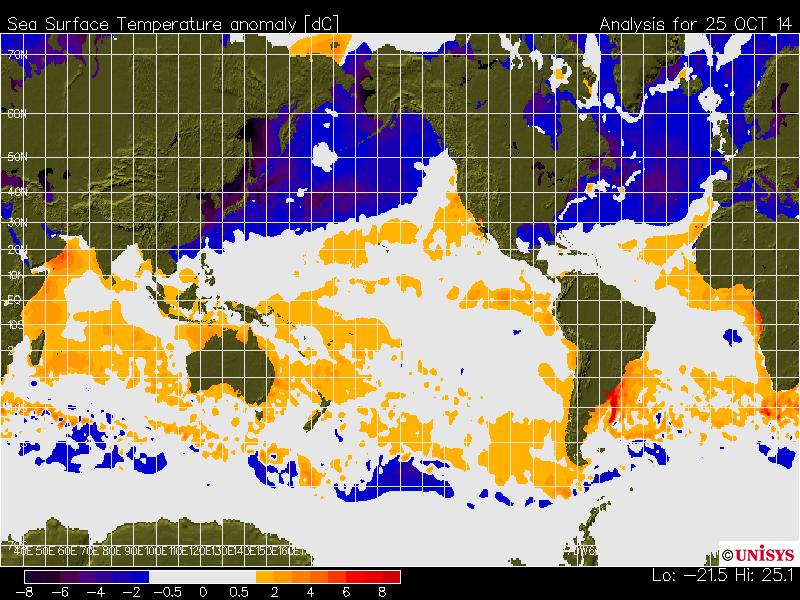
Sea surface temperature anomalies north of 40N are running far below normal
And contrary to the endless stream of lies by climate experts, sea surface temperatures around Antarctica are also running far below normal. Which is why they have record sea ice.
The next map shows the regions which deviate from normal by more than 1°C. As you can see, the oceans are running cold. The missing heat has gone missing again.
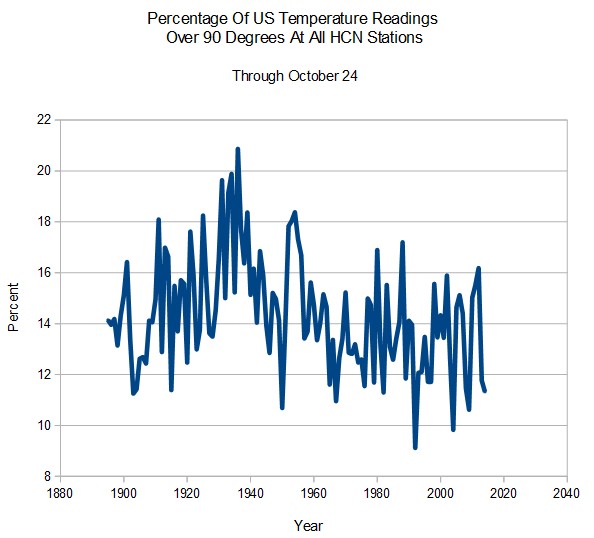
In 1931, only 16 US HCN stations (less than 2%) didn’t reach 90 degrees, compared to 10 times that many (16%) in 2014.
DEL NORTE 3ENE      	CO	USC00052184	31.1
DILLON 1 E          	CO	USC00052281	30
HERMIT 7 ESE        	CO	USC00053951	30.6
TELLURIDE 4WNW      	CO	USC00058204	28.9
EASTPORT            	ME	USC00172426	30
NEW BEDFORD         	MA	USC00195246	31.7
HIGHTSTOWN 2 W      	NJ	USC00283951	26.7
RED RIVER           	NM	USC00297323	30.6
MOHONK LAKE         	NY	USC00305426	31.7
CRATER LAKE NPS HQ  	OR	USC00351946	30.6
BLAINE              	WA	USC00450729	28.9
EVERETT             	WA	USC00452675	30
OLGA 2 SE           	WA	USC00456096	30.6
PORT TOWNSEND       	WA	USC00456678	28.9
SEDRO WOOLLEY       	WA	USC00457507	31.7
LAKE YELLOWSTONE    	WY	USC00485345	30
A record percentage of active US HCN stations (16%) did not make it to 32C this year. Many stations as far south as North Carolina did not make it to 90 degrees. Here is the list.
Name State Station ID Max Temperature C FT VALLEY AZ USC00023160 31.1 FT BRAGG 5 N CA USC00043161 26.1 DEL NORTE 3ENE CO USC00052184 30.6 DILLON 1 E CO USC00052281 28.3 GUNNISON 3SW CO USC00053662 30 HERMIT 7 ESE CO USC00053951 30 MANASSA CO USC00055322 30.6 STEAMBOAT SPRINGS CO USC00057936 31.7 TELLURIDE 4WNW CO USC00058204 30.6 GROTON CT USC00063207 27.2 STORRS CT USC00068138 30 TALBOTTON GA USC00098535 29.4 WEST POINT GA USC00099291 25 HOLLISTER ID USC00104295 21.1 LIFTON PUMPING STN ID USC00105275 31.1 MARENGO IL USC00115326 31.7 LAPORTE IN USC00124837 31.7 WHITESTOWN IN USC00129557 31.7 ALGONA 3 W IA USC00130133 31.7 ESTHERVILLE 4E IA USC00132724 31.1 FOREST CITY 2 NNE IA USC00132977 31.1 FT DODGE 5NNW IA USC00132999 31.7 IOWA FALLS IA USC00134142 31.7 NEW HAMPTON IA USC00135952 31.7 TOLEDO 3N IA USC00138296 31.7 ACADIA NP ME USC00170100 23.3 BRASSUA DAM ME USC00170814 30.6 PRINCESS ANNE MD USC00187330 26.7 ALMA MI USC00200146 30.6 BIG RAPIDS WTR WKS MI USC00200779 30.6 CHATHAM EXP FARM 2 MI USC00201486 30.6 CHEBOYGAN MI USC00201492 31.7 EAST TAWAS MI USC00202423 31.7 HART 3 WSW MI USC00203632 30.6 IRON MT KINGSFORD WWTP MI USC00204090 30.6 IRONWOOD MI USC00204104 30.6 MIDLAND MI USC00205434 31.7 MUNISING MI USC00205690 29.4 NEWBERRY CORRECTIONAL MI USC00205816 29.4 SOUTH HAVEN MI USC00207690 31.7 STAMBAUGH 2SSE MI USC00207812 30 ALBERT LEA 3 SE MN USC00210075 31.7 GRAND MEADOW MN USC00213290 30 MORA MN USC00215615 31.7 MORRIS WC EXP STN MN USC00215638 31.7 OLIVIA 3E MN USC00216152 31.7 PINE RIVER DAM MN USC00216547 26.1 PIPESTONE MN USC00216565 31.7 TWO HARBORS MN USC00218419 30.6 ZUMBROTA MN USC00219249 31.7 ANACONDA MT USC00240199 8.3 AUGUSTA MT USC00240364 31.7 CHOTEAU MT USC00241737 31.7 HEBGEN DAM MT USC00244038 28.3 LIBBY 1 NE RS MT USC00245015 31.1 MOCCASIN EXP STN MT USC00245761 26.1 SAINT REGIS 1 NE MT USC00247318 9.4 VIRGINIA CITY MT USC00248597 31.1 FIRST CONNECTICUT LAKE NH USC00272999 30.6 CHAMA NM USC00291664 30.6 RED RIVER NM USC00297323 28.9 ADDISON NY USC00300023 31.7 ALFRED NY USC00300085 30.6 ALLEGANY SP NY USC00300093 29.4 ANGELICA NY USC00300183 31.1 BATAVIA NY USC00300443 31.7 BRIDGEHAMPTON NY USC00300889 30 COOPERSTOWN NY USC00301752 30.6 DANNEMORA NY USC00301966 30.6 ELMIRA NY USC00302610 31.7 GENEVA RSCH FARM NY USC00303184 31.7 HEMLOCK NY USC00303773 30.6 INDIAN LAKE 2SW NY USC00304102 28.9 ITHACA CORNELL UNIV NY USC00304174 31.7 LAKE PLACID 2 S NY USC00304555 30.6 LOWVILLE NY USC00304912 31.1 MALONE NY USC00304996 31.1 EMMONS NY USC00305113 30.6 MOHONK LAKE NY USC00305426 30.6 NORWICH NY USC00306085 31.1 OSWEGO EAST NY USC00306314 31.7 STILLWATER RSVR NY USC00308248 28.3 TUPPER LAKE SUNMOUNT NY USC00308631 31.1 WALDEN 1 ESE NY USC00308906 26.7 WALES NY USC00308910 30.6 YORKTOWN HEIGHTS 1W NY USC00309670 31.7 HENDERSONVILLE 1 NE NC USC00313976 31.7 HIGHLANDS NC USC00314055 27.8 MOREHEAD CITY 2 WNW NC USC00315830 31.7 TRANSOU NC USC00318694 30 WAYNESVILLE 1 E NC USC00319147 30.6 Continue reading
Alarmists evaluate the health of Arctic ice, by the minimum extent of the year. They go ballistic if you try to use any other measure. They demand that you don’t average over the entire year.
So I did something very similar with heat. I determined that 2014 was the coolest year in the US, because it had the smallest coverage of hot weather. In this case, they demand that you do average over the entire year.
What a bunch of frauds. They cherry pick whatever statistic based on tampered data best suits their needs, and insist that everyone else complies.

David Appell says that this graph is fraudulent. I challenge him to either prove it, or move to Greenland and stop using fossil fuels.
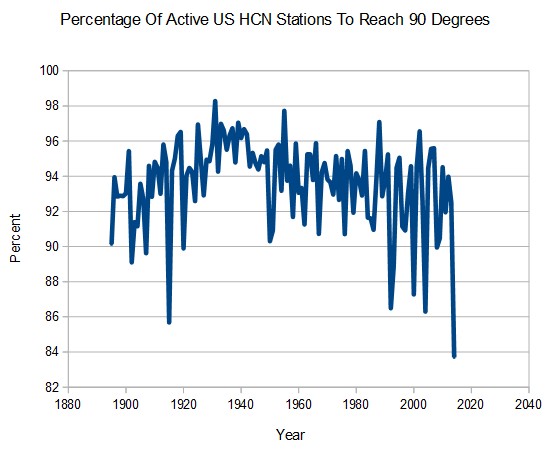
In the 1930’s, nearly one day out of five was over 90 degrees. The frequency of hot days has since plummeted, and this year less than one day out of eight was over 90 degrees.
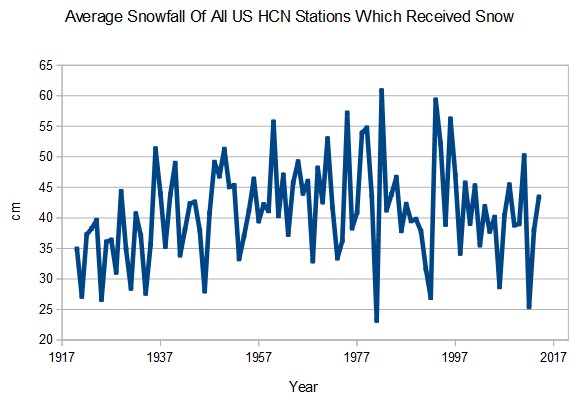
The two years with the deepest average snow in the US were the years when El Chicon and Pinatubo erupted. I remember seeing pictures of Los Alamos, NM in 1993 – with cars completely buried under the snow.
But look what happened after those eruptions. In both cases, average snow depth plummeted over the next decade.
Also note that larger extent tends to produce lower average depth, because Mississippi is not going to get a lot of snow when it does snow there, and because very cold air contains less moisture.

