Disrupting the Borg is expensive and time consuming!
Google Search
-
Recent Posts
- One Atomic Bomb Per Hour
- New Video : Analyzing Oil And Gas
- Is Antarctica Melting?
- High Speed Analysis And Visualization
- El Nino To The Rescue?
- Fake News Update
- Growth Of Antarctic Sea Ice
- 65 Years Of Progress!
- El Nino To The Rescue?
- Worst March Drought On Record
- ChartGL Process Control Demo
- The Biggest Money Laundering Scam
- Drought In The Headwaters Of Lake Powell
- Unrealistic Expectations Of Water Availability
- Did Bill Gates Do This?
- Worst March Drought On Record In The US
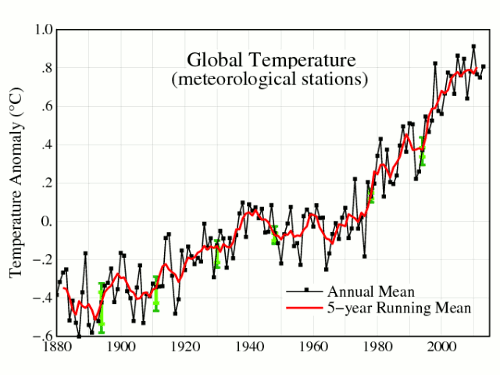
- The Real Hockey Stick Graph
- Analyzing The Western Water Crisis
- Gaslighting 1924
- “Why Do You Resist?”
- Climate Attribution Model
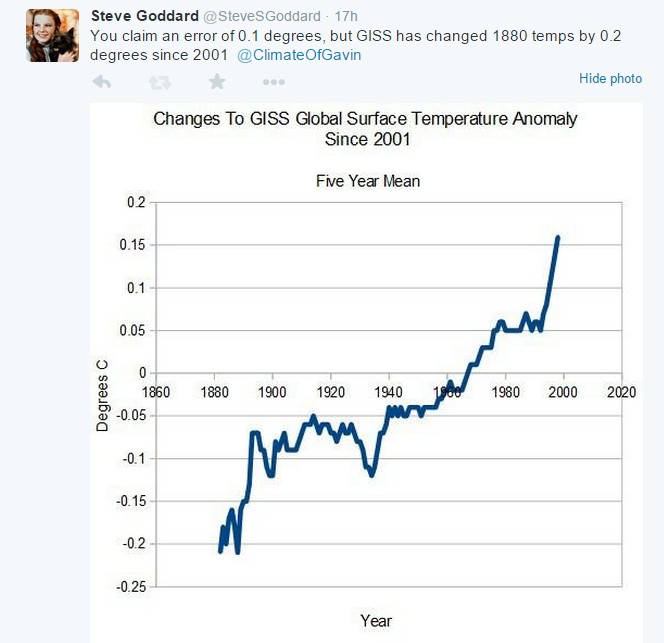
- Fact Checking NASA
- Fact Checking Grok
- Fact Checking The New York Times
- New Visitech Features
Recent Comments
- Gordon Vigurs on One Atomic Bomb Per Hour
- Bob G on One Atomic Bomb Per Hour
- Robertvd on One Atomic Bomb Per Hour
- czechlist on One Atomic Bomb Per Hour
- conrad ziefle on One Atomic Bomb Per Hour
- D. Boss on One Atomic Bomb Per Hour
A Real Hockey Stick
The percentage of the US receiving snow, steadily declined from the 19th century until about 1990. Since then there has been a massive increase in US snow cover, with 97% of US stations receiving snow during the winter of 2011.
This is what the US looked like on January 12, 2011. Every state except Florida had snow.
We had a similar situation on February 13, 2014
North American winter snow extent has been increasing since 1990 – to record levels in recent years.
Posted in Uncategorized
5 Comments
US Having Its Coolest Year On Record
The percentage of US HCN stations to reach 90 degrees was the smallest on record this year, with four of the five coolest years occurring above 350 PPM CO2. The most widespread heat occurred in 1931, when more than 98% of stations were over 90 degrees.
Posted in Uncategorized
311 Comments
Ronaldo V Messi At Noon
I’ll be at Union Jack’s pub in Columbia at noon, if you want to watch some football.
Posted in Uncategorized
7 Comments
Fort Lauderdale Sea Level Identical To 55 Years Ago
Newsbusters found this. The beach at Fort Lauderdale is identical to 55 years ago, when the movie “Where The Boys Are” was filmed.
1960
2014
People claiming sea level rise have no idea what they are talking about
Posted in Uncategorized
31 Comments
Hansen Finally Gets Something Right
Hansen points out in this video that the methane global warming scam is nothing but BS, because the concentration of CH4 is far to low to have any meaningful effect. Look for alarmists to ignore their prophet.
[youtube=https://www.youtube.com/watch?v=grYOoJfr3ao]
Posted in Uncategorized
15 Comments
Gavin Doesn’t Understand His Own Data
Yesterday on twitter I pointed out to Gavin that he calculates 1880 surface temperatures to 0.01 precision, despite not having any data for most of the land surface.
Gavin responded by claiming that his use of error bars means he is not calculating 0.01 precision.
I responded with the GISS data, and showed that he is reporting temperatures to 0.01 precision.
But here comes the real kicker. Gavin claims 0.1 error bars, but GISS has changed their own data by much more than that since 2001.
2001 version : wayback.archive.org/web/20010507……FigA.txt
The animation below alternates between the current graph with error bars, and the 2001 version. The points from the 1880’s are nearly 300% outside of Gavin’s top error bars.
They are adjusting the data by a much larger amount than their own error bars, which is scientific gibberish.
Everything about NASA temperature data reeks of propaganda. It doesn’t pass the most basic sniff tests as legitimate data. The error bars are meaningless green crayon.
Posted in Uncategorized
24 Comments
Relationship Of Sea Level And Lower Troposphere Temperature Along The Equator
Along the equator, sea surface height and lower troposphere temperature track each other very closely
At the blue circle we see almost perfect correlation between changes in lower troposphere temperature and changes in sea surface height (see graph below.) Note that neither shows any net change since 1992.
Posted in Uncategorized
15 Comments
Peter Gleick Continues His Criminal Activity In California
Here’s How San Francisco is Bracing for Sea Level Rise
Estimated to Impact $48 Billion in Assets
October 24, 2014San Francisco’s Capital Planning Committee (CPC) has adopted what is being called the most comprehensive guidelines in the nation for preparing for the impacts of sea level rise on a city’s infrastructure.
“This is the first time that I’ve seen a city really actively assessing the risks to new public investments,” Jessica Grannis of Georgetown’s Climate Center told VICE News.
The guidelines assume sea level rise of 11 inches, plus or minus 4 inches, by 2050 and as much as 66 inches by 2100.
With roughly seven million people living in the San Francisco Bay Area, the potential for displacement and damage to business and ecosystems is enormous. The Pacific Institute, a think-tank focusing on sustainable development, estimates $48 billion of assets could be impacted in San Francisco alone.
“Over the next 10 years we expect that we are going to be investing $25 billion in public infrastructure in San Francisco,” Brian Strong, Director of San Francisco’s Capital Planning Program, told VICE News.
While fishing for money, Gleick apparently forgot to tell them that neither tide gauges nor satellites show any sea level rise around San Francisco.
Tide gauge in the San Francisco Bay shows no sea level rise for 70 years.
CU satellite sea level data for San Francisco also shows no rise in sea level.
The city government is being defrauded out of tens of billions of dollars, to solve a problem which doesn’t exist.
Posted in Uncategorized
17 Comments


