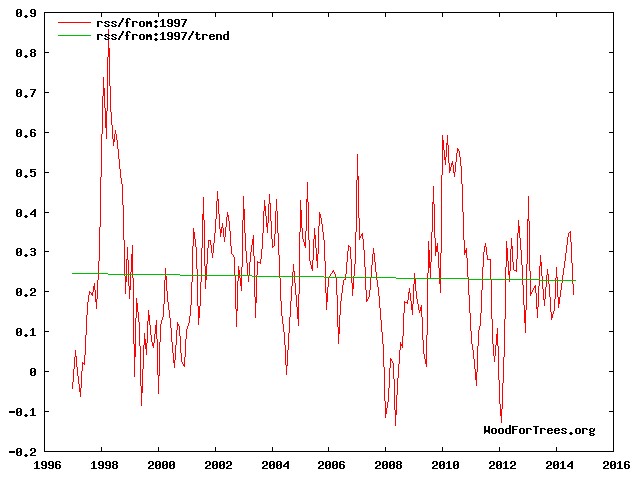
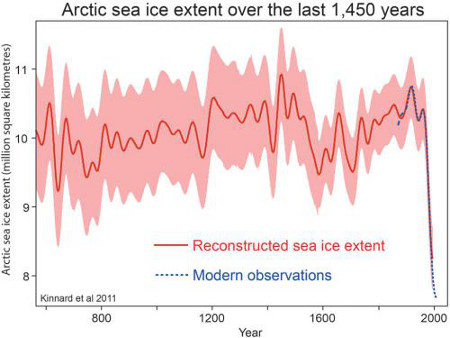
Dana is unhappy about 60% growth in the Arctic summer minimum sea ice extent, area and volume over the past two years – so he published these graphs which show Arctic ice falling off a cliff
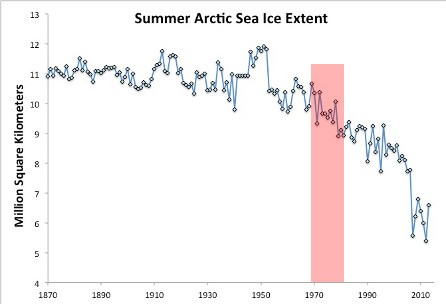
Note that he cleverly left off the huge increase since 2012, and the second graph shows a sharp decrease from 1970 to 1979, which is in direct contradiction to satellite data from the 1990 IPCC report – which showed a 2 million km² increase from 1974 to 1979.
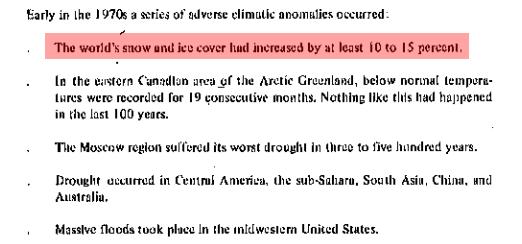
But Dana’s BS is worse than it seems. The CIA reported in 1974 that the ice had already increased 10-15% by 1974, which is again shown the opposite on Dana’s graph
Amundsen said the Northwest Passage was open in 1904, and it wasn’t in 2014
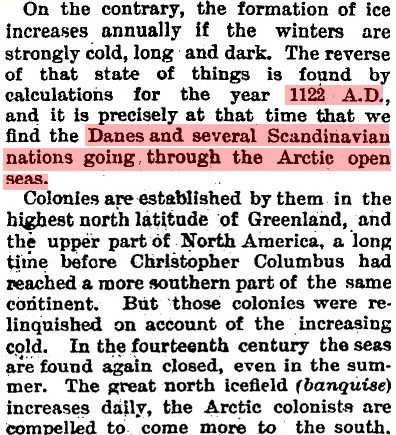
And Dana’s other fake graph somehow missed the fact that the Vikings traveled through open Arctic seas in the year 1122. The top graph shows almost 50% more ice around that time period.
Dana slimed his readers at so many different levels, that it must have been written by him. Arctic ice extent is second highest in the past decade.
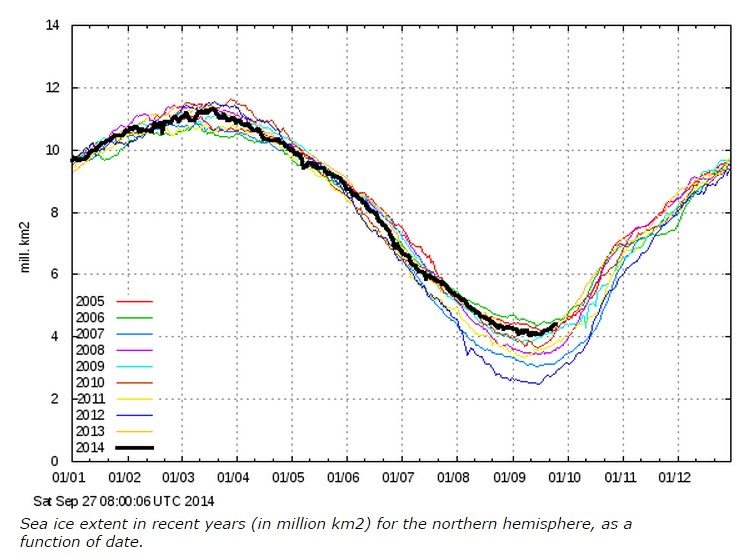 COI | Centre for Ocean and Ice | Danmarks Meteorologiske Institut