Disrupting the Borg is expensive and time consuming!
Google Search
-
Recent Posts
- One Atomic Bomb Per Hour
- New Video : Analyzing Oil And Gas
- Is Antarctica Melting?
- High Speed Analysis And Visualization
- El Nino To The Rescue?
- Fake News Update
- Growth Of Antarctic Sea Ice
- 65 Years Of Progress!
- El Nino To The Rescue?
- Worst March Drought On Record
- ChartGL Process Control Demo
- The Biggest Money Laundering Scam
- Drought In The Headwaters Of Lake Powell
- Unrealistic Expectations Of Water Availability
- Did Bill Gates Do This?
- Worst March Drought On Record In The US
- The Real Hockey Stick Graph
- Analyzing The Western Water Crisis
- Gaslighting 1924
- “Why Do You Resist?”
- Climate Attribution Model
- Fact Checking NASA
- Fact Checking Grok
- Fact Checking The New York Times
- New Visitech Features
Recent Comments
- Robertvd on One Atomic Bomb Per Hour
- czechlist on One Atomic Bomb Per Hour
- conrad ziefle on One Atomic Bomb Per Hour
- D. Boss on One Atomic Bomb Per Hour
- Gordon Vigurs on One Atomic Bomb Per Hour
- BenV on One Atomic Bomb Per Hour
Human Rights Progress During 2020
“We know that no one ever seizes power with the intention of relinquishing it. Power is not a means; it is an end.”
? George Orwell, 1984
Posted in Uncategorized
Leave a comment
“NOAA Predicts”
Three weeks ago, NOAA predicted 30% maximum ice cover for the Great Lakes, due to climate change.
They are currently at 32%, and with record cold forecast next week should be above 50% in a few days.
Four of the last seven years have been above average, and 2014 was second highest on record. That is what NOAA calls a “declining trend.”
Note that NOAA started their graph in the mid-1970s, right before the three coldest winters on record in the Great Lakes states – 1977, 1978 and 1979.
The winter of 1977 was the coldest on record in the eastern US.
20 Jan 1977, Page 3 – Valley News
Lakeland Ledger – Google News Archive Search
19 Jan 1977, Page 20 – The Town Talk at Newspapers.com
The National Geographic Archive | December 1977 | page 1
And while I am on the topic of ice …
Posted in Uncategorized
Leave a comment
Hottest Year Ever
A look back on twenty years of spectacular incompetence by our leading climate experts and journalists.
Posted in Uncategorized
Leave a comment
Coldest Valentines Day On Record
This year may be the coldest Valentines Day on record. The warmest occurred 100 years ago in 1921, which was the second warmest year on record in the US. In this video I discuss the heat of 1921, and how government agencies have tried to erase it.
Posted in Uncategorized
Leave a comment
Washington Post Explains Cold Winters
The Washington Post says cold winters are caused by disrupted Polar Vortex, which is caused by global warming. And three weeks ago they said Americans are “winter starved.”
Here is their diagram showing what global warming has done to the Polar Vortex.
What a ‘wrecked’ polar vortex means for winter-starved Americans
Here is the same diagram from Science News in 1975, which showed what global cooling did to the Polar Vortex.
The Washington Post said colder winters indicated a disastrous new ice age which would begin as early as 2021.
washingtonpost.com – search nation, world, technology and Washington area news archives.
U.S. Scientist Sees New Ice Age Coming
“Winter starved Americans” are facing the coldest February since 1936.
Posted in Uncategorized
Leave a comment
Coldest Valentines Day On Record
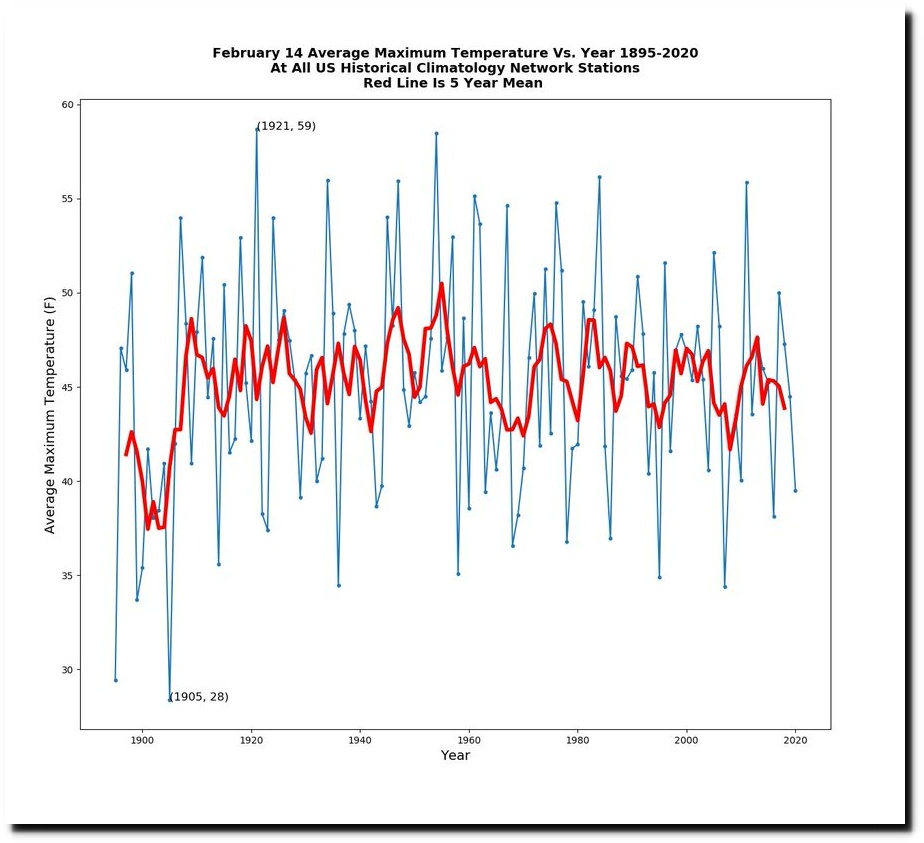
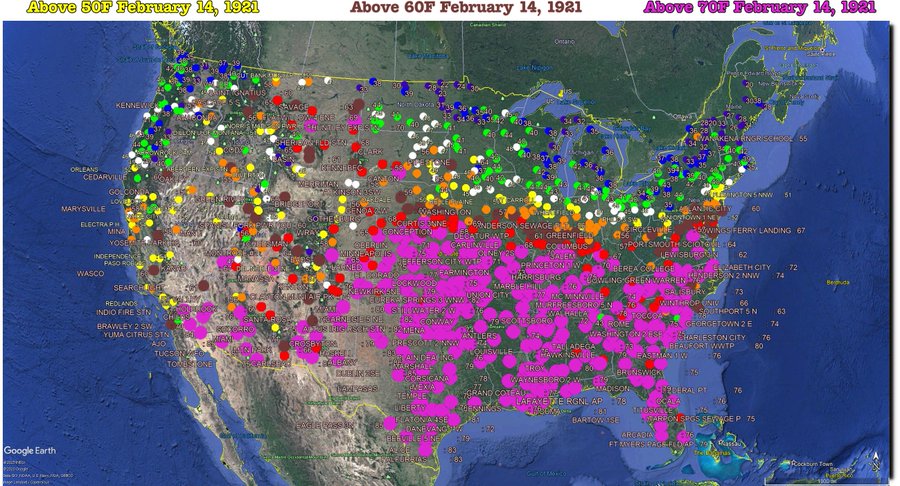
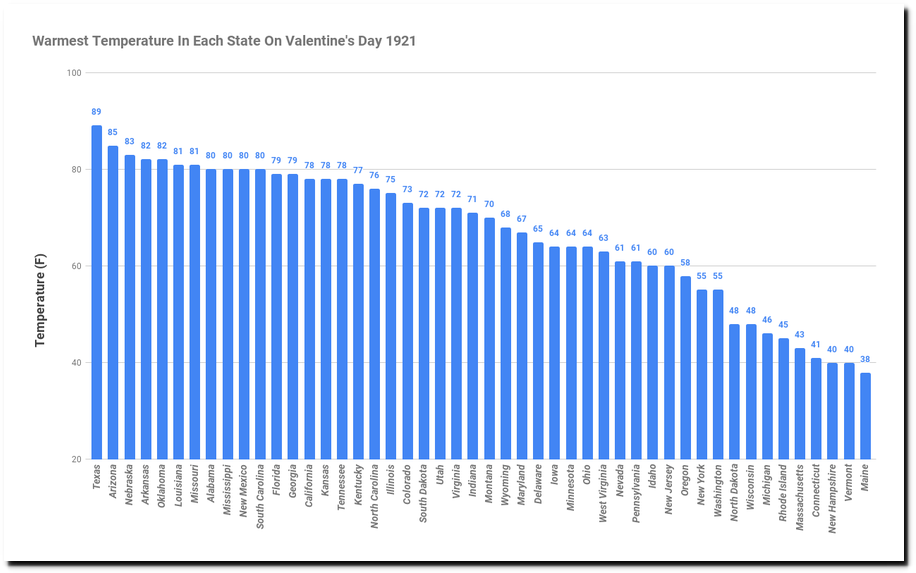
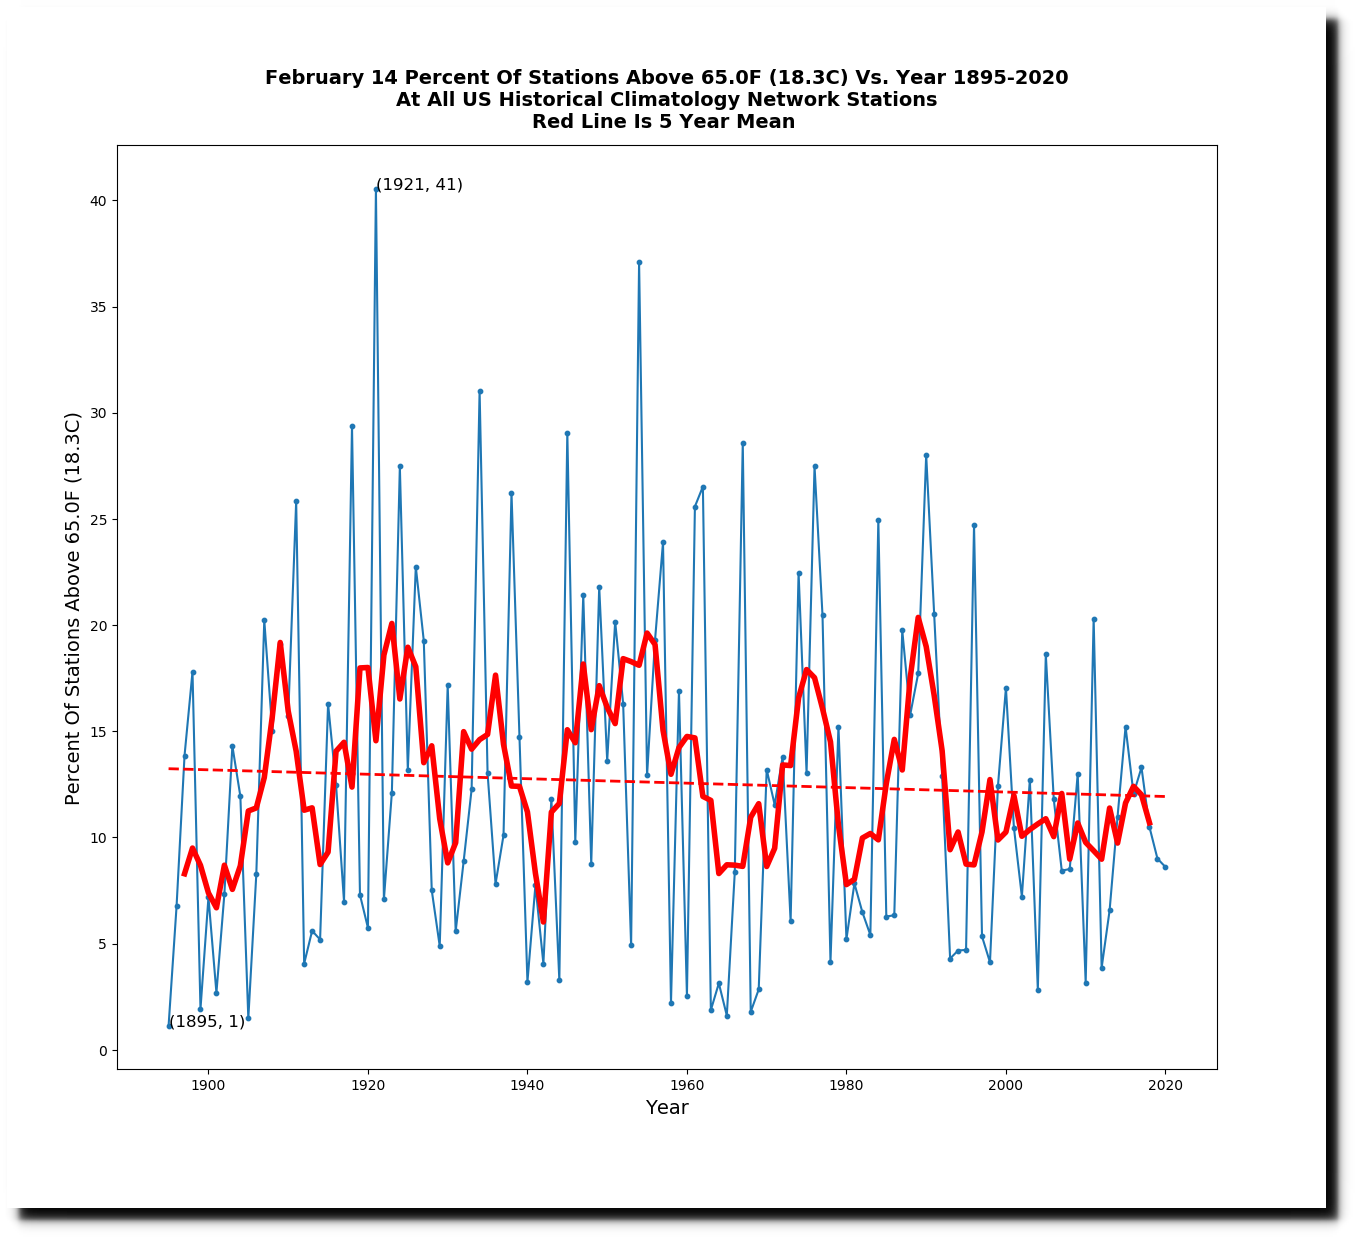
The warmest Valentines Day in the US occurred 100 years ago in 1921.
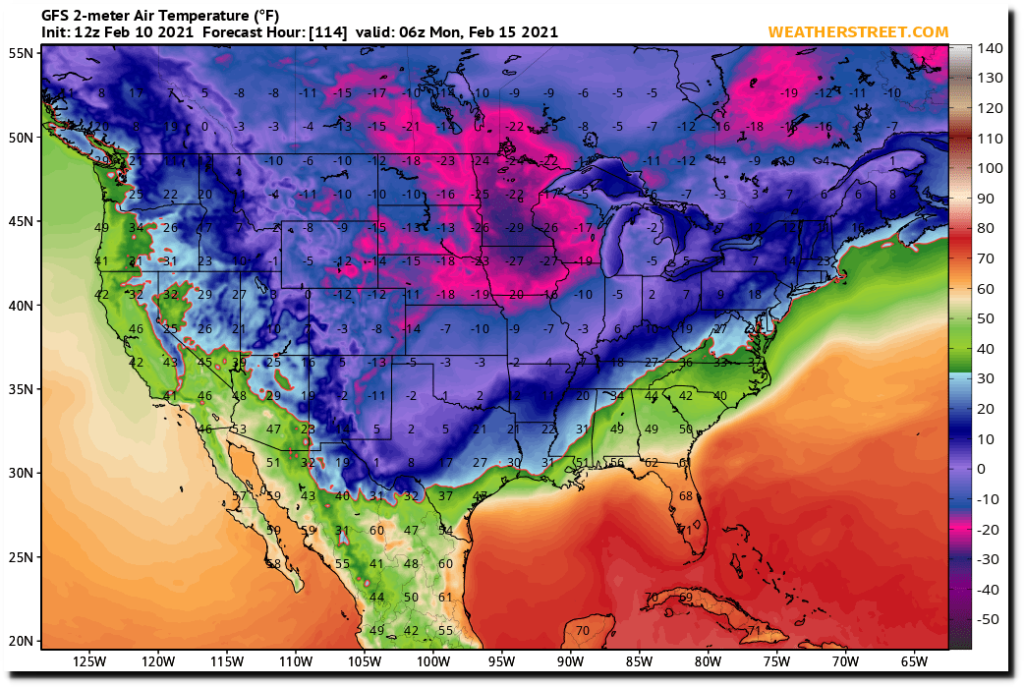
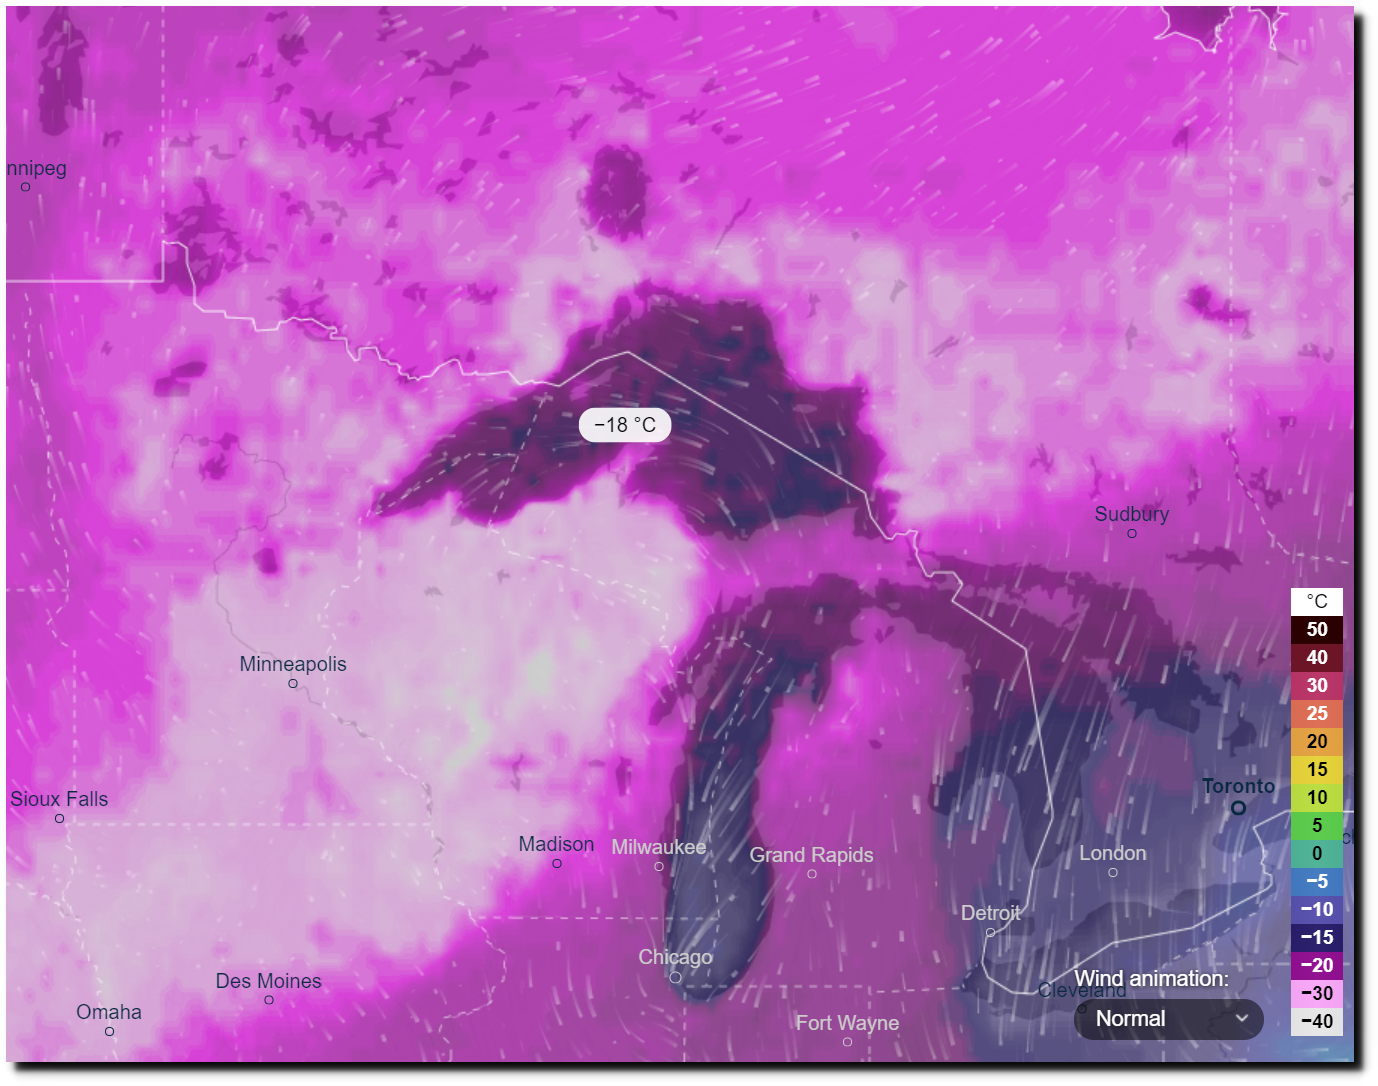
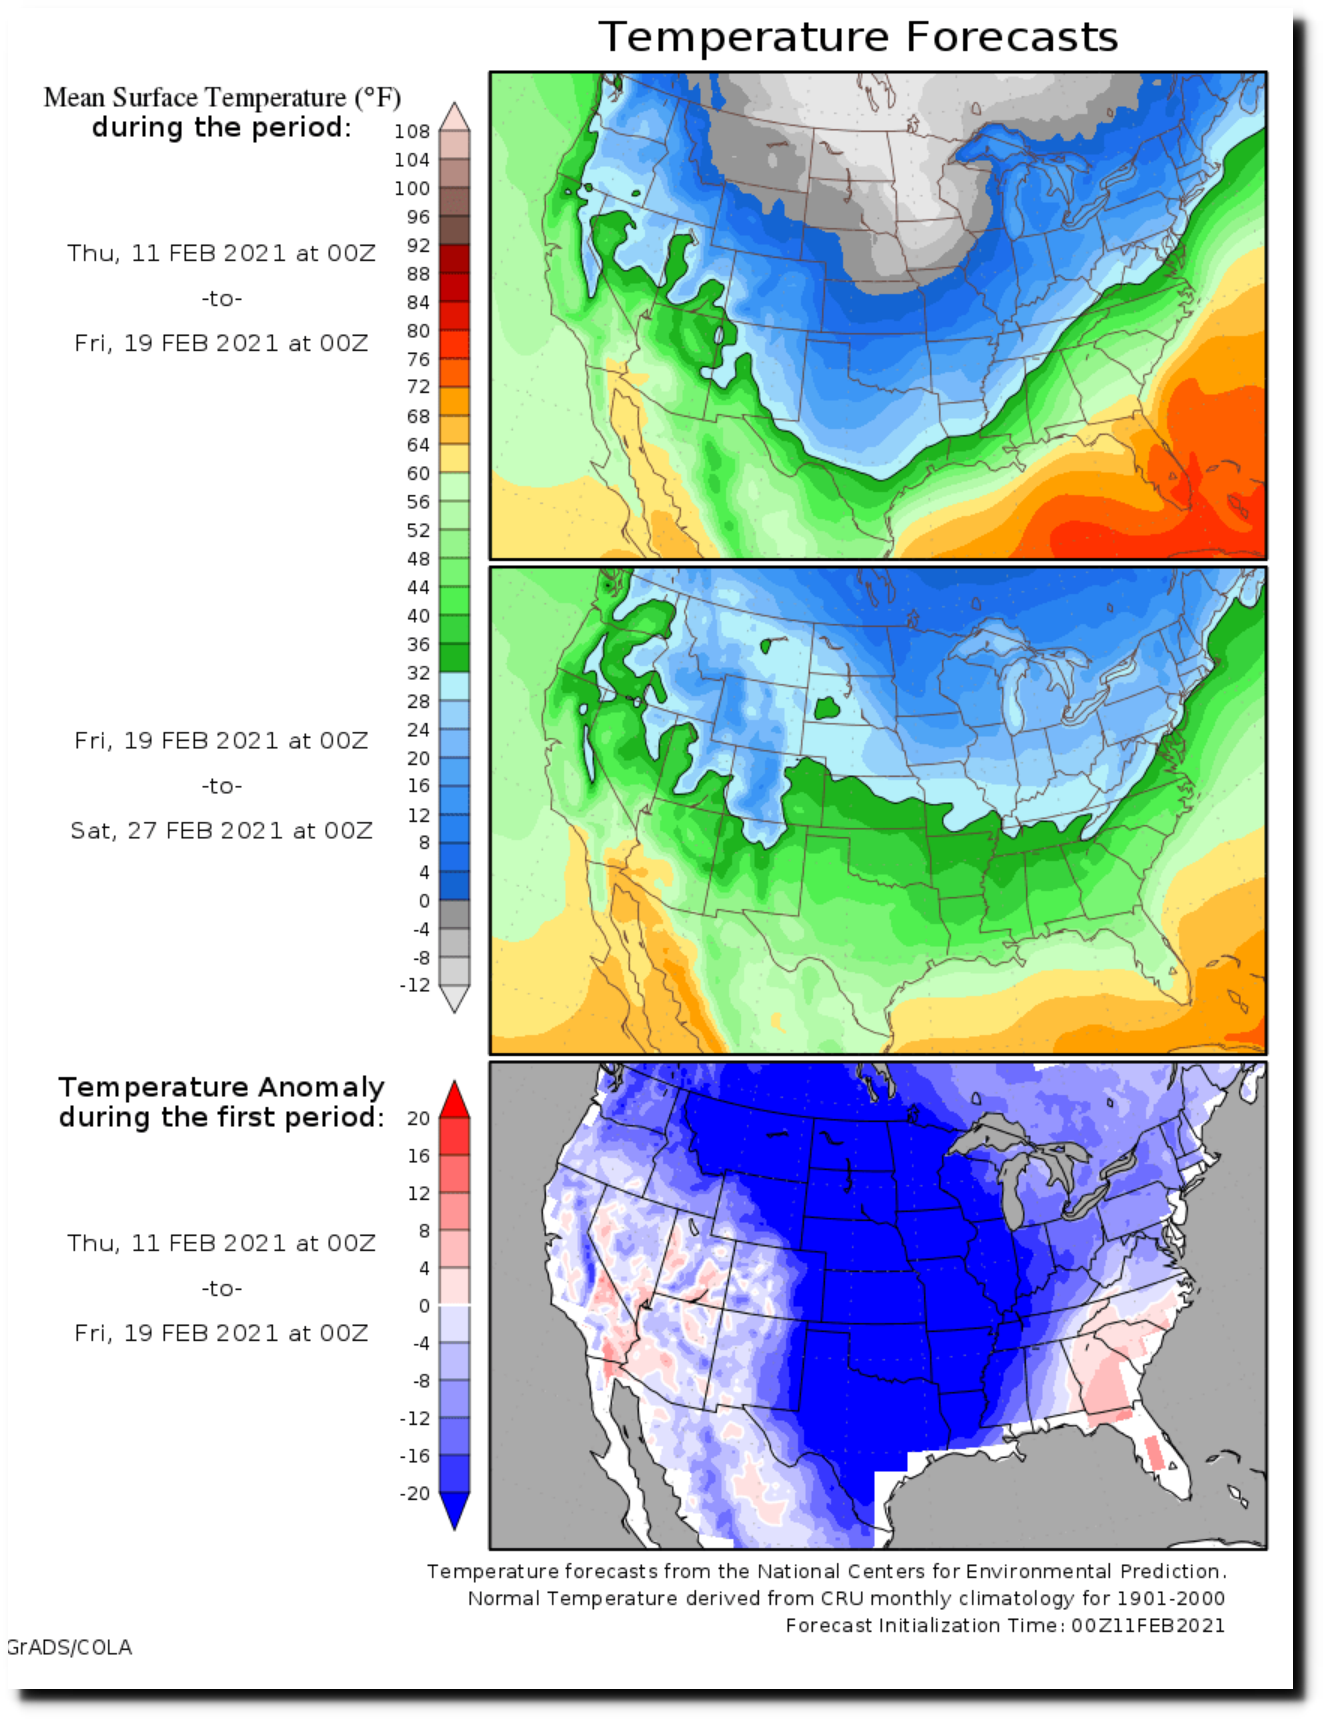
But this year, the US is looking at record cold.
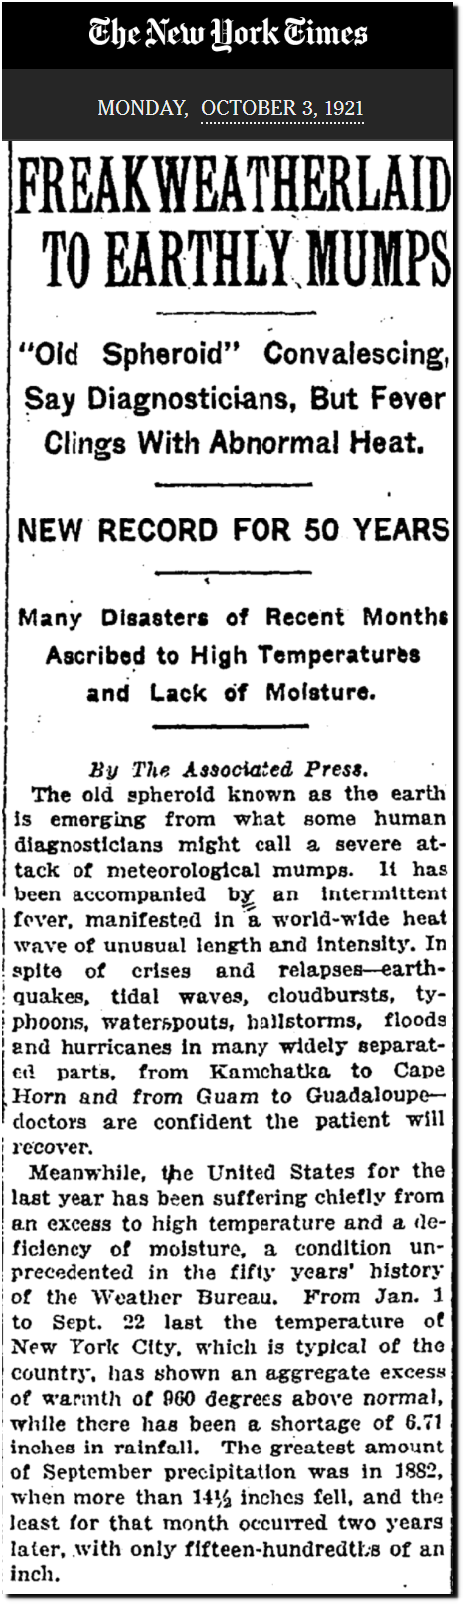
In 1921, the New York Times reported that Earth had a fever.
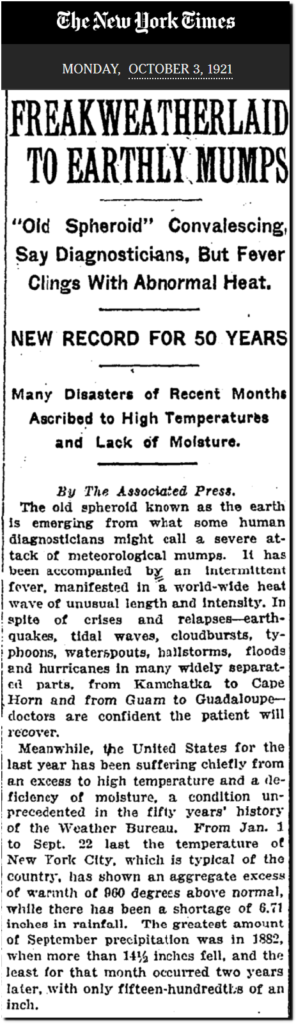
TimesMachine: October 3, 1921 – NYTimes.com
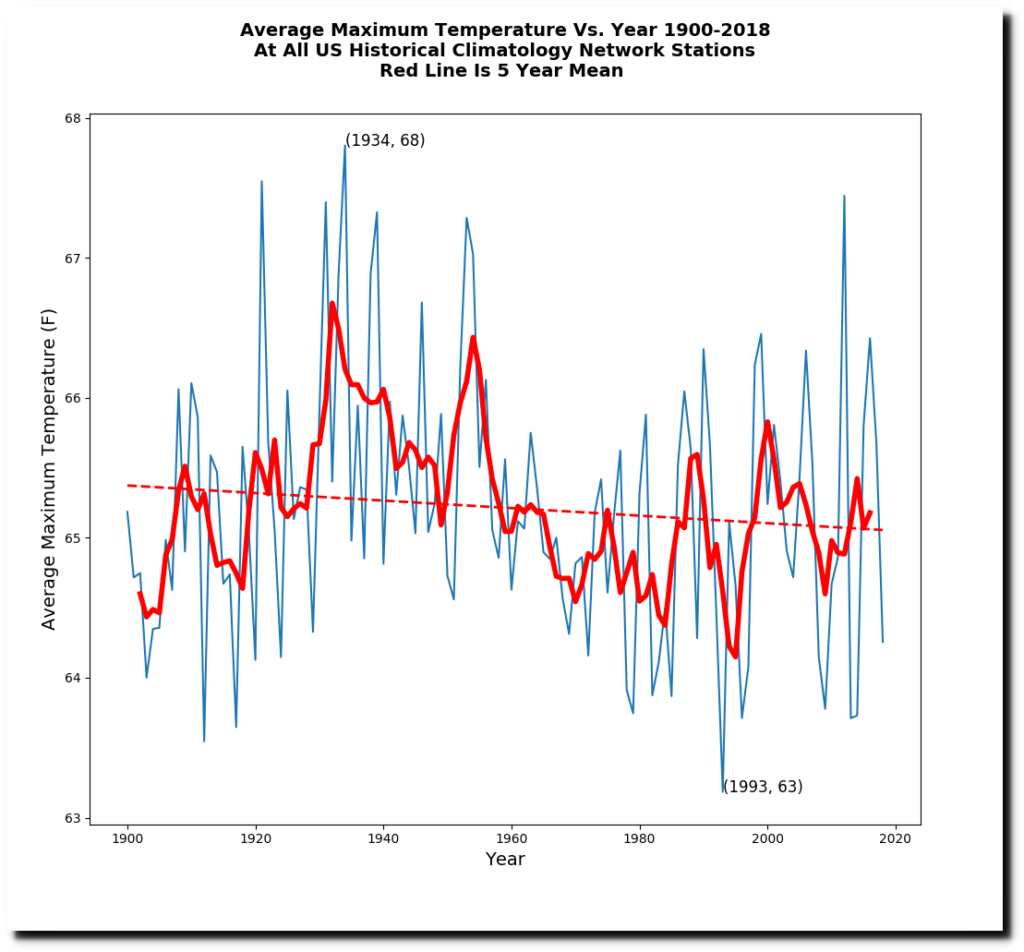
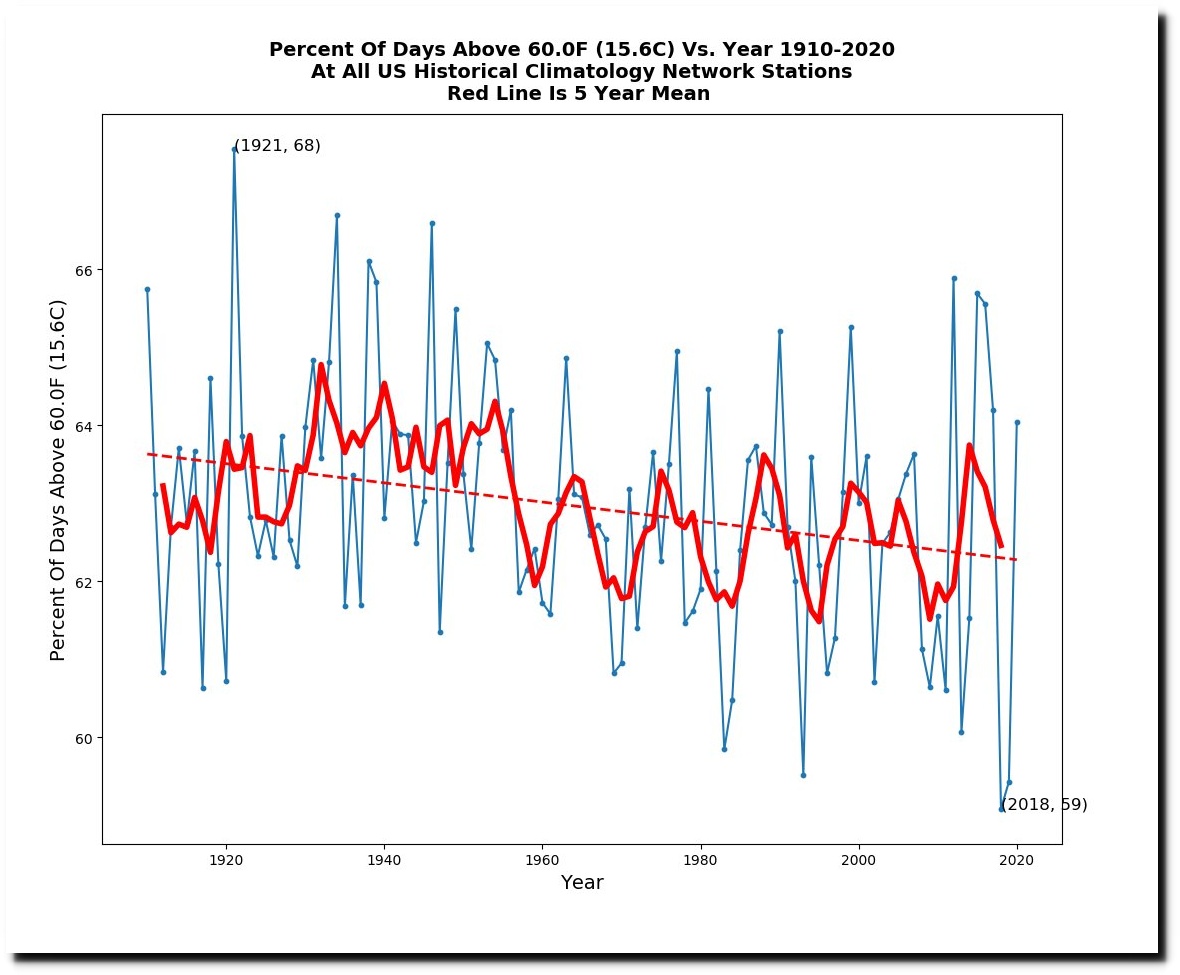
The average daily maximum temperature in the US during 1921 was the second highest on record.
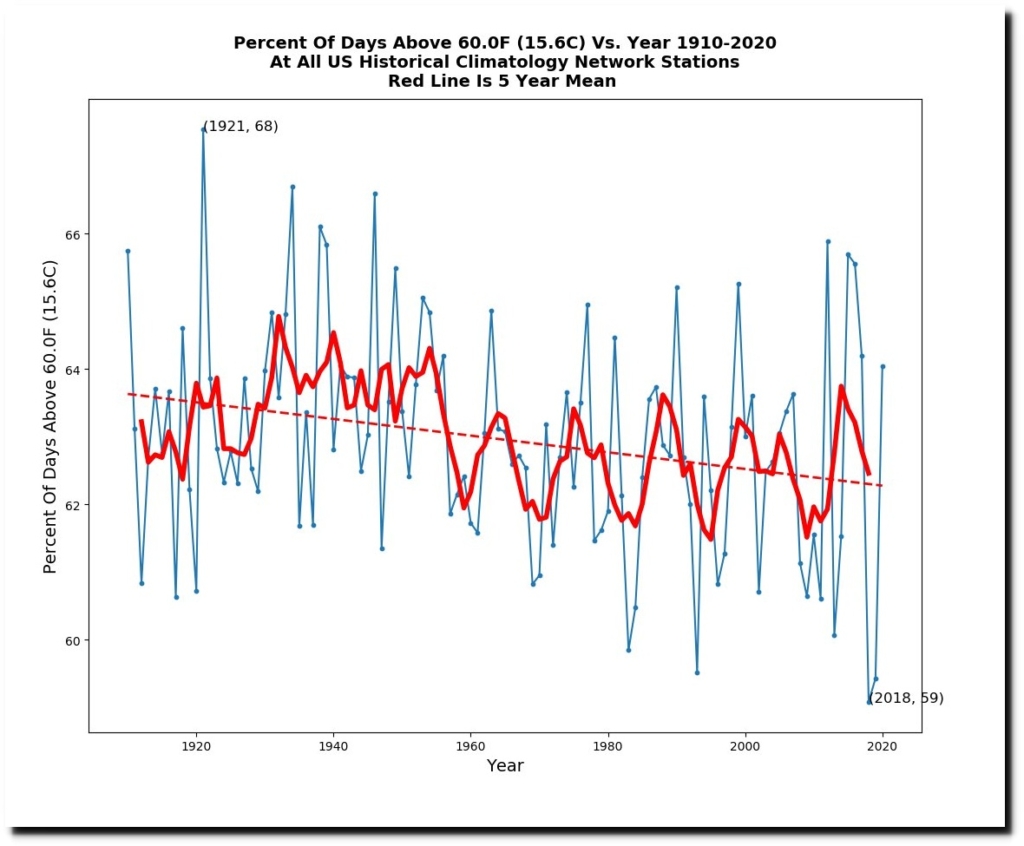
The percent of warm days in the US was highest on record in 1921. The two least warm years of past century were 2018 and 2019.
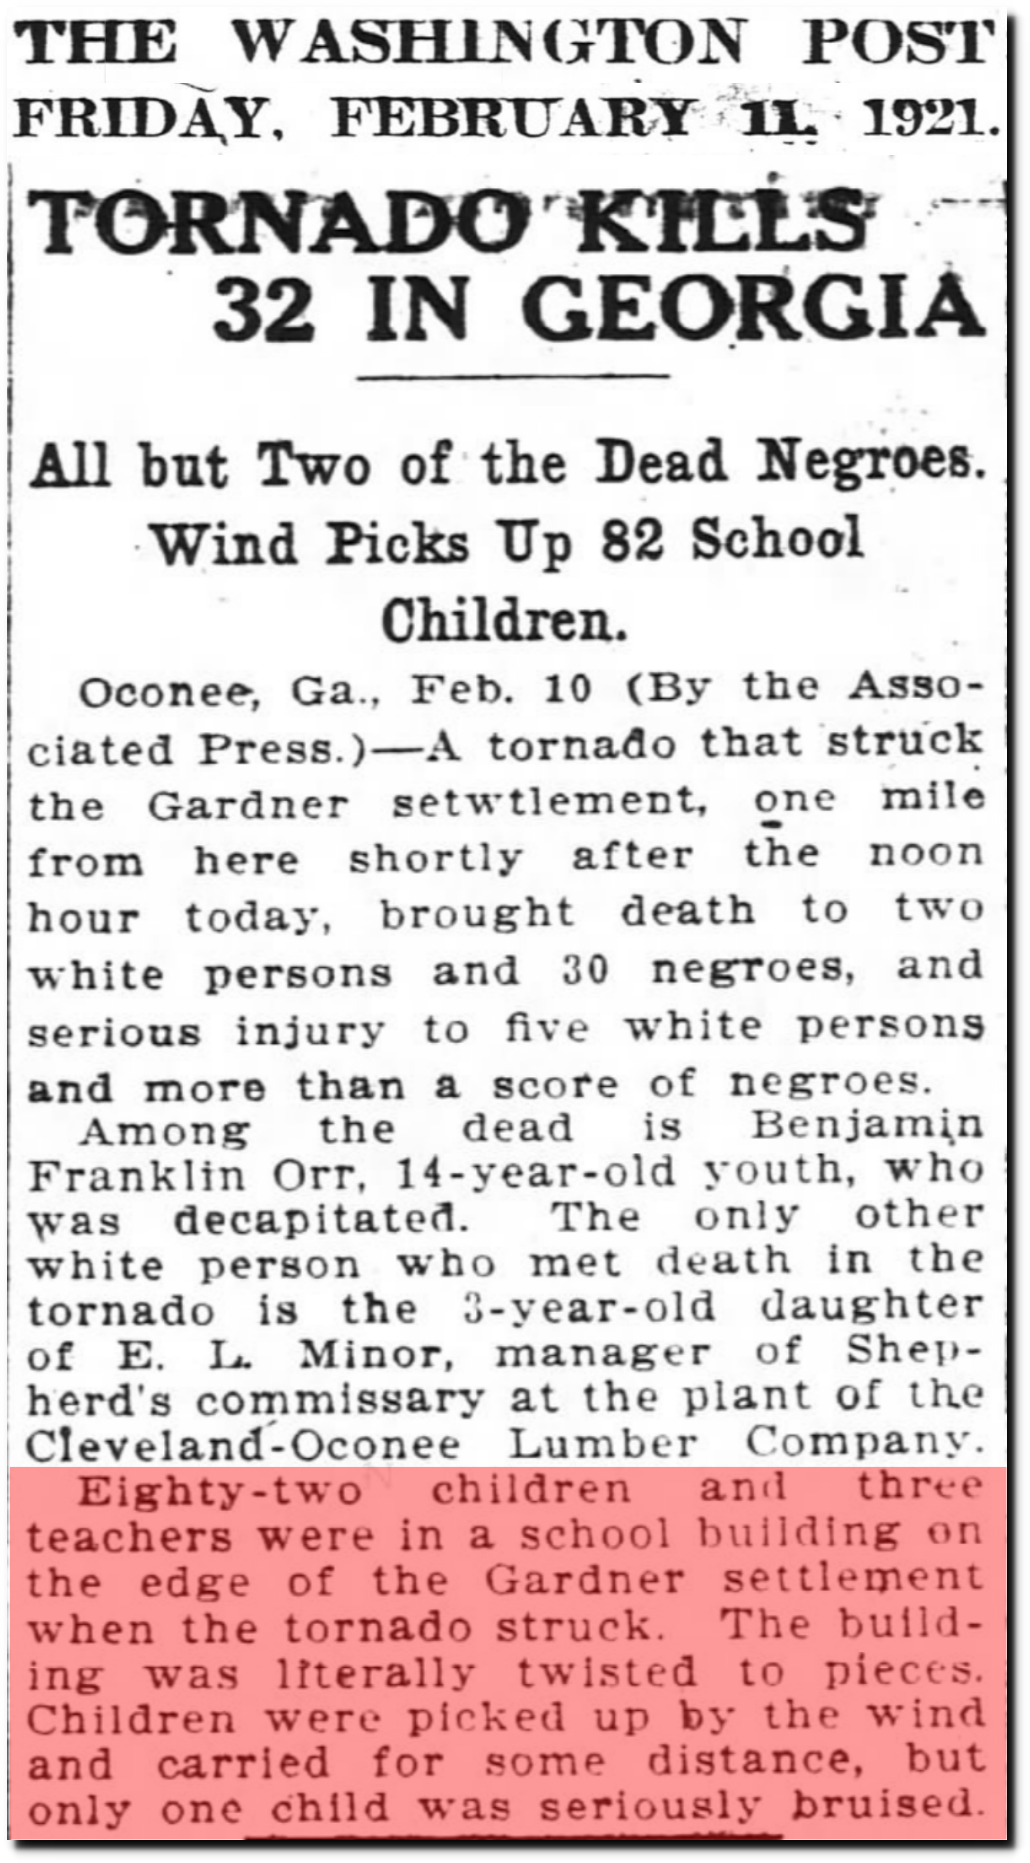
The year 1921 brought a lot of extreme weather.
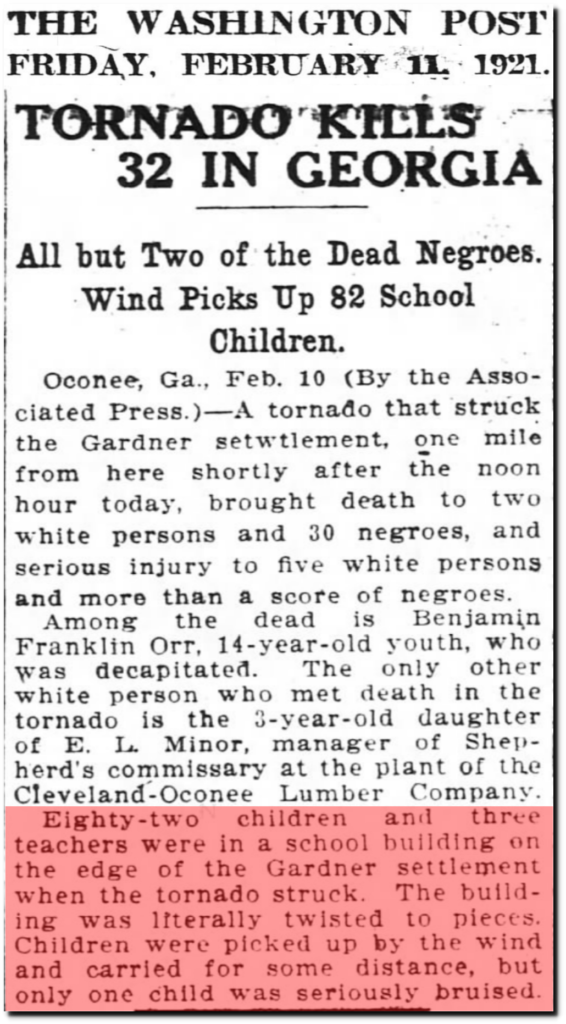
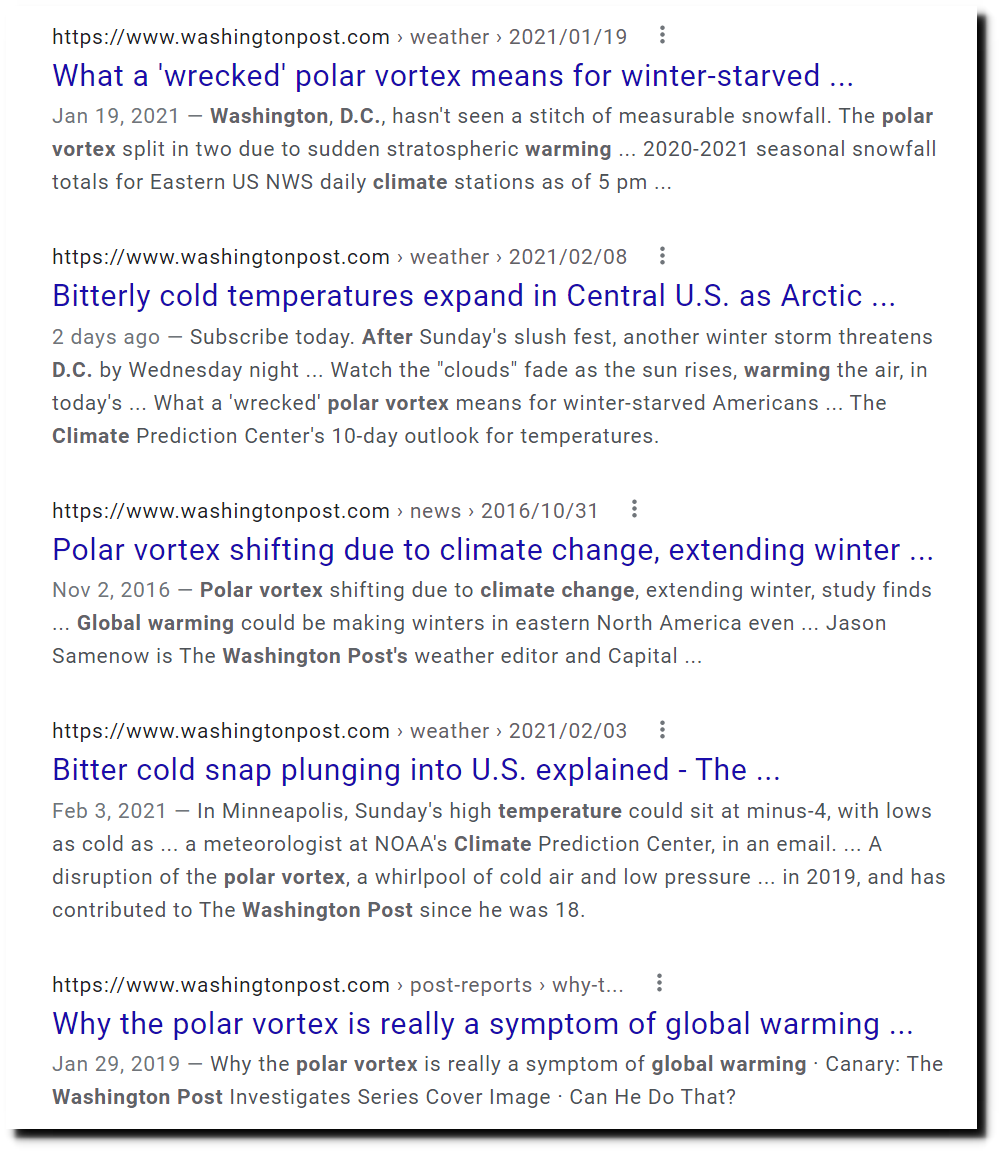
11 Feb 1921, Page 2 – The Washington Post at Newspapers.com
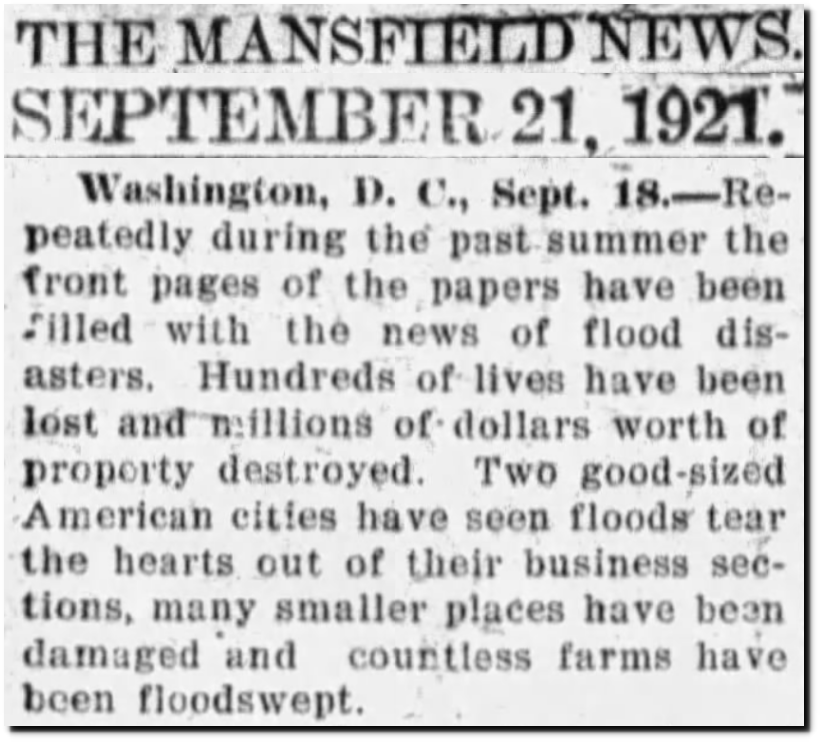
21 Sep 1921, 3 – News-Journal at Newspapers.com
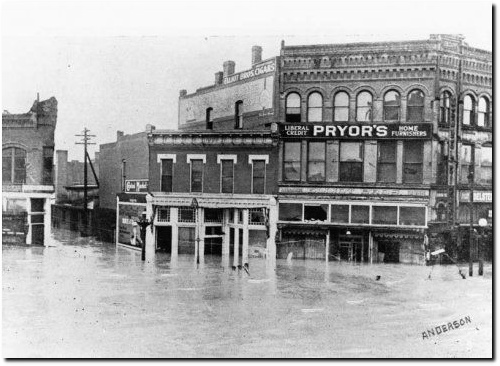
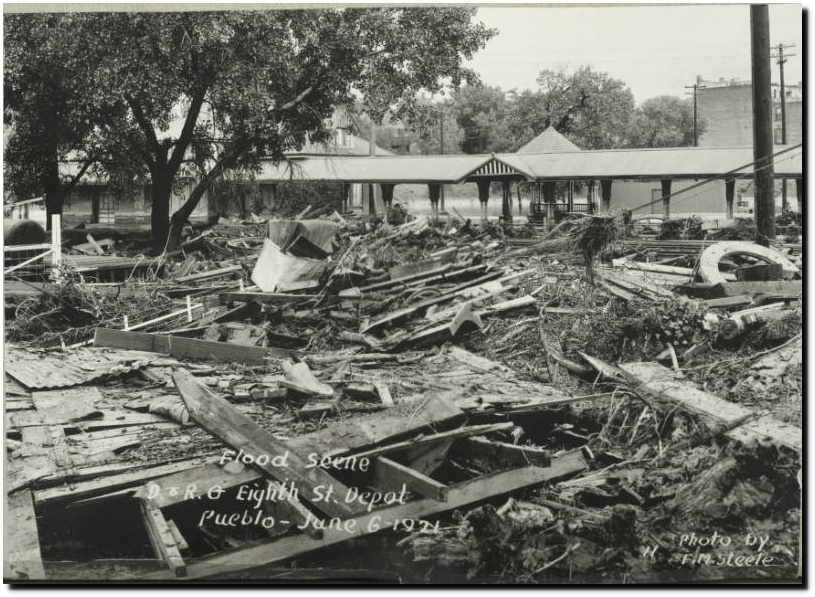
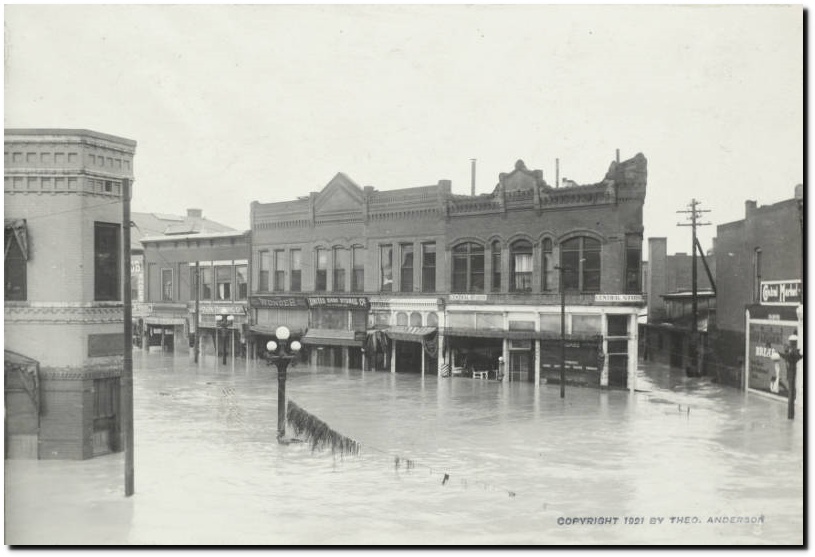
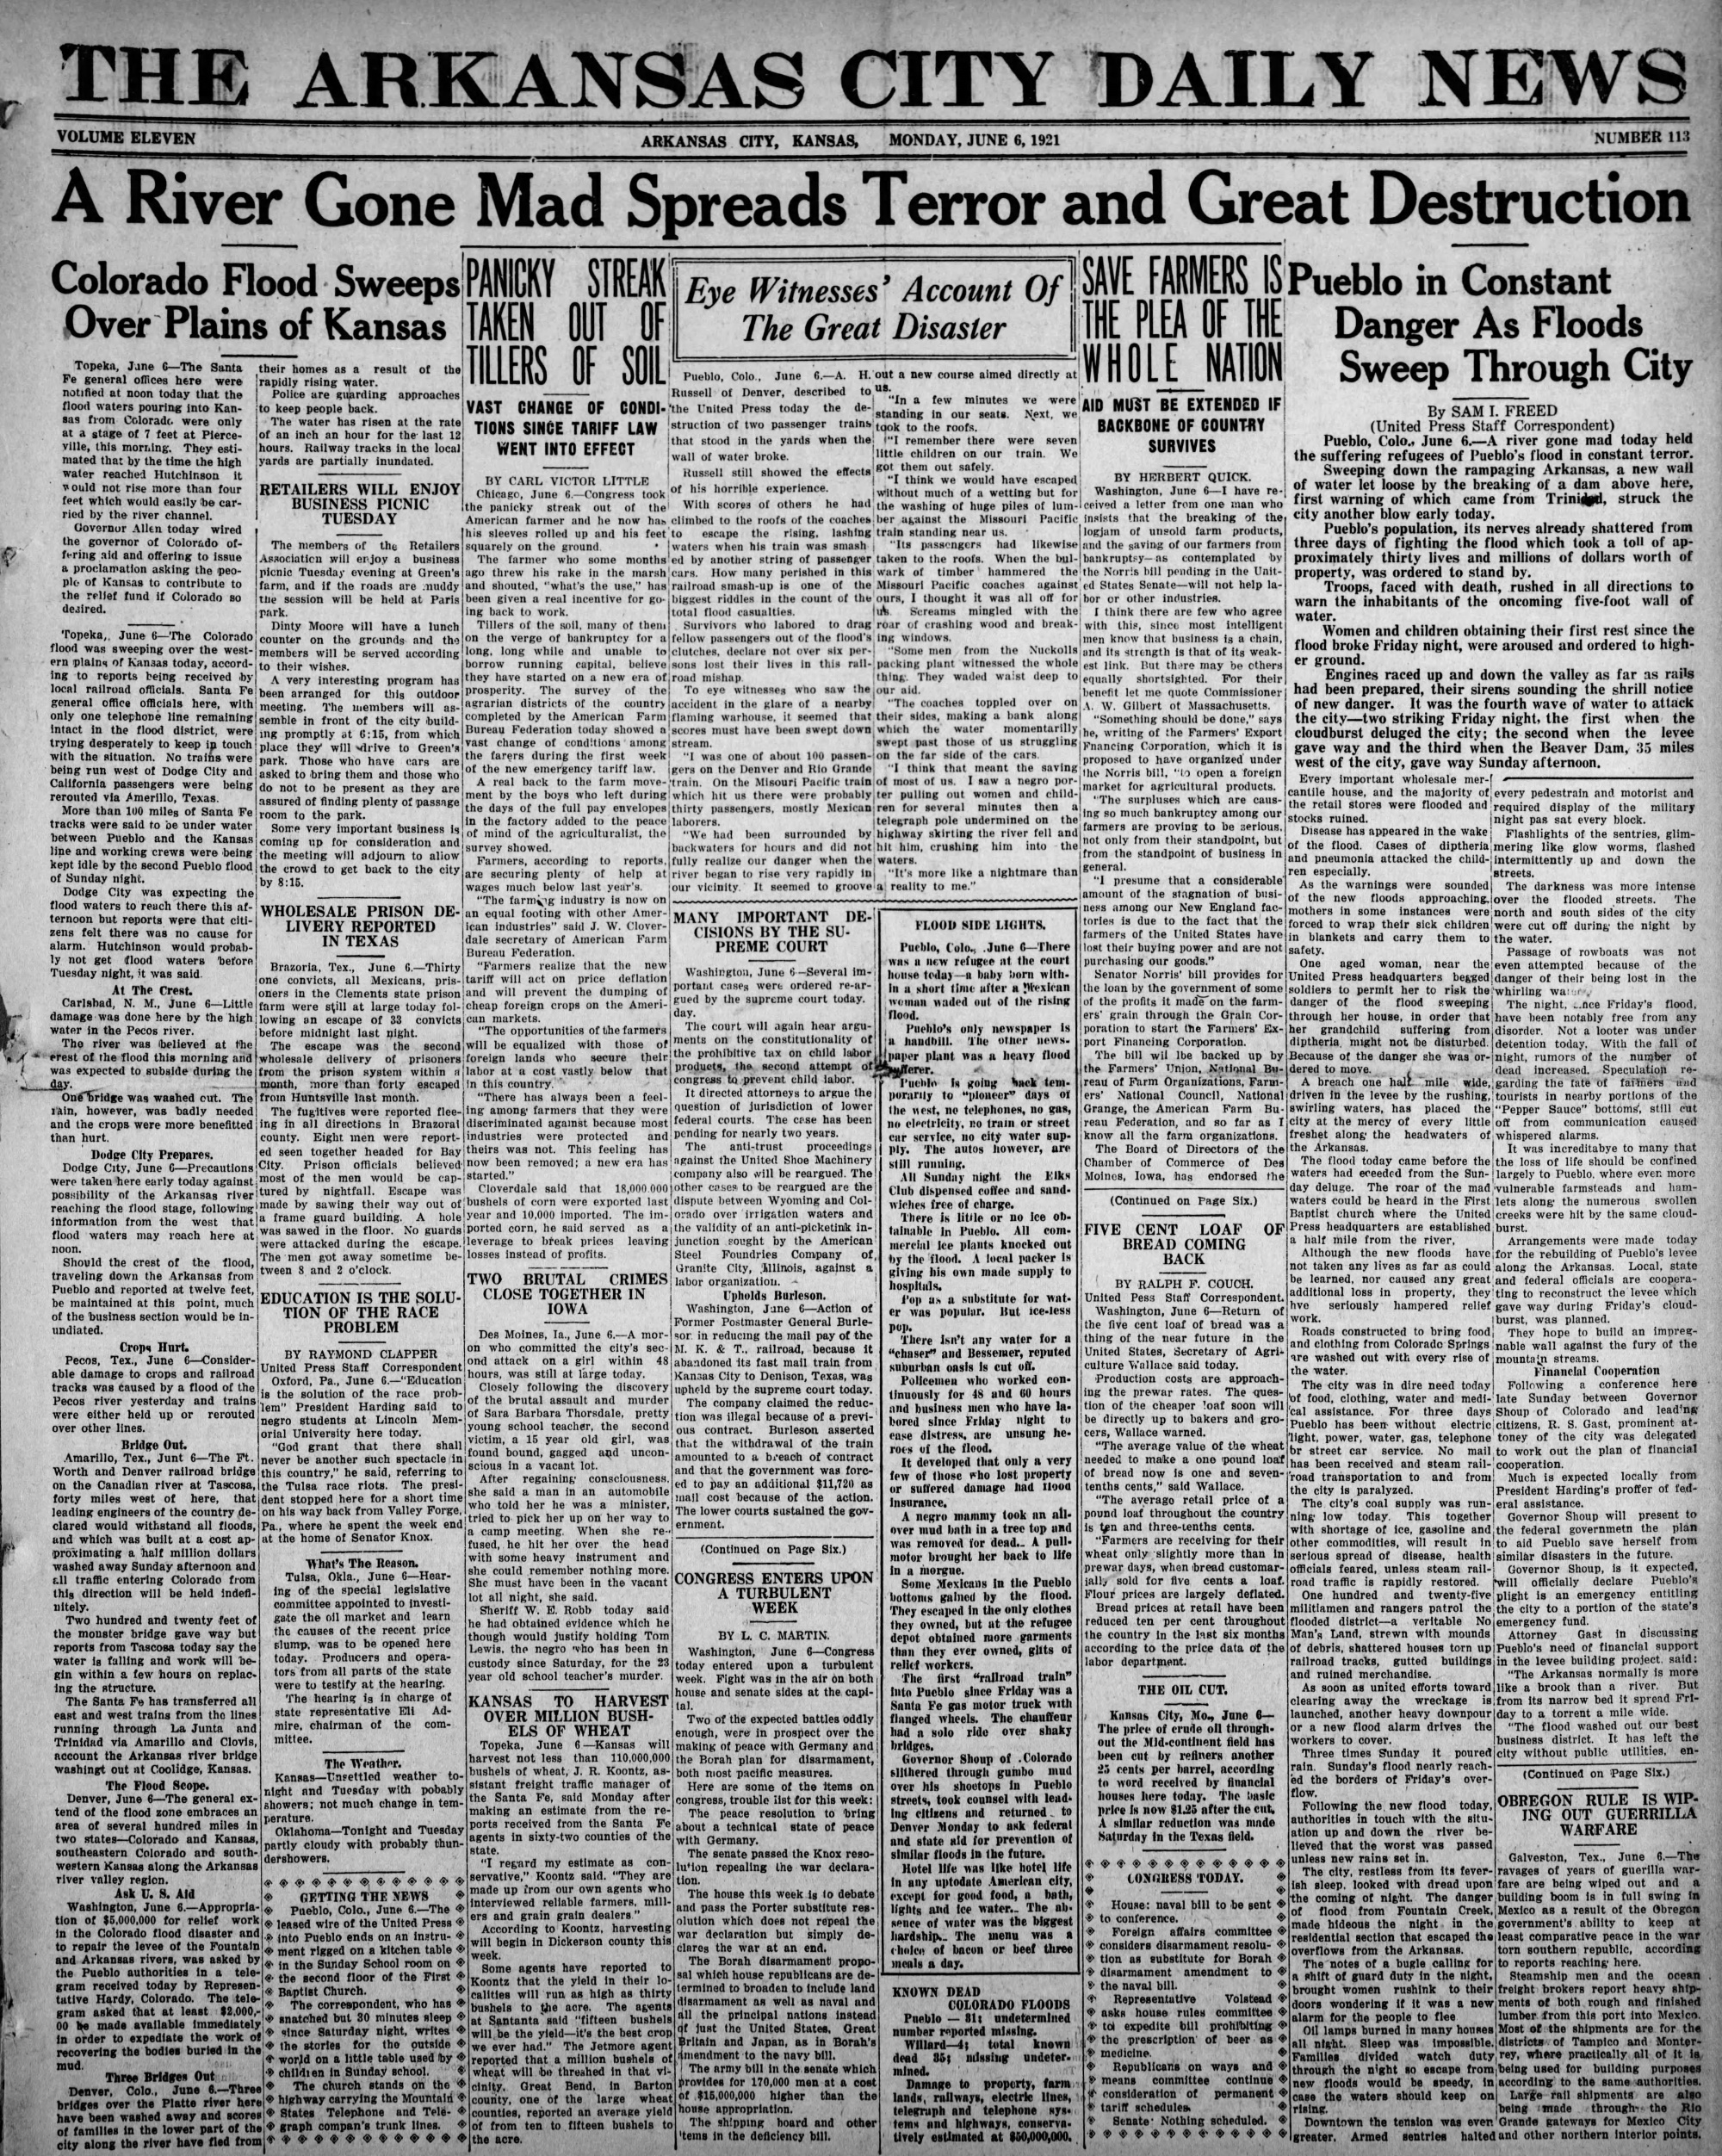
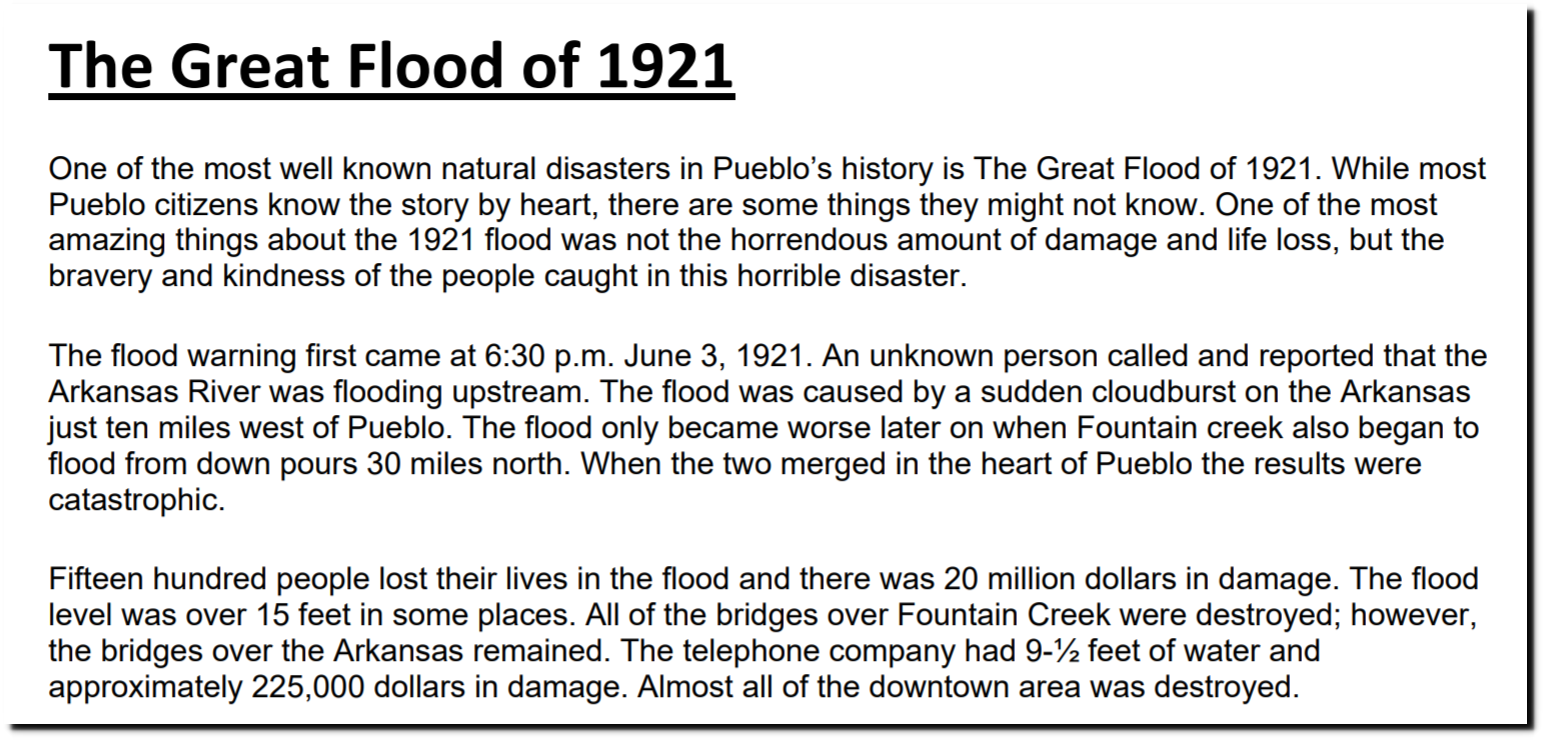
Pueblo, Colorado was largely wiped out by a flood during June, 1921. Much of Kansas suffered damage, and there was flooding on the Pecos River in New Mexico and Texas.
06 Jun 1921, 1 – The Arkansas City Daily News at Newspapers.com
It is estimated that 1,500 people in Pueblo, Colorado died during that flood.
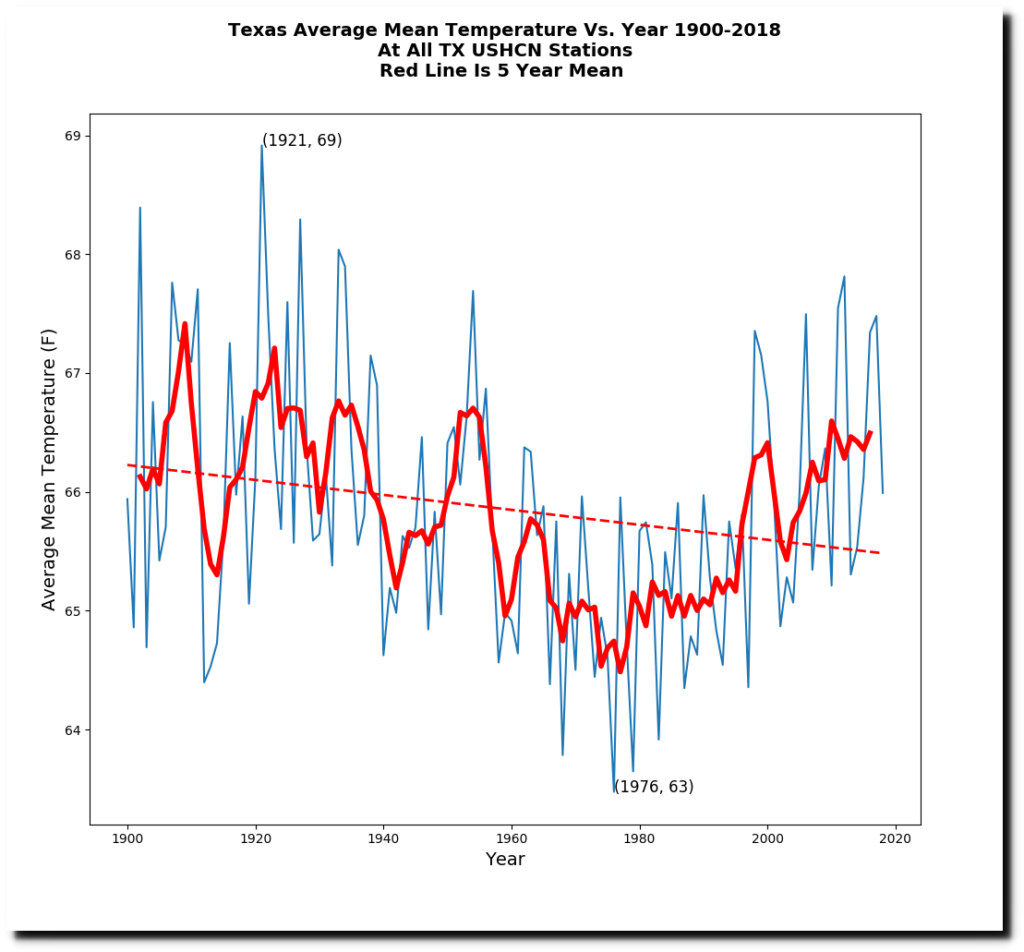
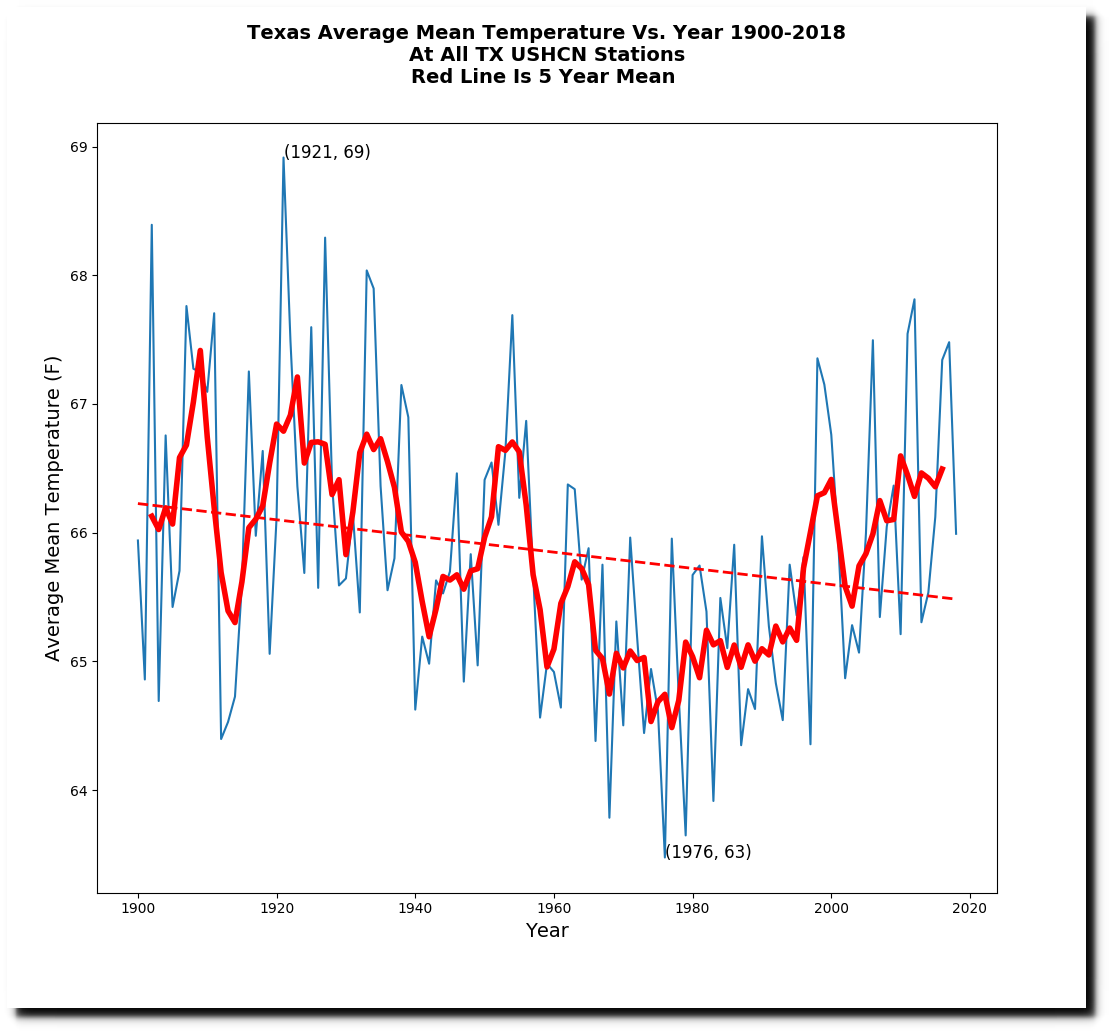
It was the hottest year on record in Texas.
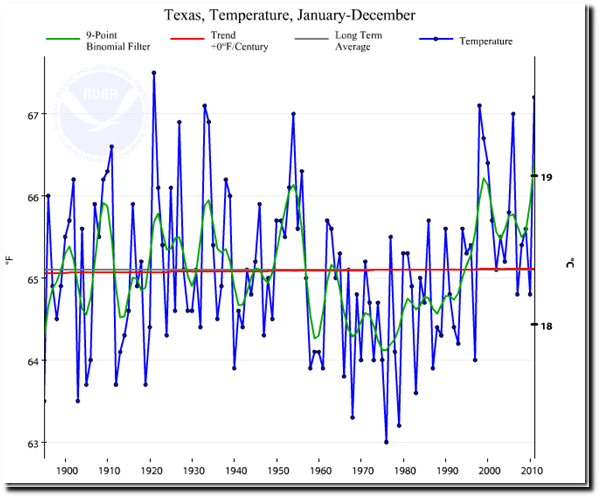
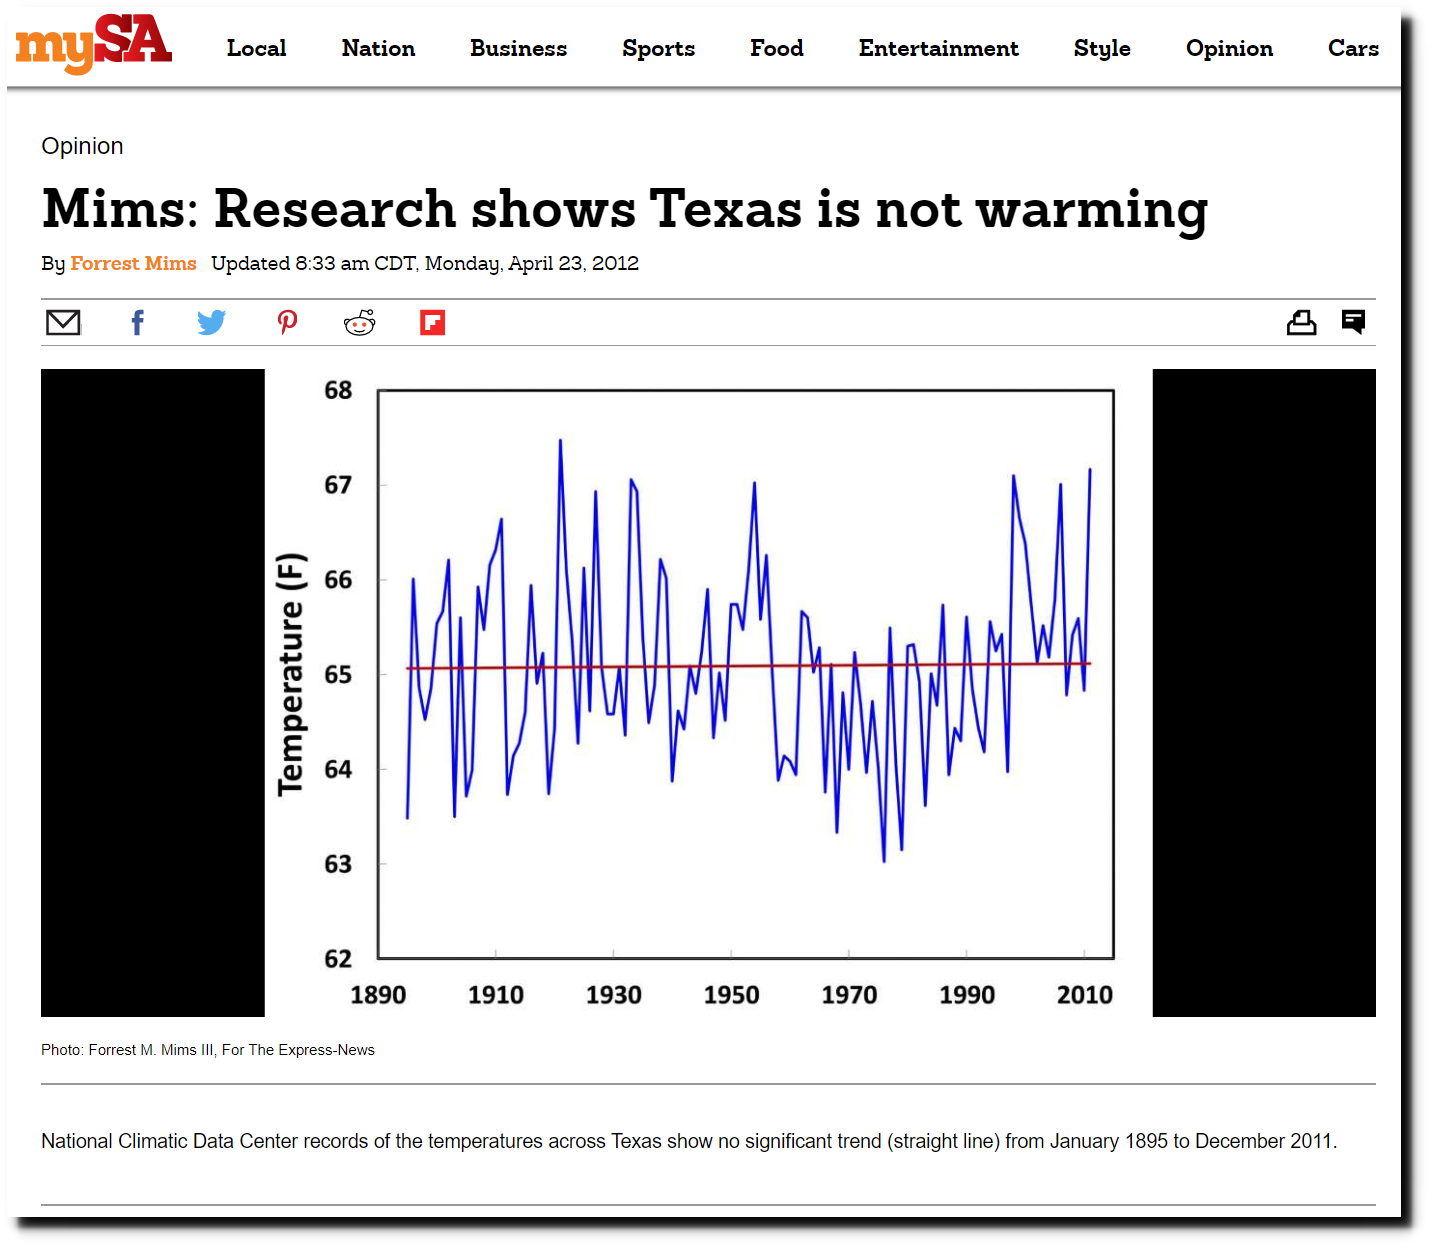
NOAA used to acknowledge this
Climate scientists who have been claiming Texas is warming are totally wrong. | Watts Up With That?
Mims: Research shows Texas is not warming – San Antonio Express-News
But reality didn’t suit the political agenda of NOAA, so they erased the past heat in Texas and turned sharp cooling into sharp warming.
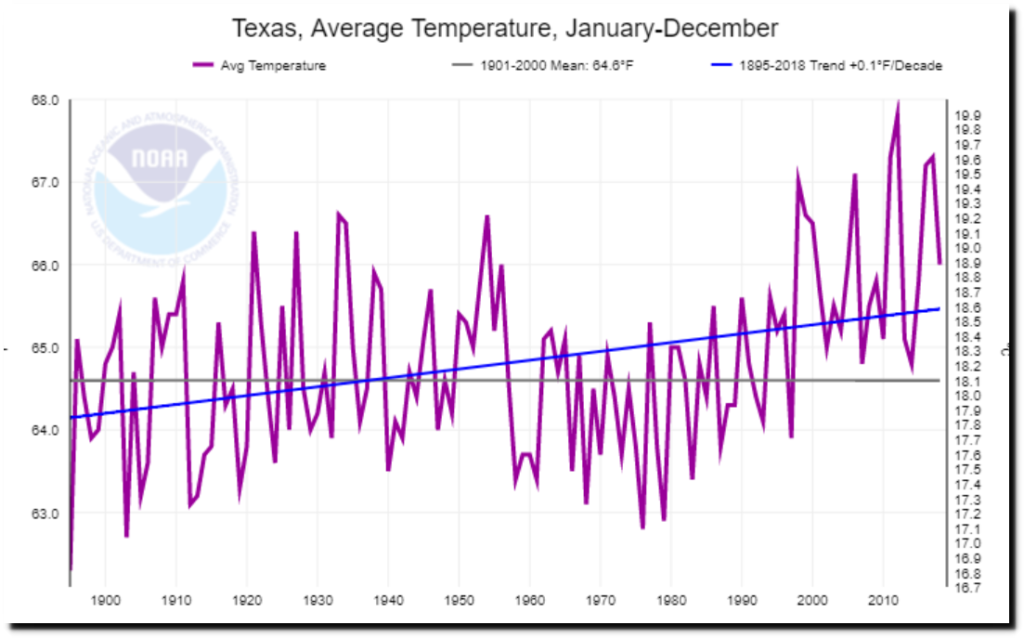
Climate at a Glance | National Centers for Environmental Information (NCEI)
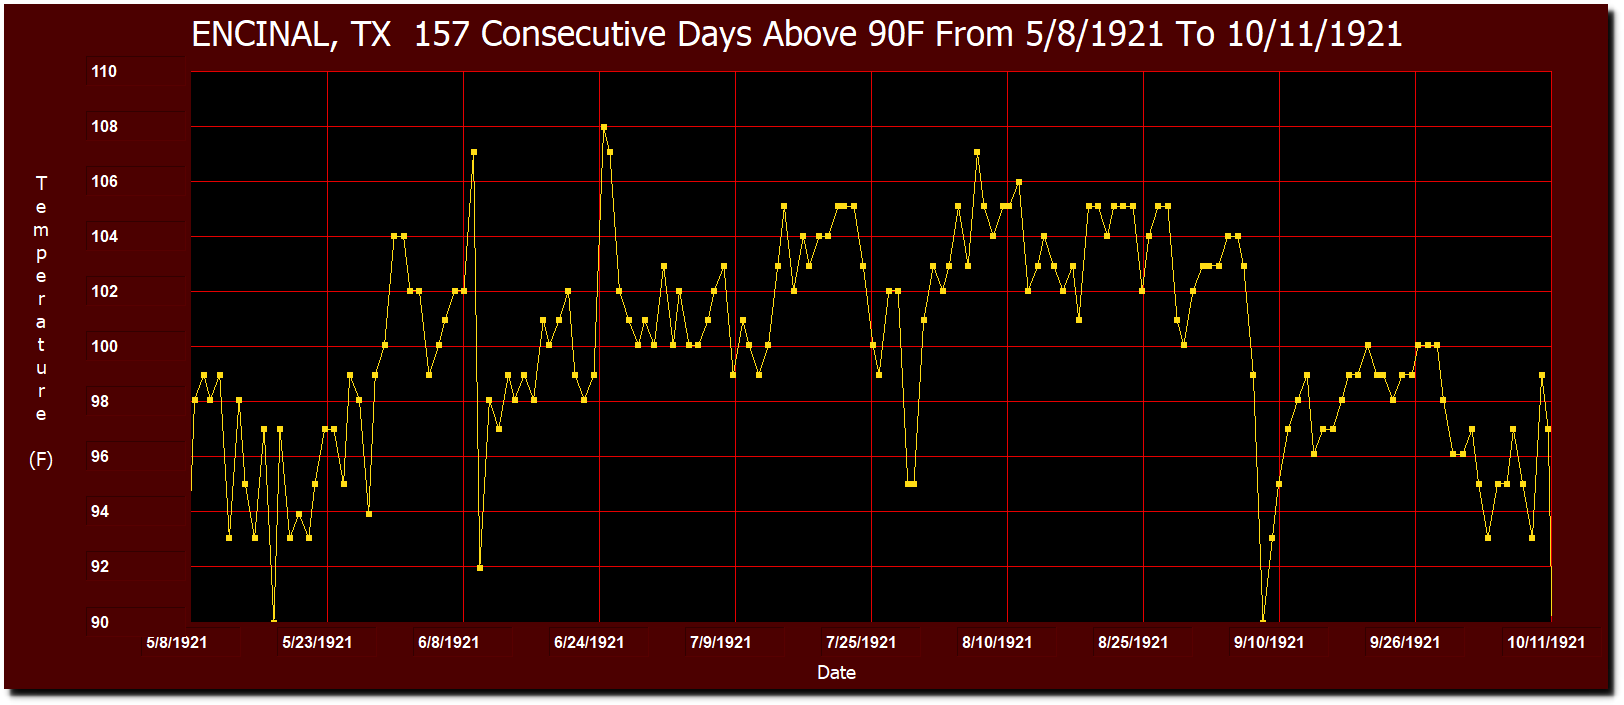
Texas had their longest heatwave at Encinal in 1921, 157 consecutive days above 90F from May 8 to October 11, 1921.
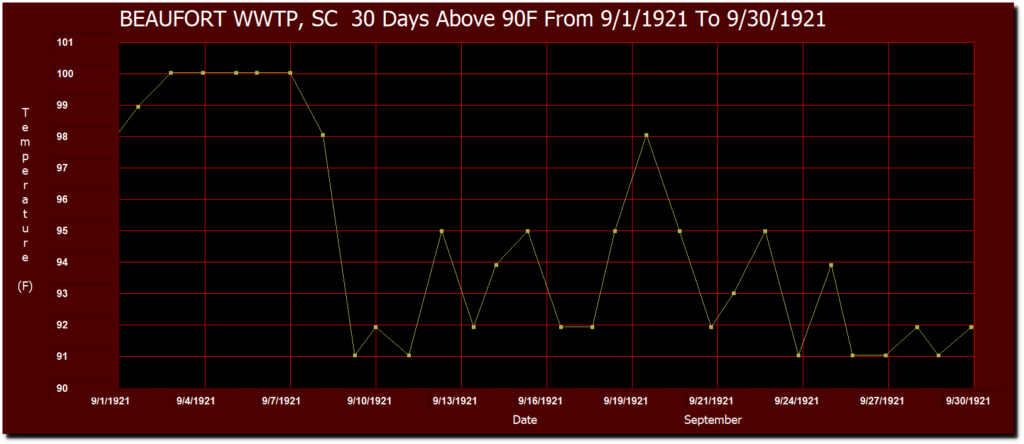
Beaufort, South Carolina was over 90 degrees every day during September, 1921 – the South Carolina record.
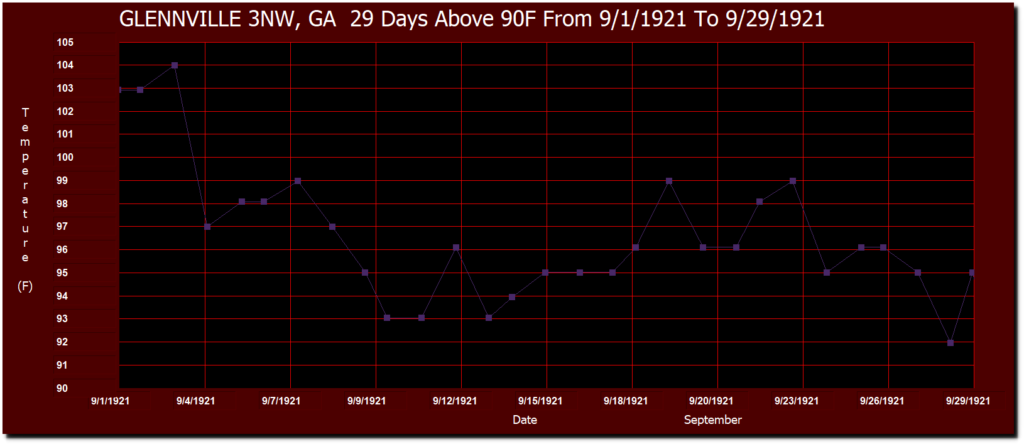
Glennville, Georgia had 29 days over 90 degrees during September, 1921 – the Georgia record for September.
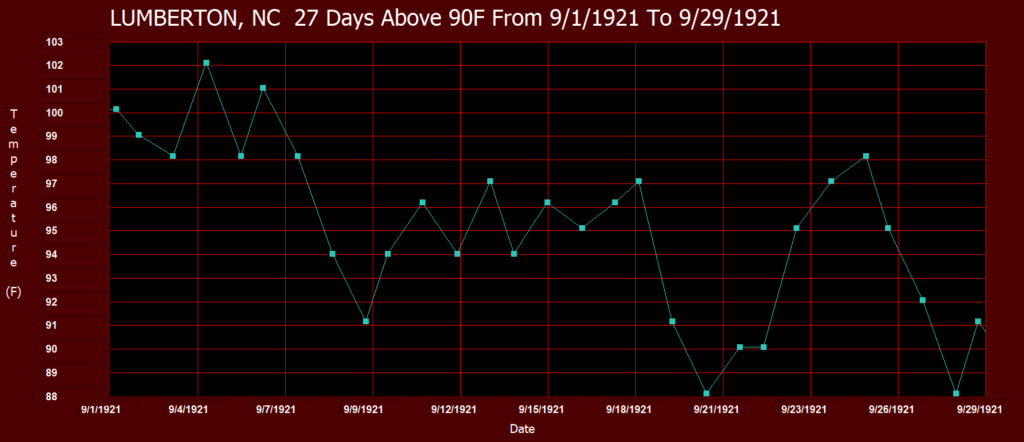
Lumberton, North Carolina’s had 27 days over 90 degrees during September 1921, the North Carolina record for September
I will report the results for Valentines Day in a few weeks, but I am expecting it to be coldest on record.
Posted in Uncategorized
Leave a comment


