
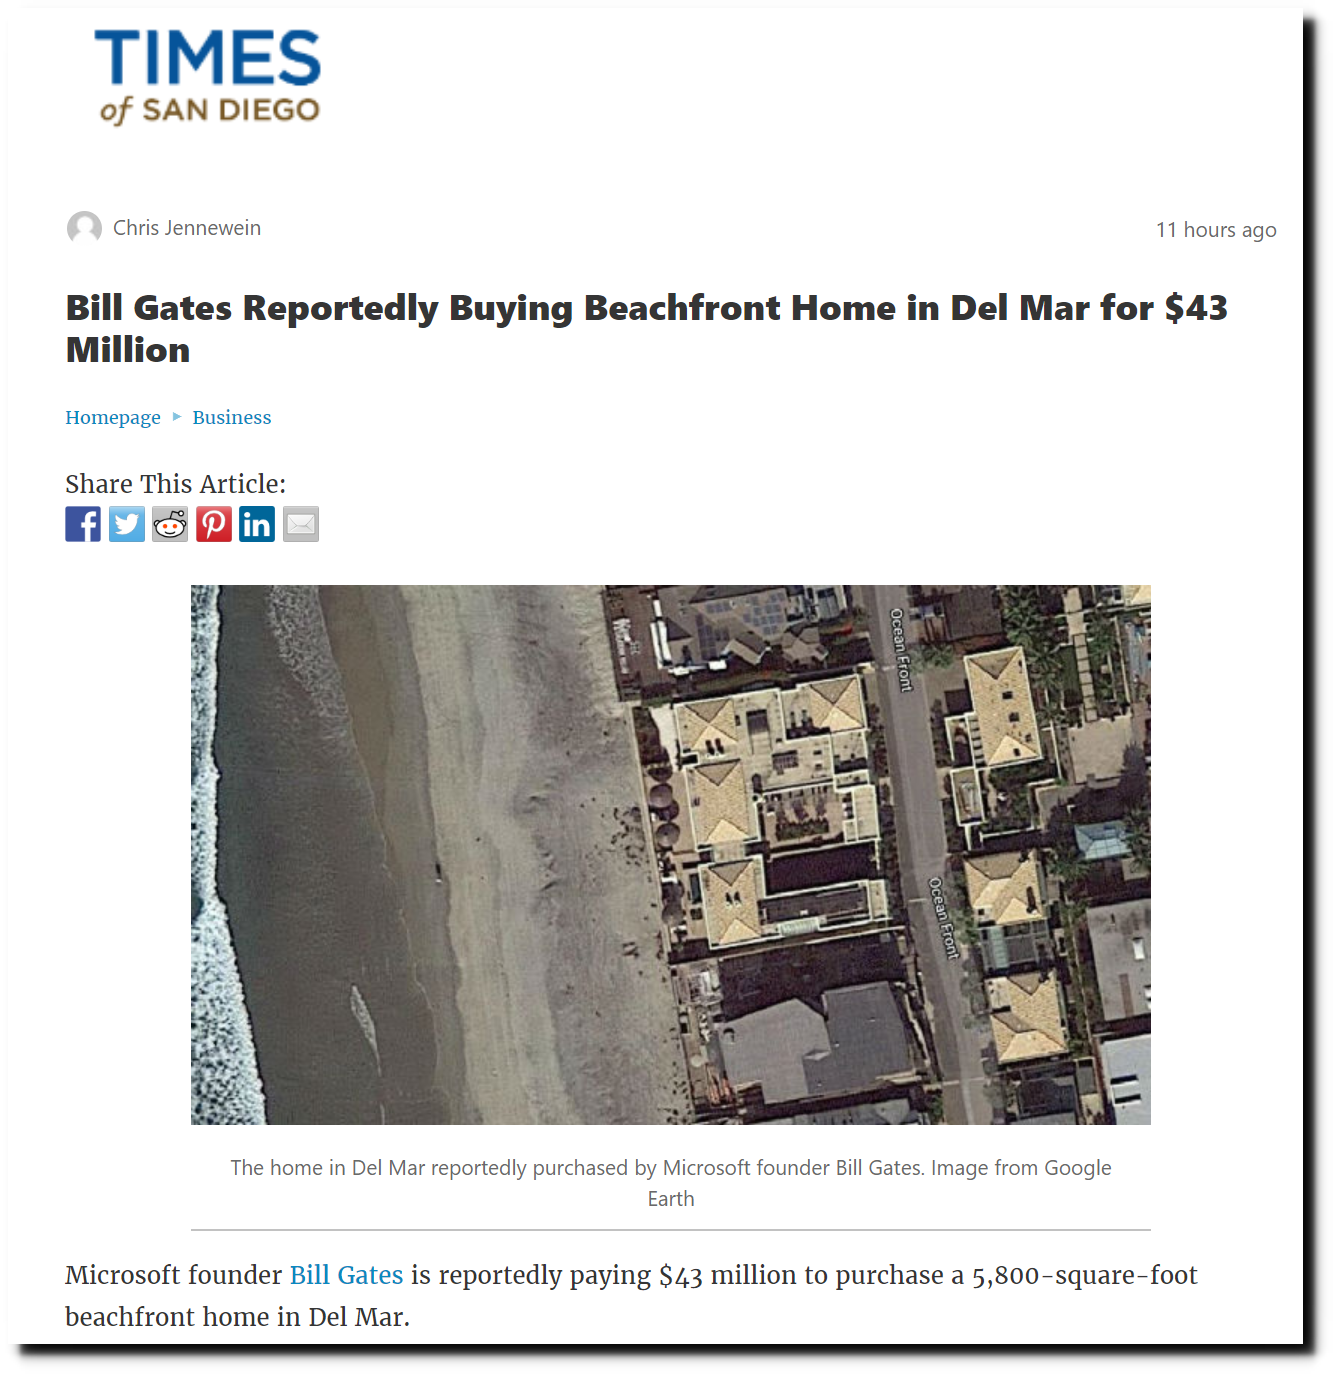
Bill Gates is buying a $43 million mansion at sea level in Del Mar, California.
Bill Gates Reportedly Buying Beachfront Home in Del Mar for $43 Million | Times of San Diego
He also wants to protect you from sea level rise, by polluting the atmosphere with chemicals.

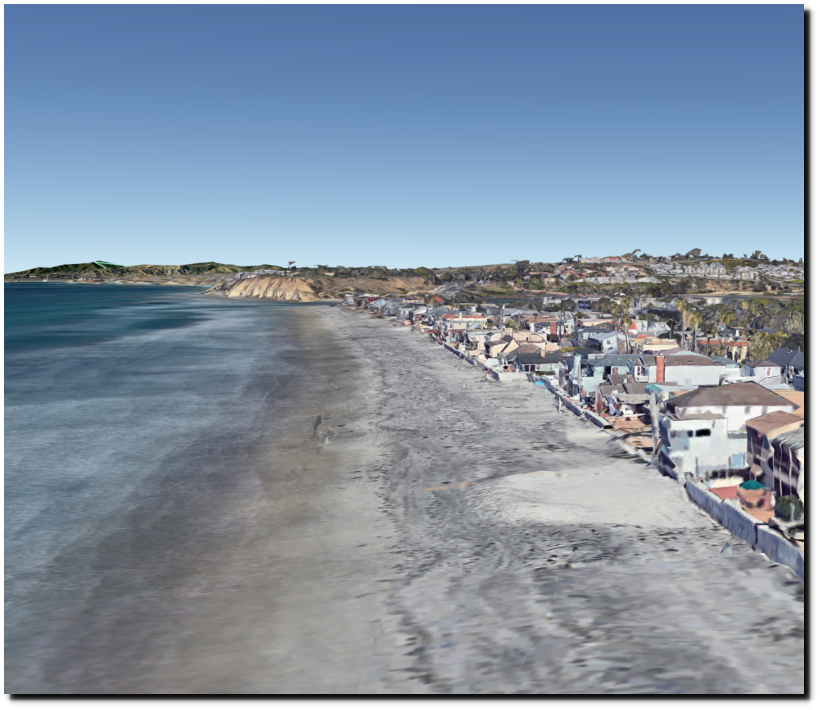
I have vacationed in Del Mar, and am familiar with the topography. The houses on the beach are not far above the high tide mark. Here is how it looks on Google Earth.


