
Disrupting the Borg is expensive and time consuming!

Google Search
-
Recent Posts
- Analyzing The Western Water Crisis
- Gaslighting 1924
- “Why Do You Resist?”
- Climate Attribution Model
- Fact Checking NASA
- Fact Checking Grok
- Fact Checking The New York Times
- New Visitech Features
- Ice-Free Arctic By 2014
- Debt-Free US Treasury Forecast
- Analyzing Big City Crime (Part 2)
- Analyzing Big City Crime
- UK Migration Caused By Global Warming
- Climate Attribution In Greece
- “Brown: ’50 days to save world'”
- The Catastrophic Influence of Bovine Methane Emissions on Extraterrestrial Climate Patterns
- Posting On X
- Seventeen Years Of Fun
- The Importance Of Good Tools
- Temperature Shifts At Blue Hill, MA
- CO2²
- Time Of Observation Bias
- Climate Scamming For Profit
- Climate Scamming For Profit
- Back To The Future
March 2026 M T W T F S S 1 2 3 4 5 6 7 8 9 10 11 12 13 14 15 16 17 18 19 20 21 22 23 24 25 26 27 28 29 30 31 Recent Comments
- Bob G on Analyzing The Western Water Crisis
- arn on Analyzing The Western Water Crisis
- Bob G on Analyzing The Western Water Crisis
- Bob G on Analyzing The Western Water Crisis
- Bob G on Analyzing The Western Water Crisis
- Hank Phillips on Analyzing The Western Water Crisis
- Hank Phillips on Analyzing The Western Water Crisis
- Hank Phillips on Analyzing The Western Water Crisis
- Hank Phillips on Analyzing The Western Water Crisis
- Bob G on Analyzing The Western Water Crisis
Tough Times For Climate Alarmists
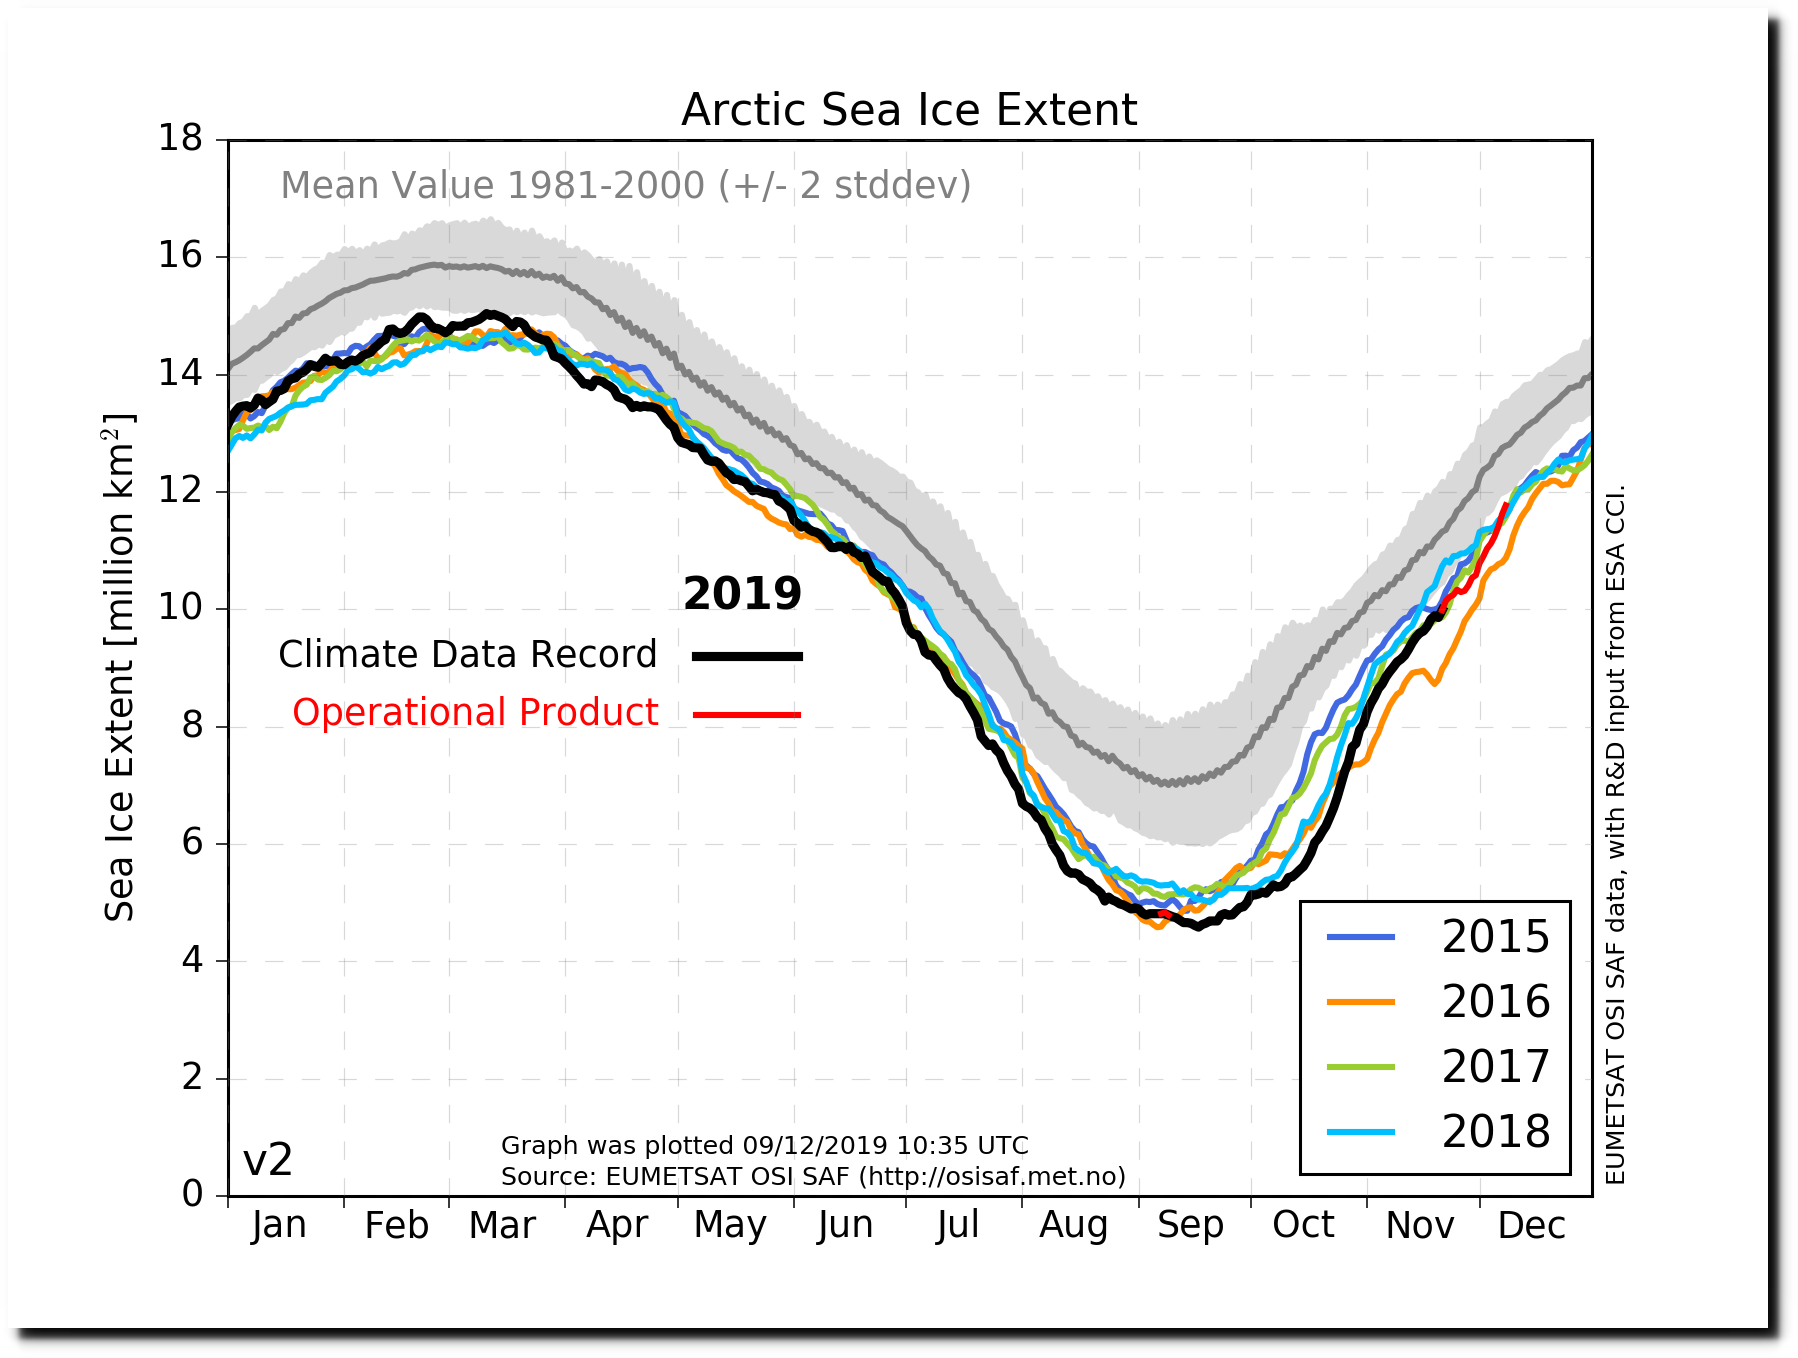
Arctic sea ice growth so far this month has been the fastest on record, and ice extent is nearly “normal.” It is going to be difficult blaming this year’s winter weather on missing Arctic ice.
Ocean and Ice Services | Danmarks Meteorologiske Institut
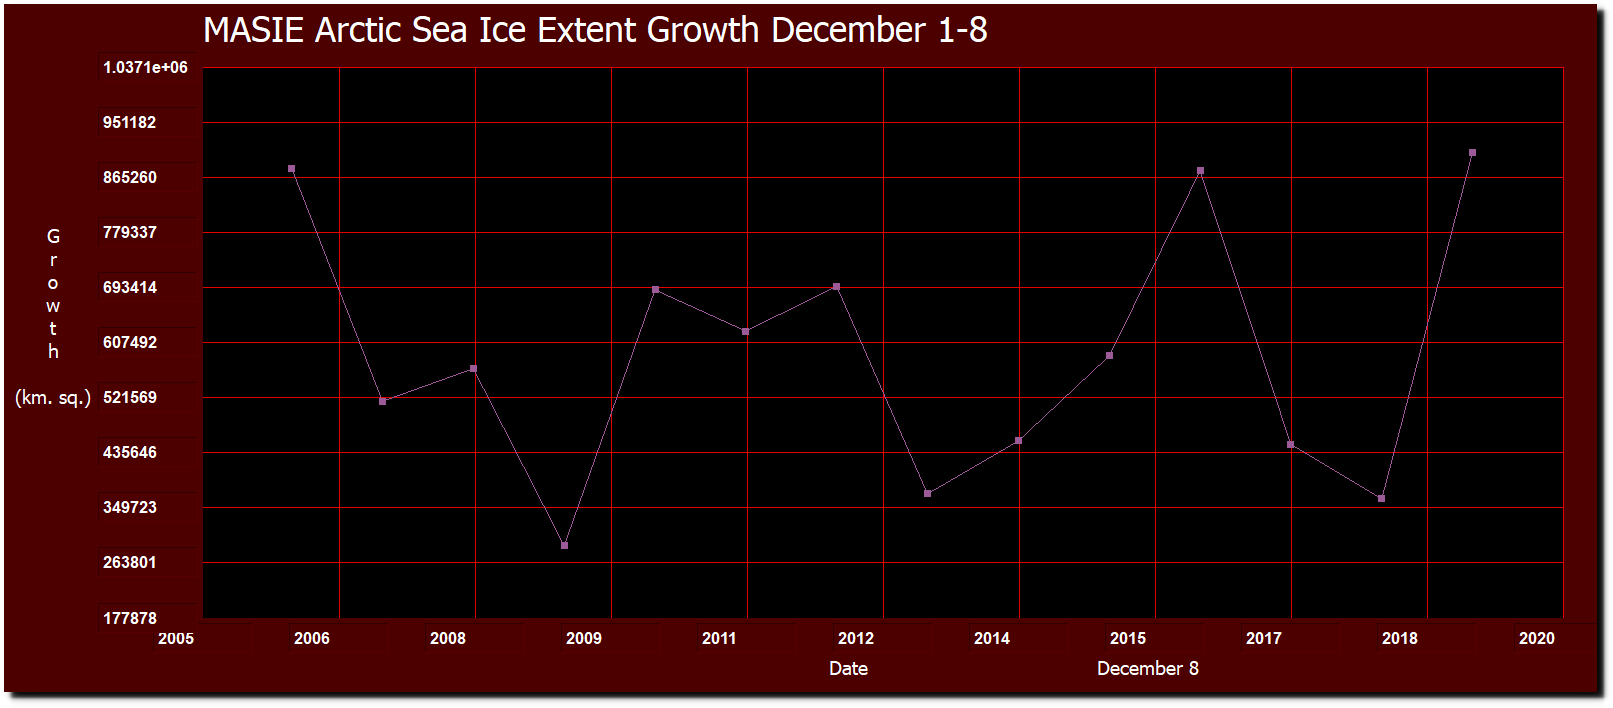
masie_4km_allyears_extent_sqkm.csv
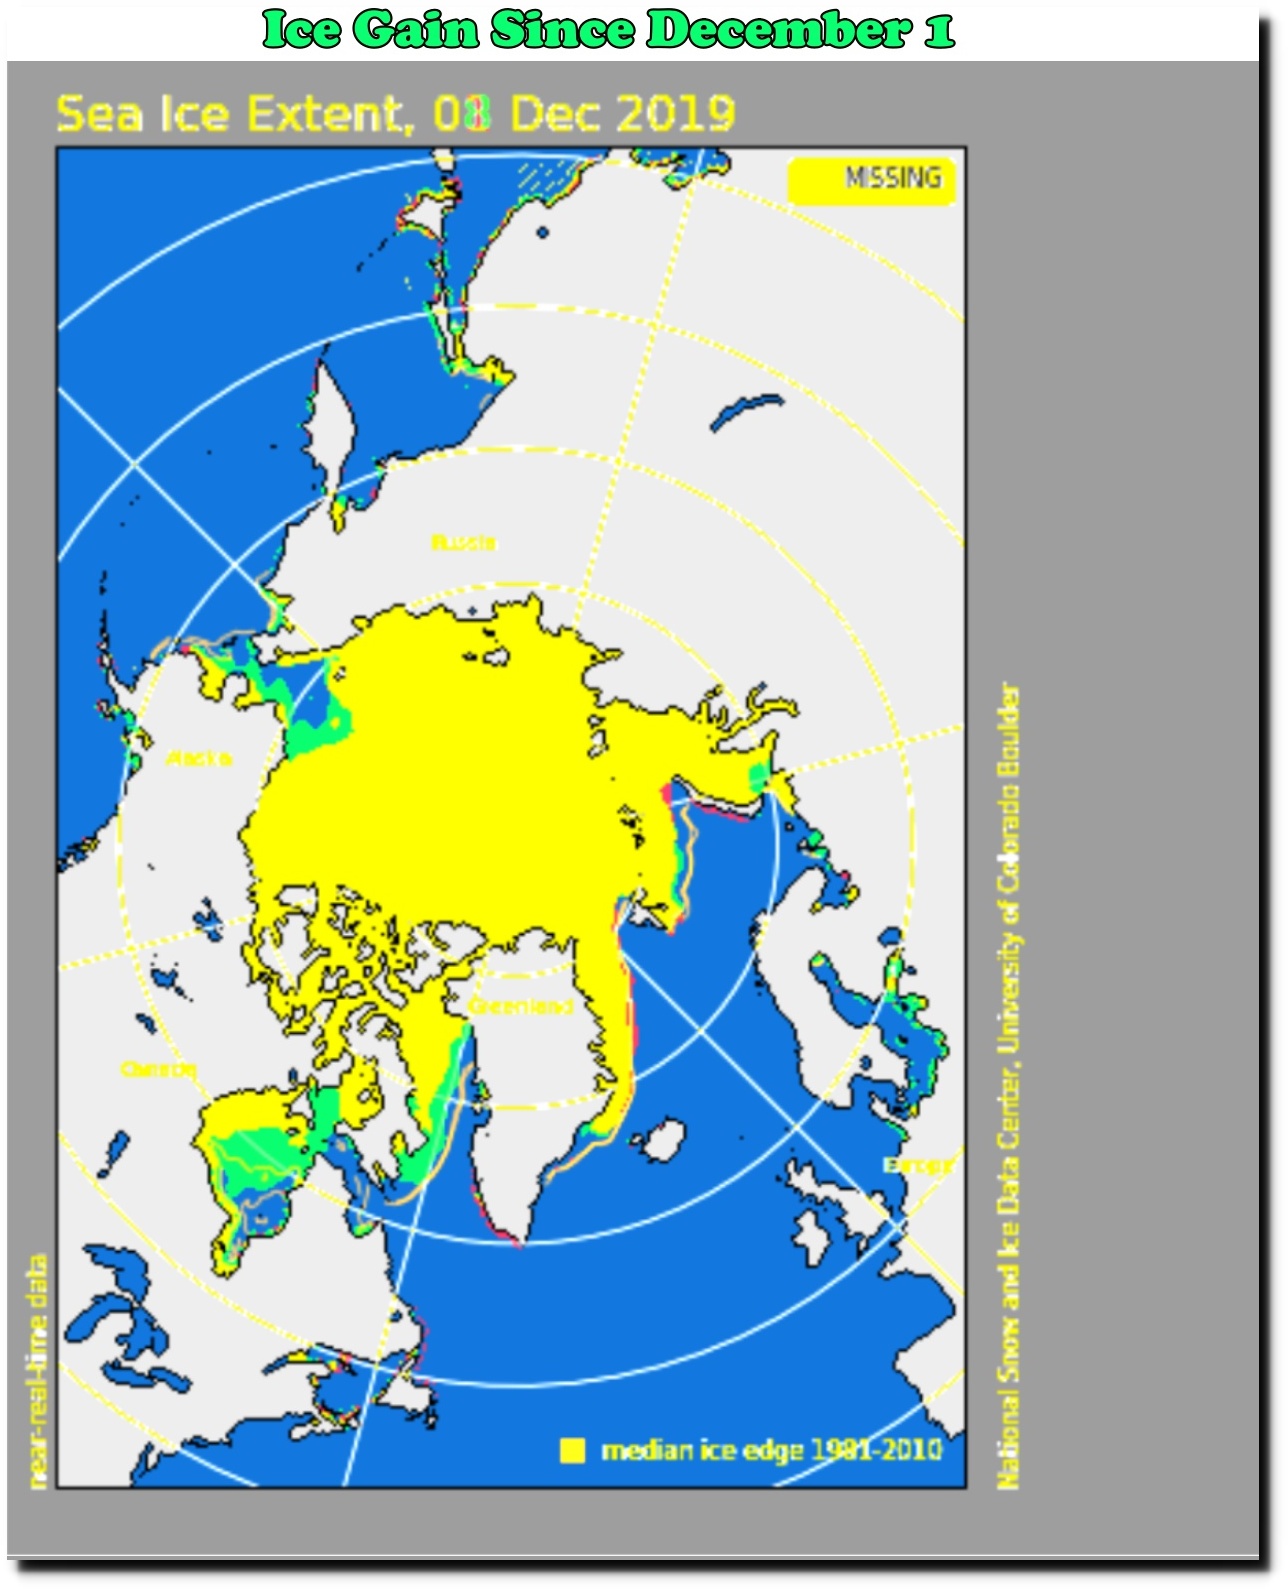
Index of /DATASETS/NOAA/G02135/north/daily/images/2019/12_Dec/
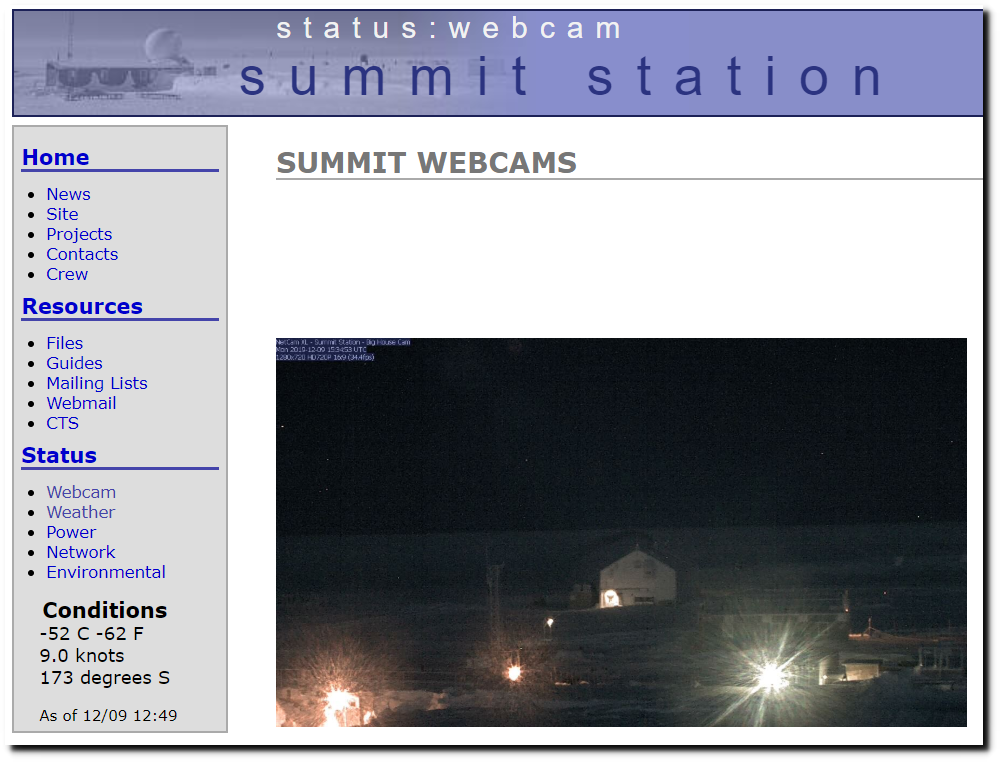
The center of the Greenland ice sheet is -62 degrees this afternoon.
Posted in Uncategorized
Leave a comment
Everything Looks Like A Nail
“To a man with a hammer, everything looks like a nail.”
– Mark Twain
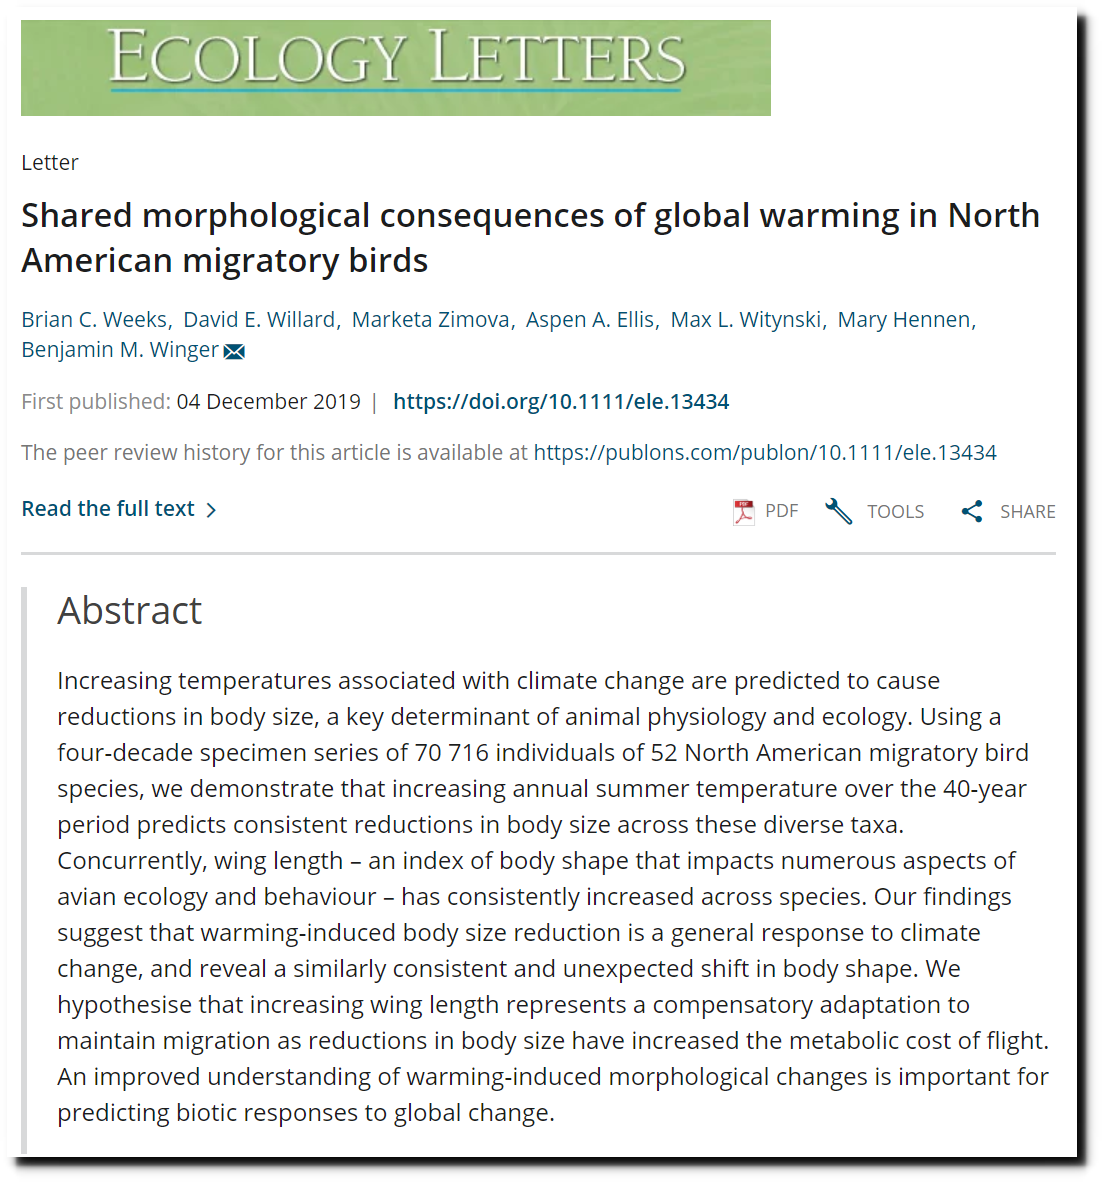
Experts say that birds are shrinking and disappearing in North America, and that it is due to climate change – which is what they expected to find.
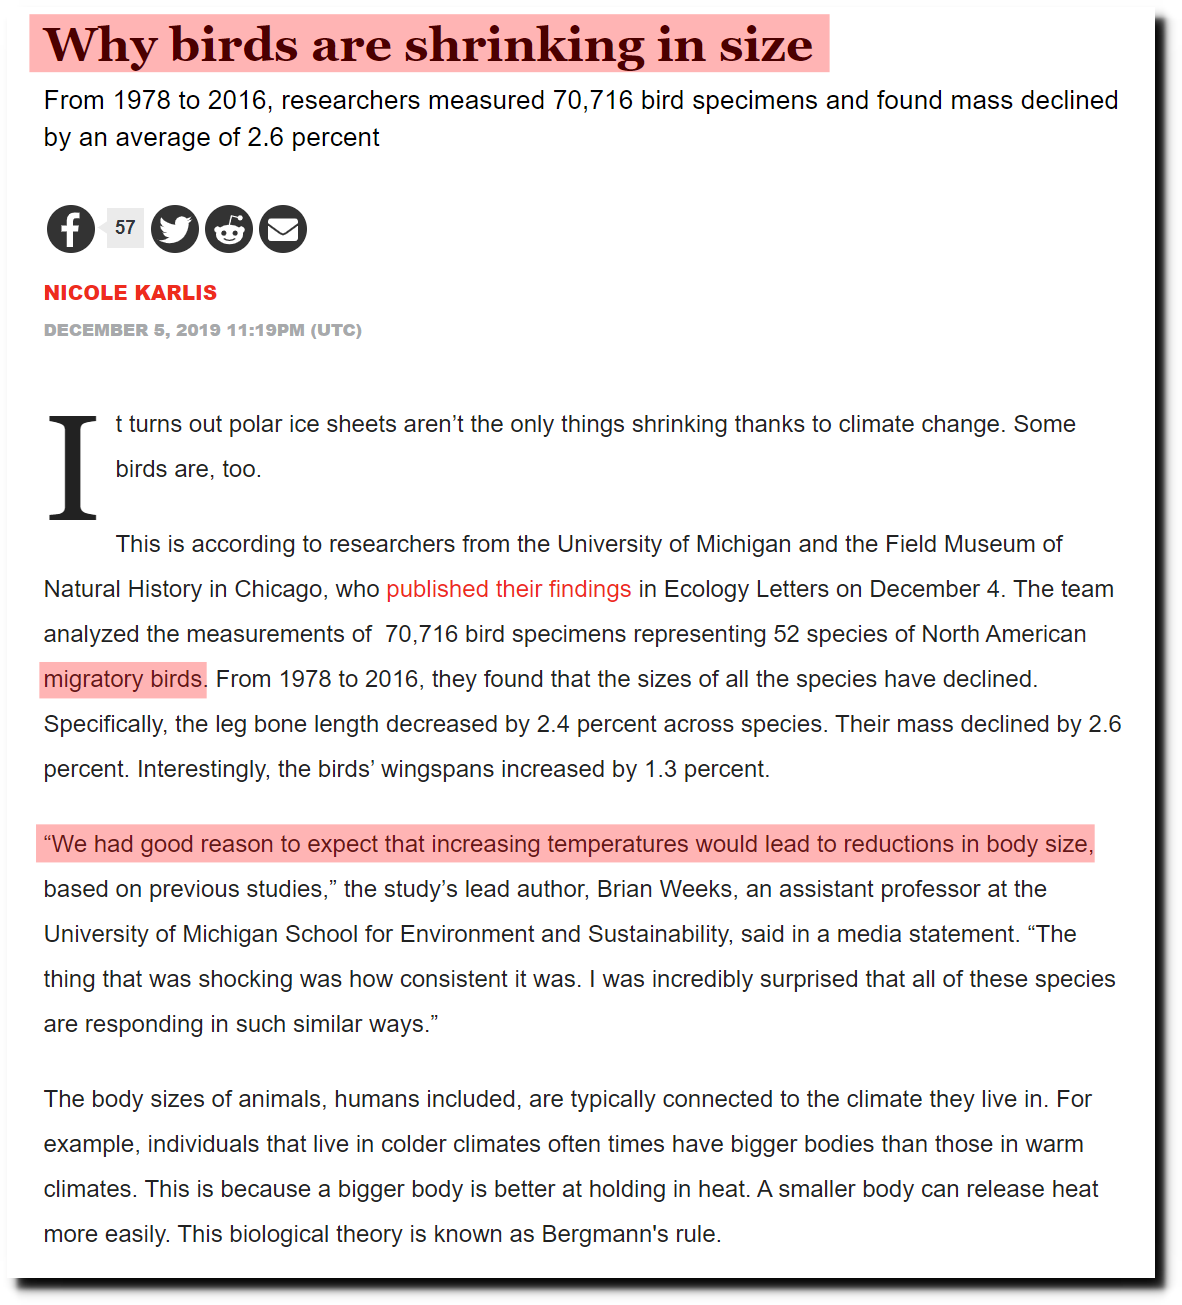
Why birds are shrinking in size | Salon.com
The article specifically blamed summer temperatures.
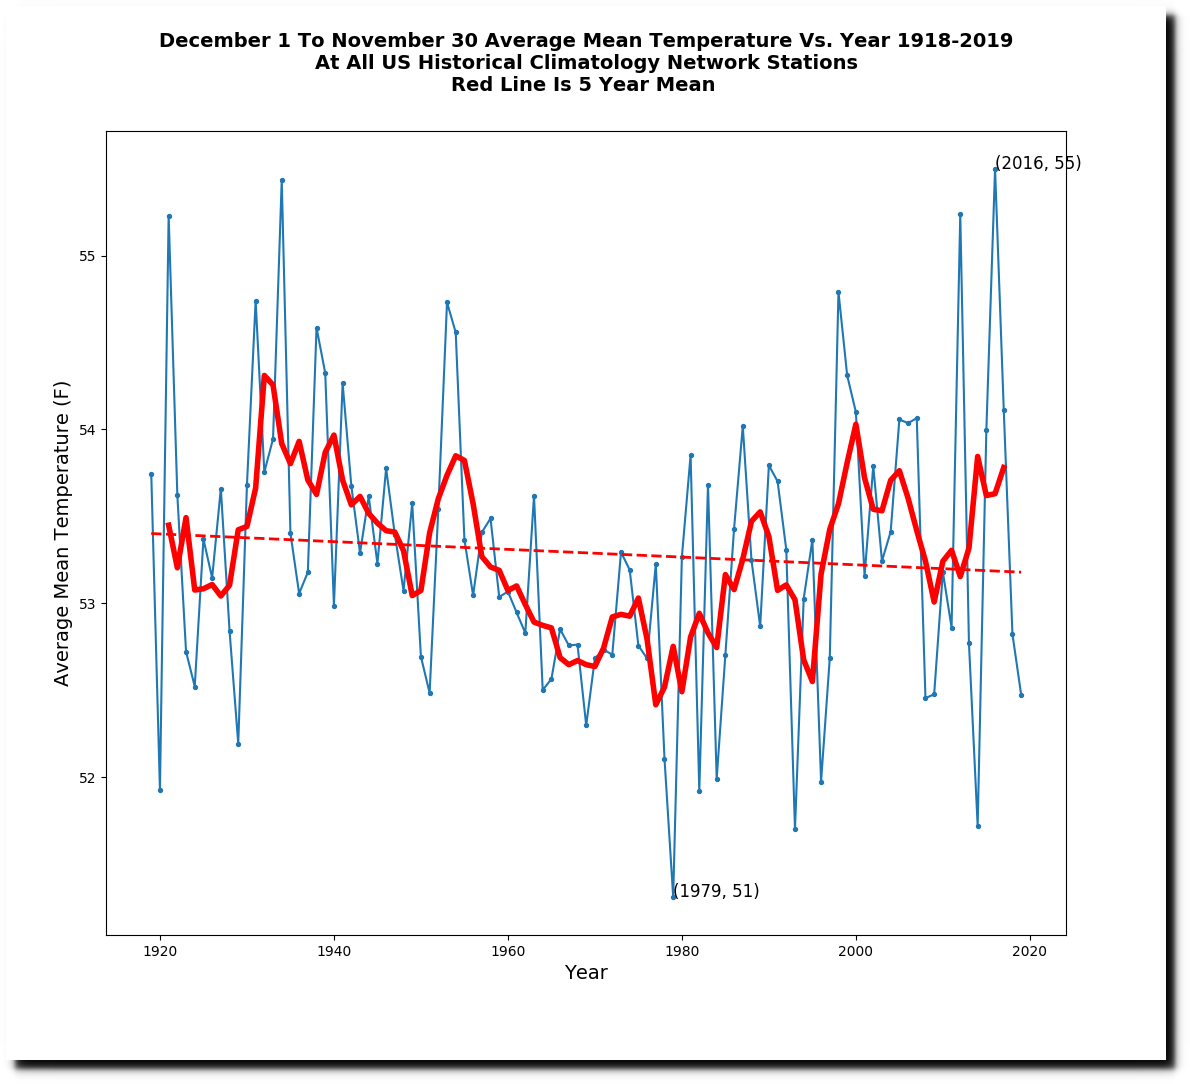
The National Climate Assessment shows that summer temperatures have gotten much cooler in the US over the past century.

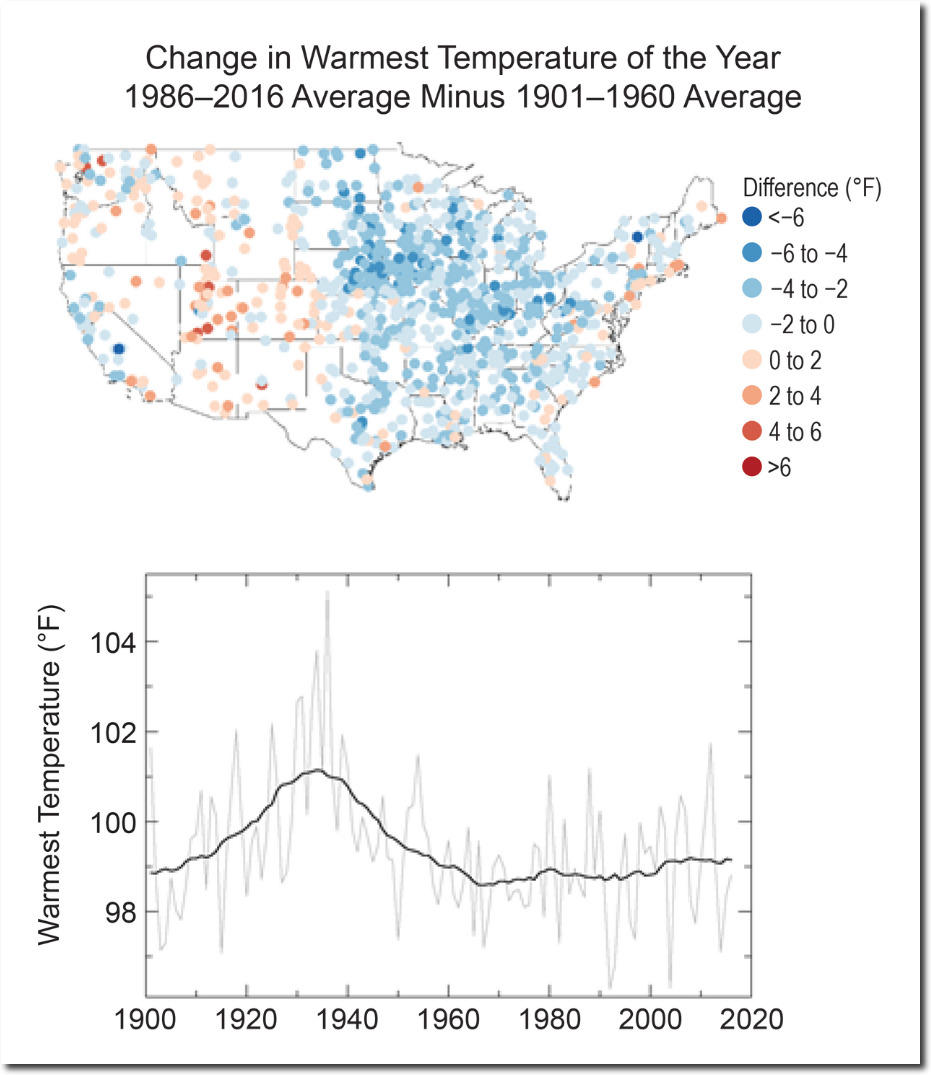
Temperature Changes in the United States – Climate Science Special Report
The US has been cooling for a century.
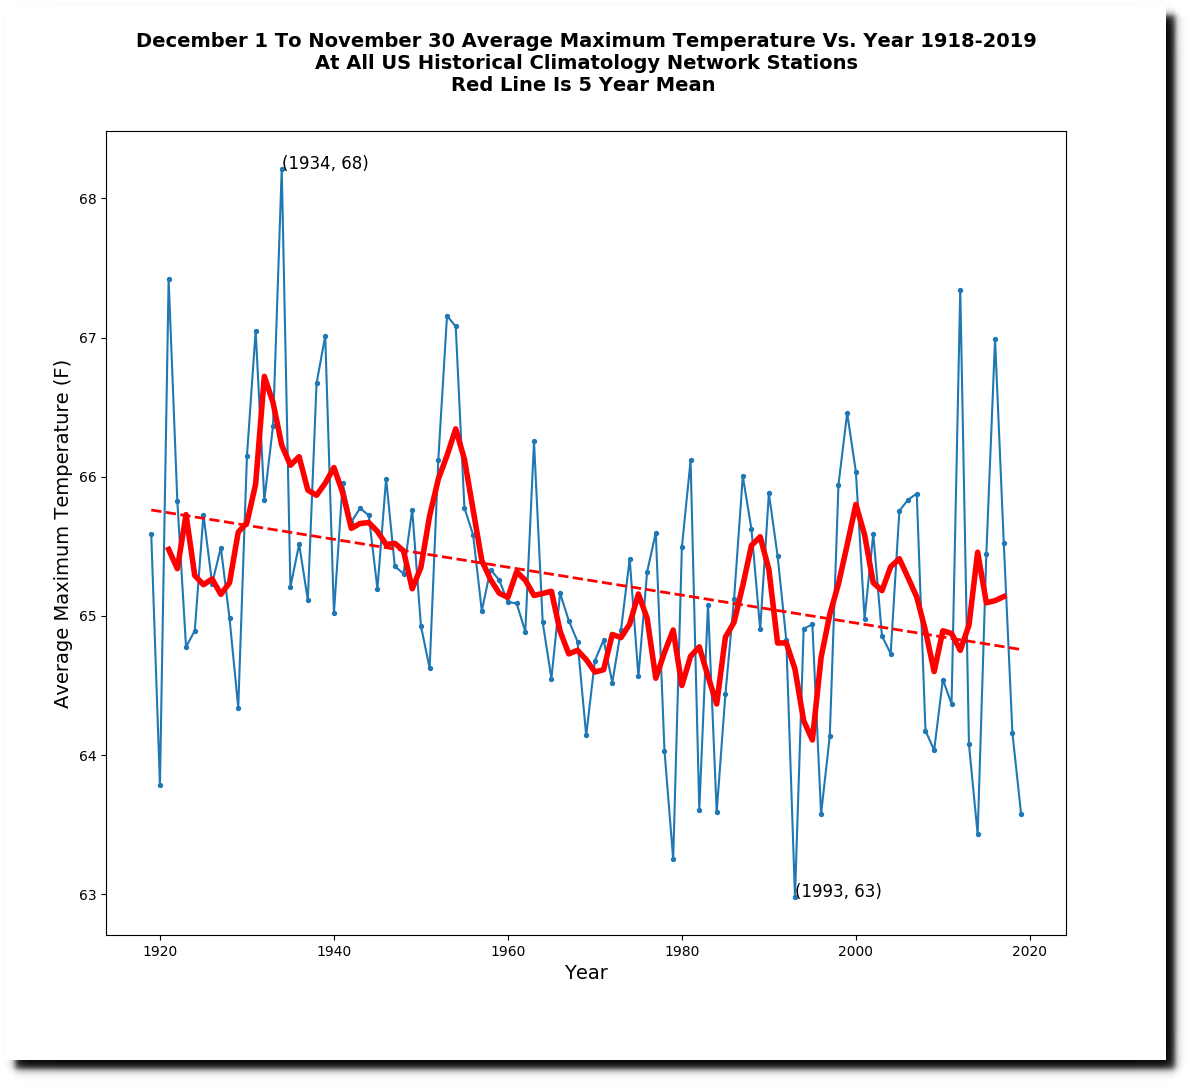
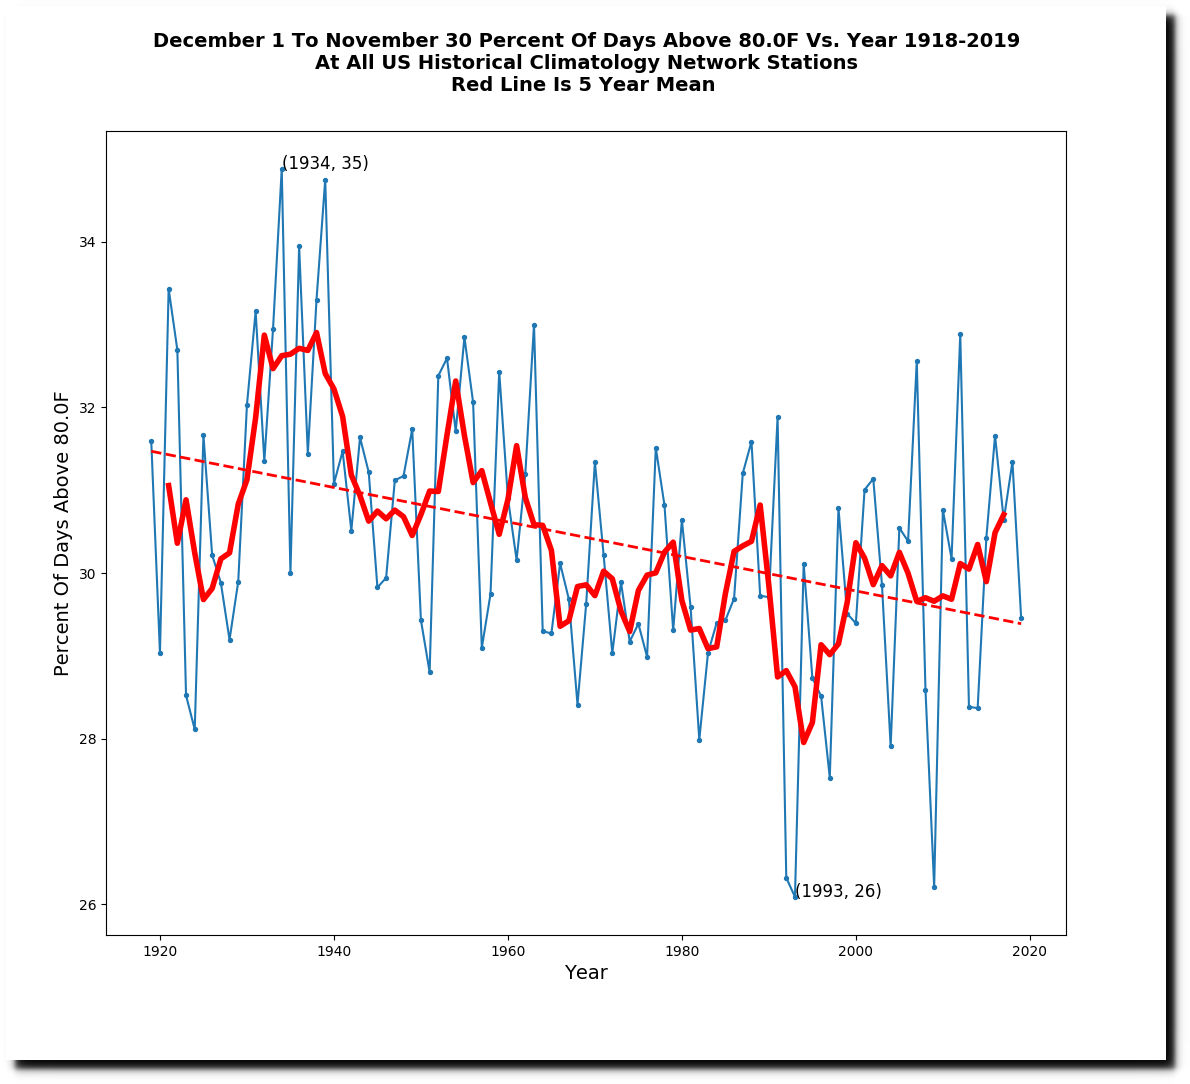
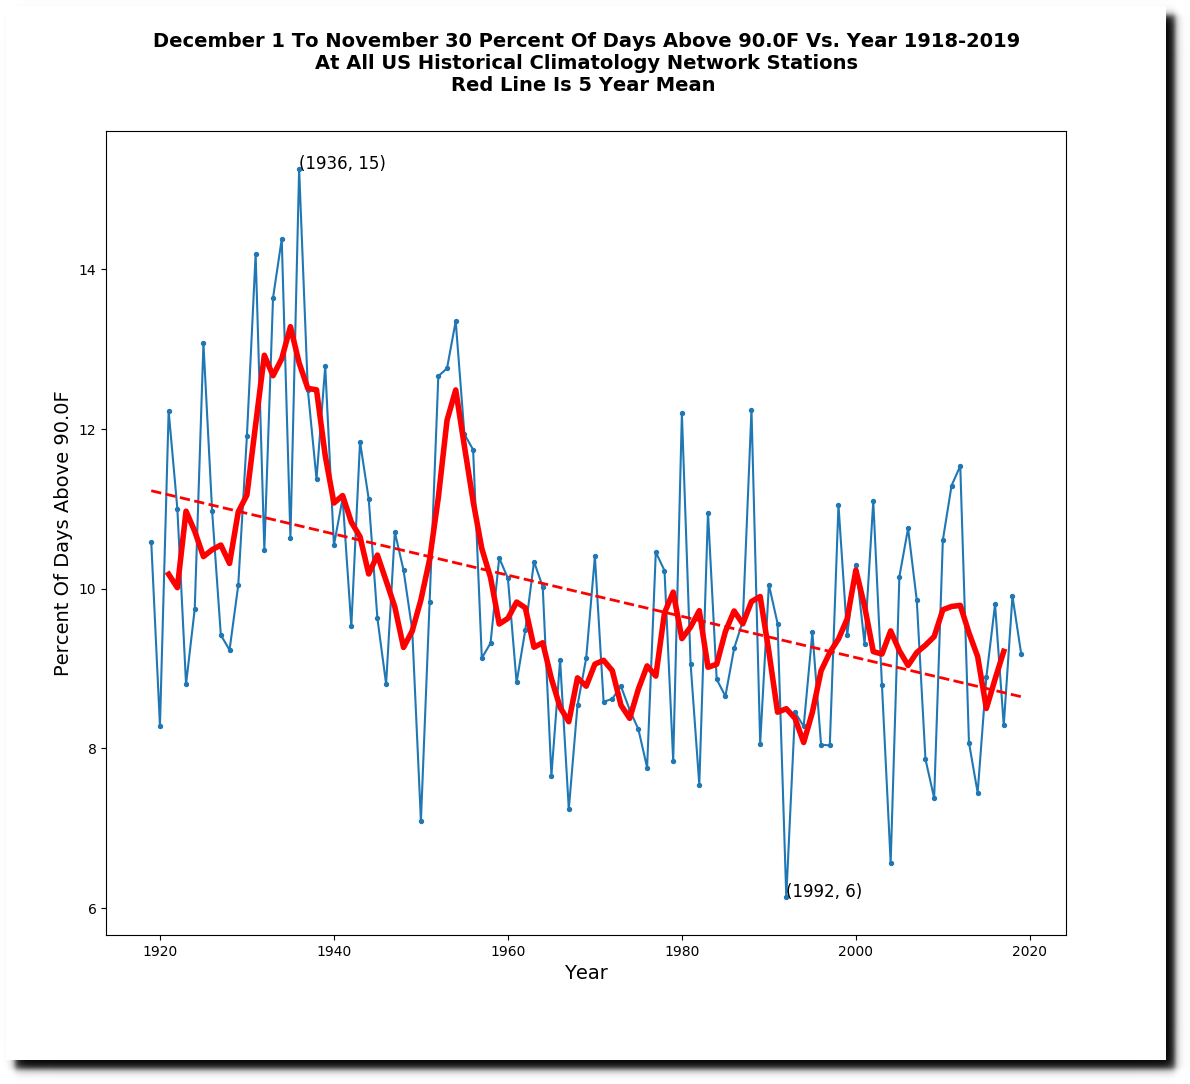
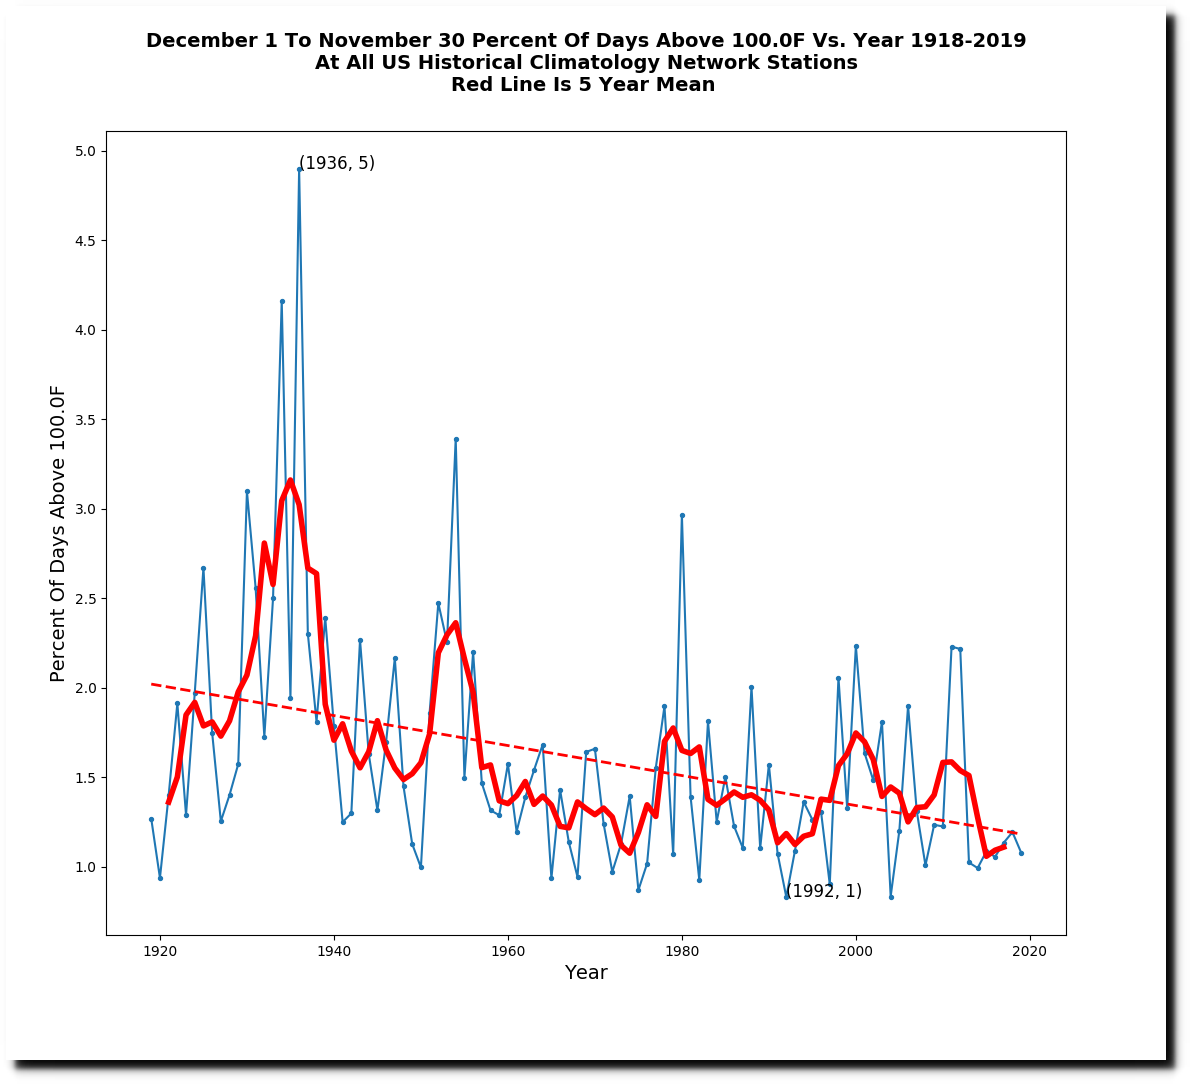
The frequency of warm and hot days has declined.
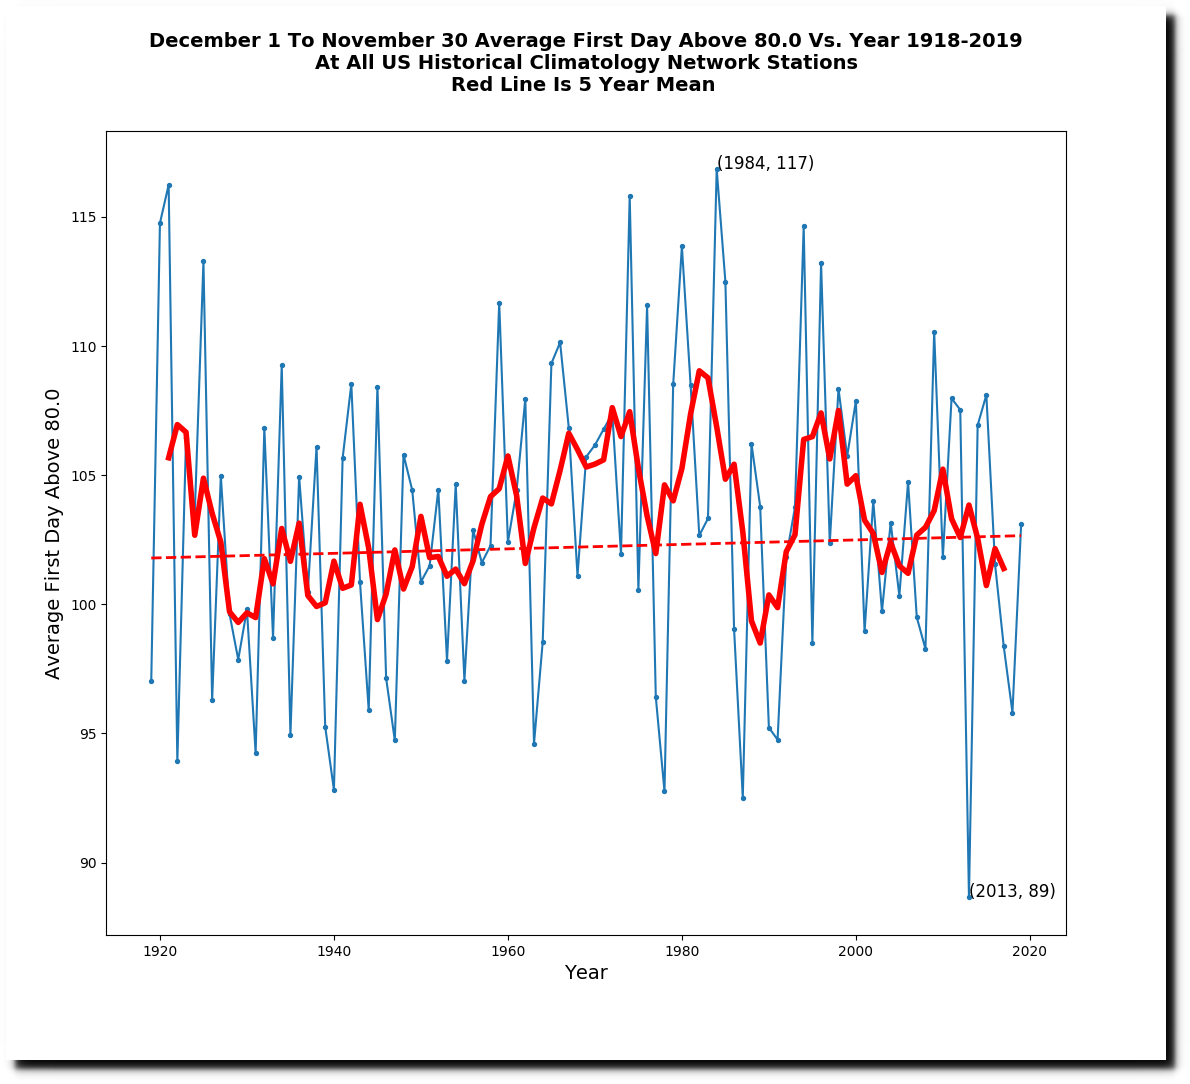
Summer starts later than it used to.
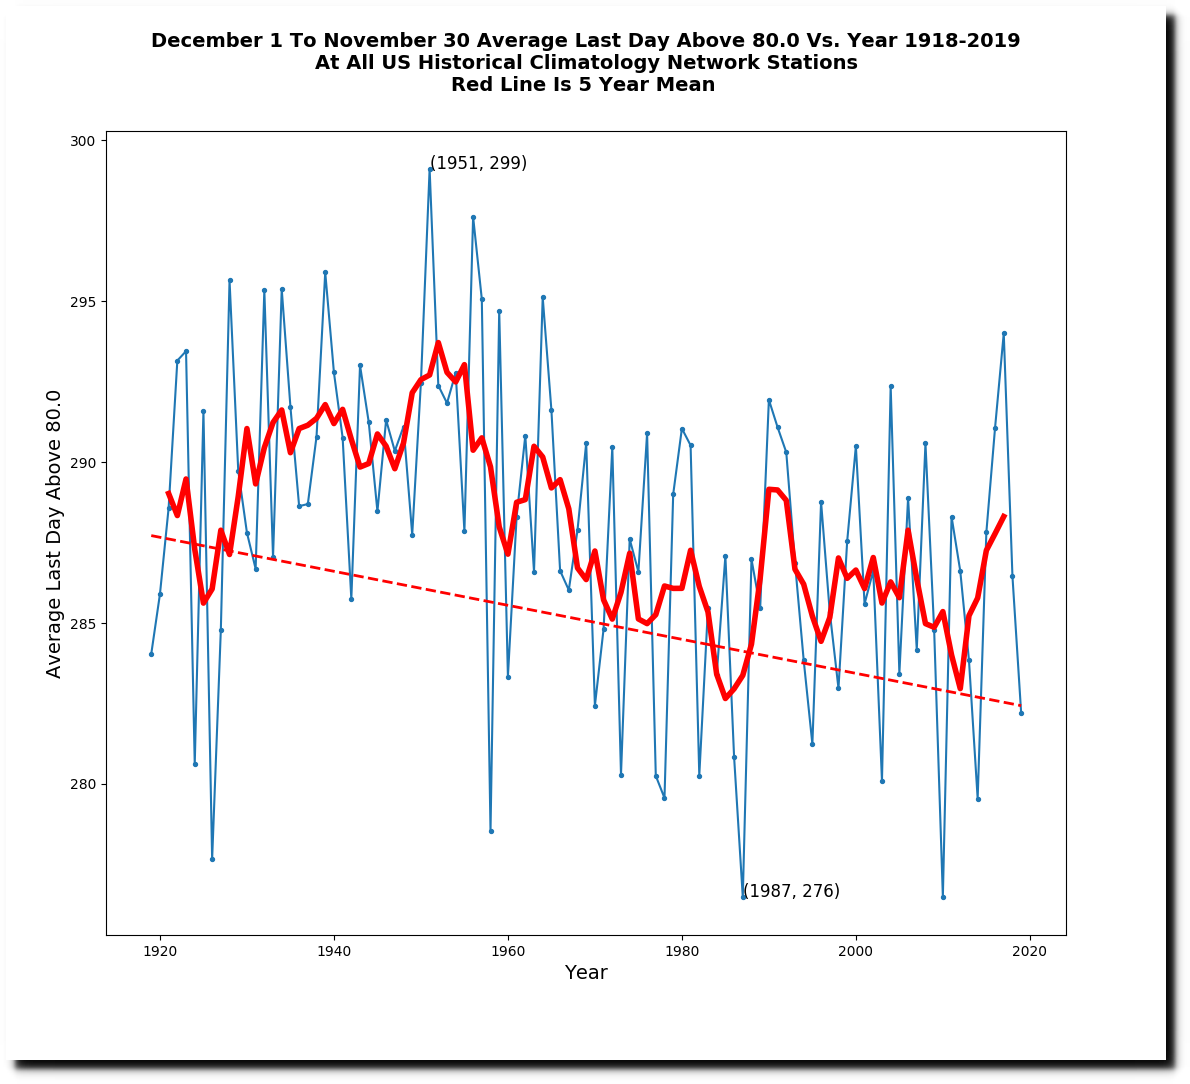
Summers end earlier than they used to.
Winters aren’t warming either.
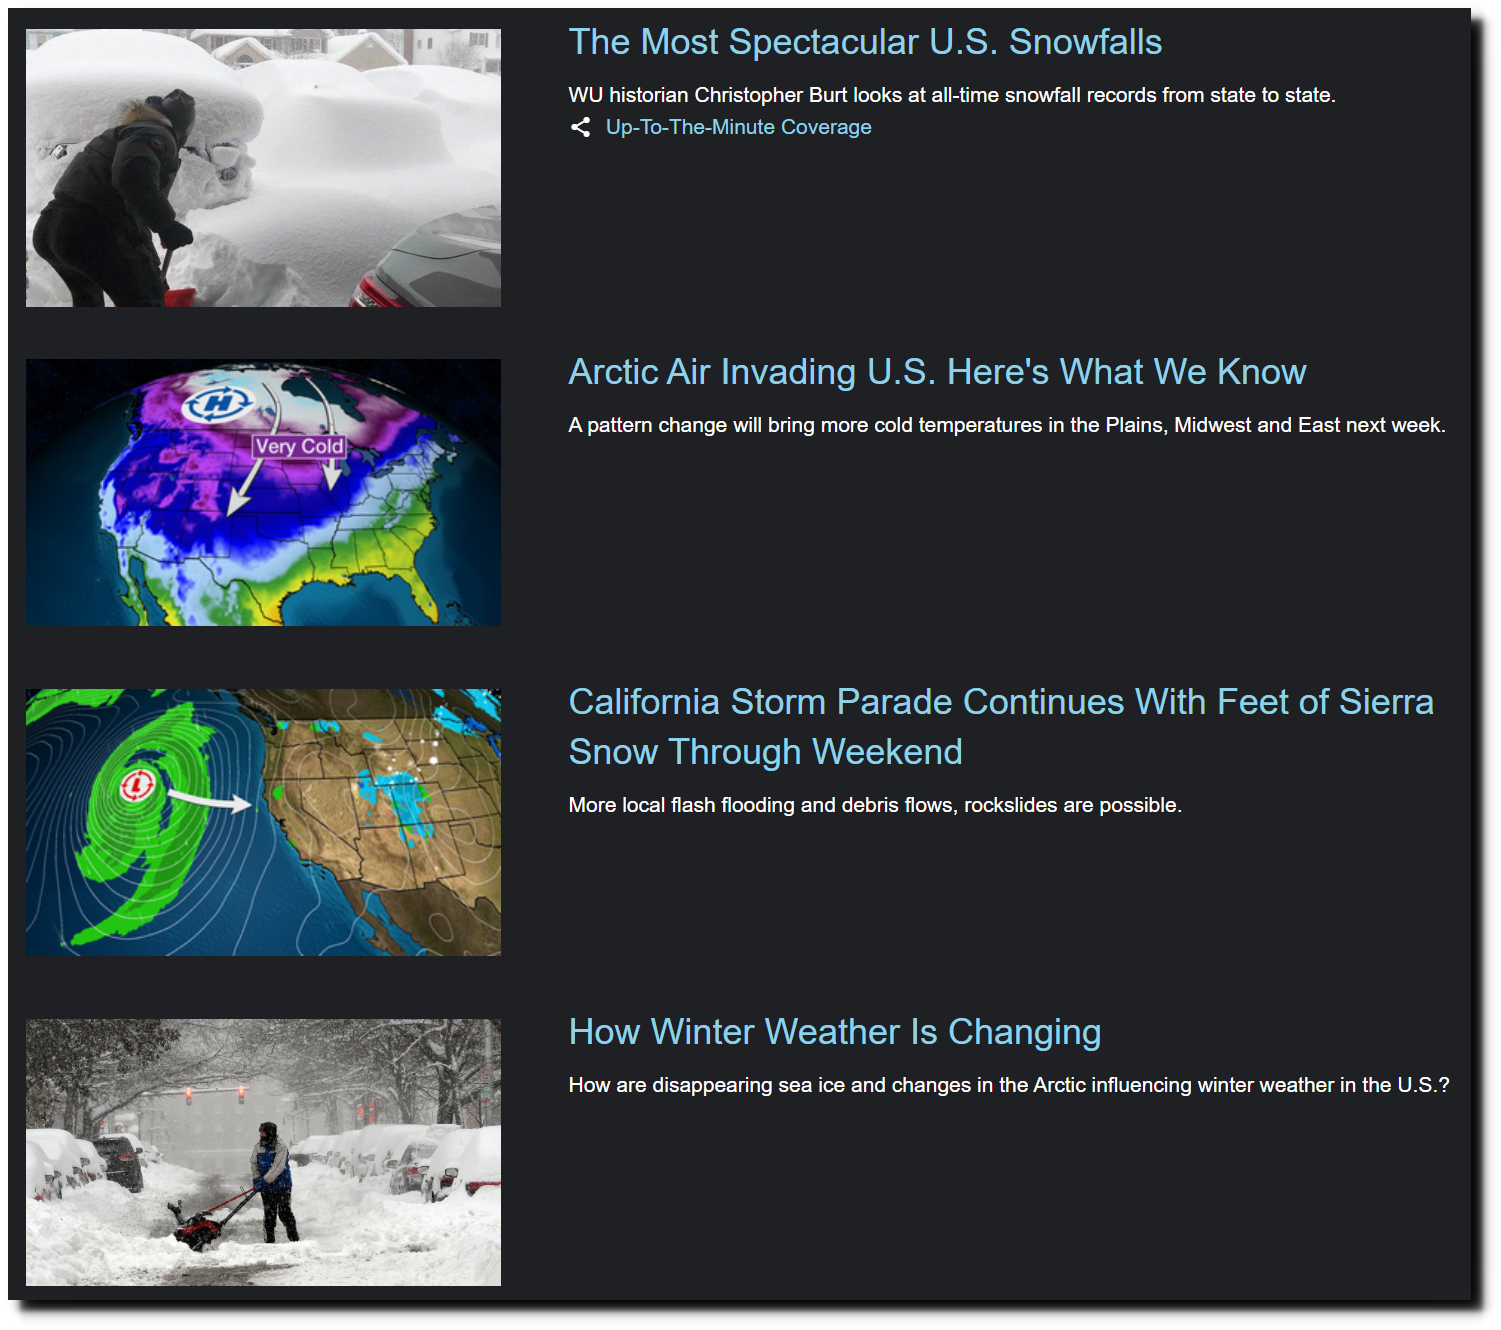
Local Weather Forecast, News and Conditions | Weather Underground
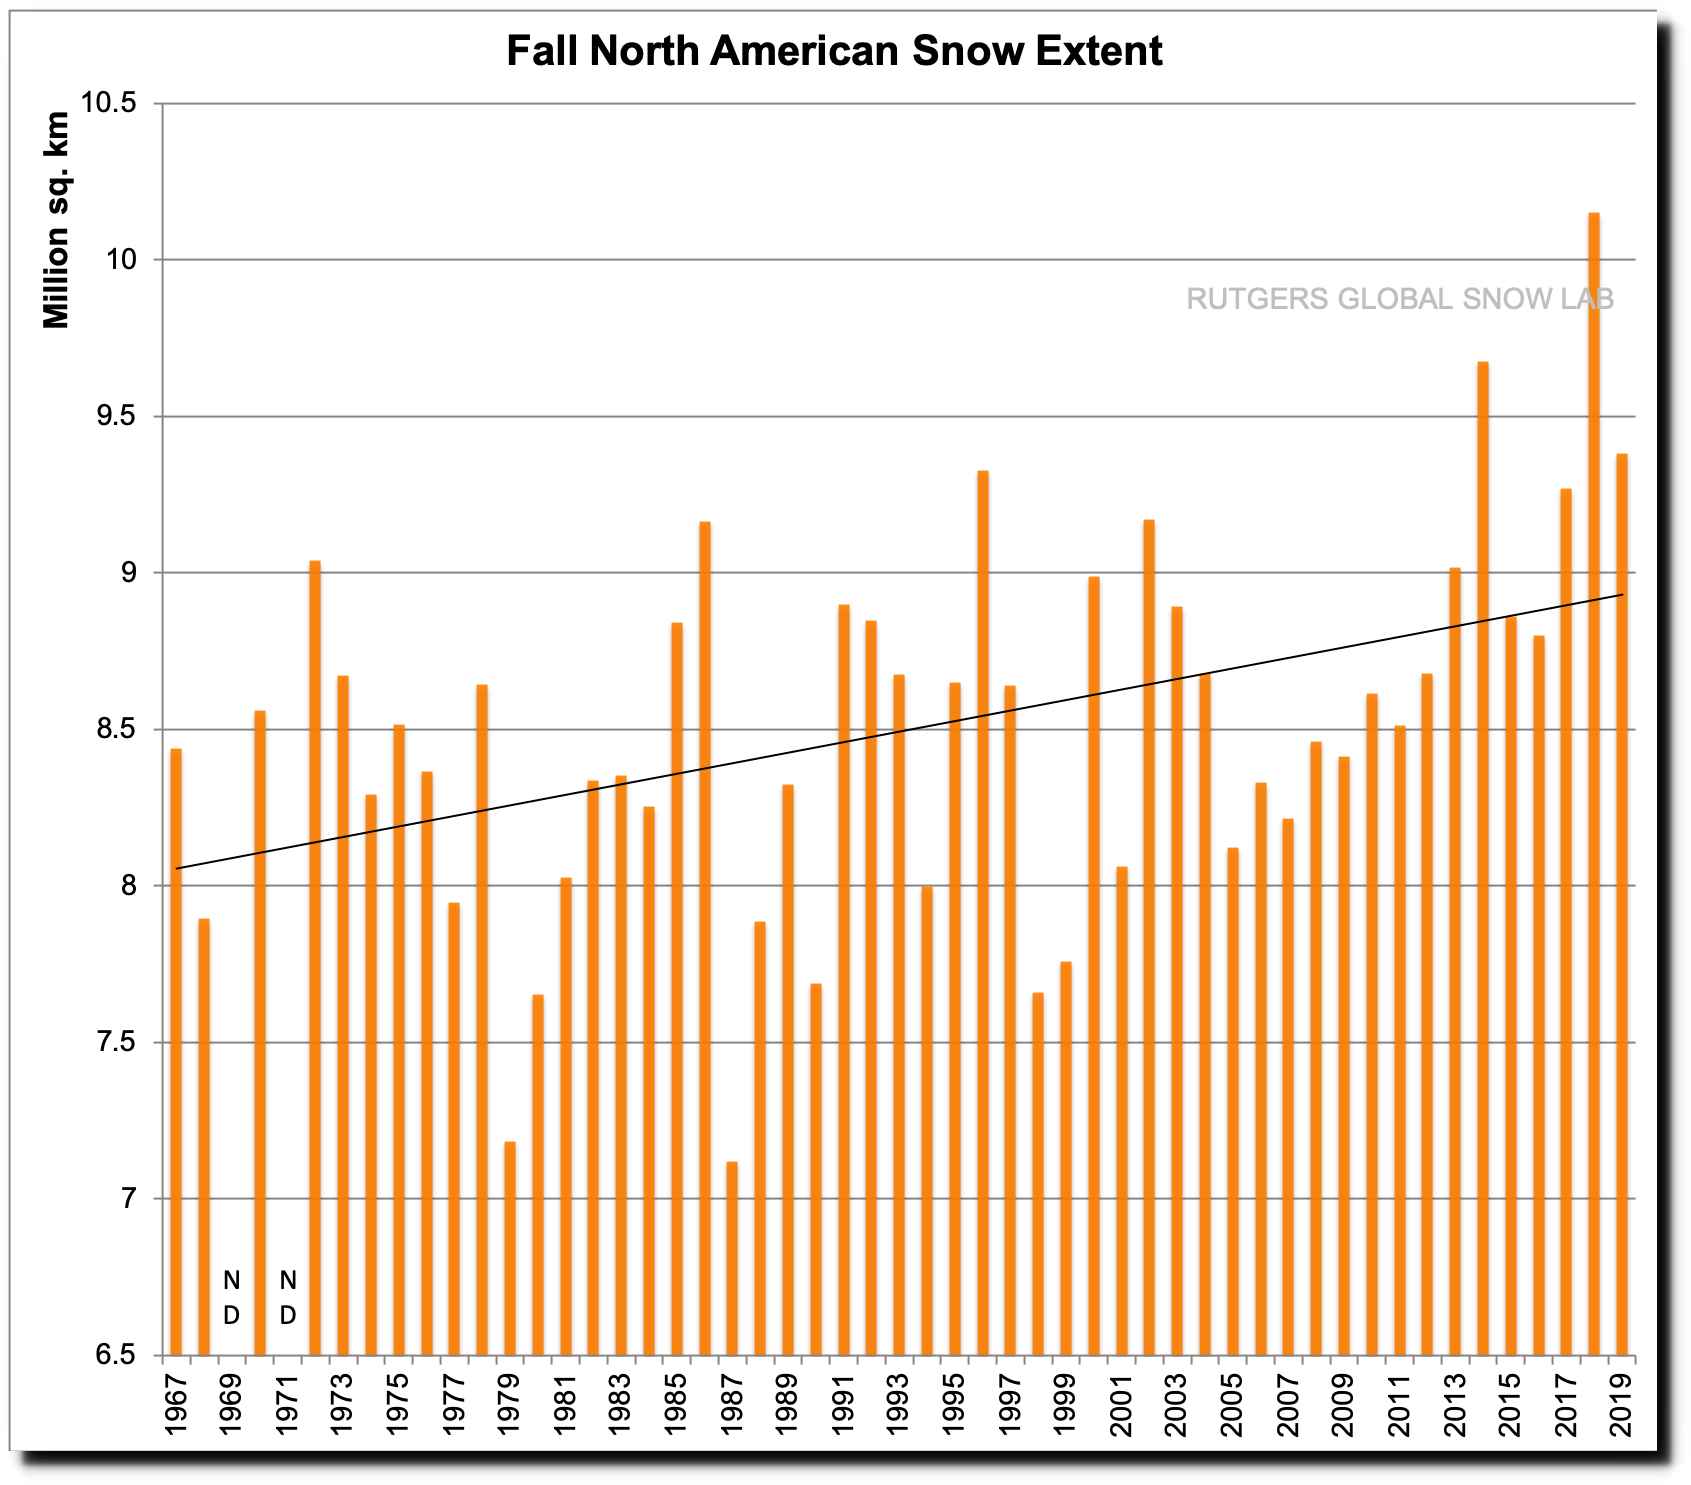
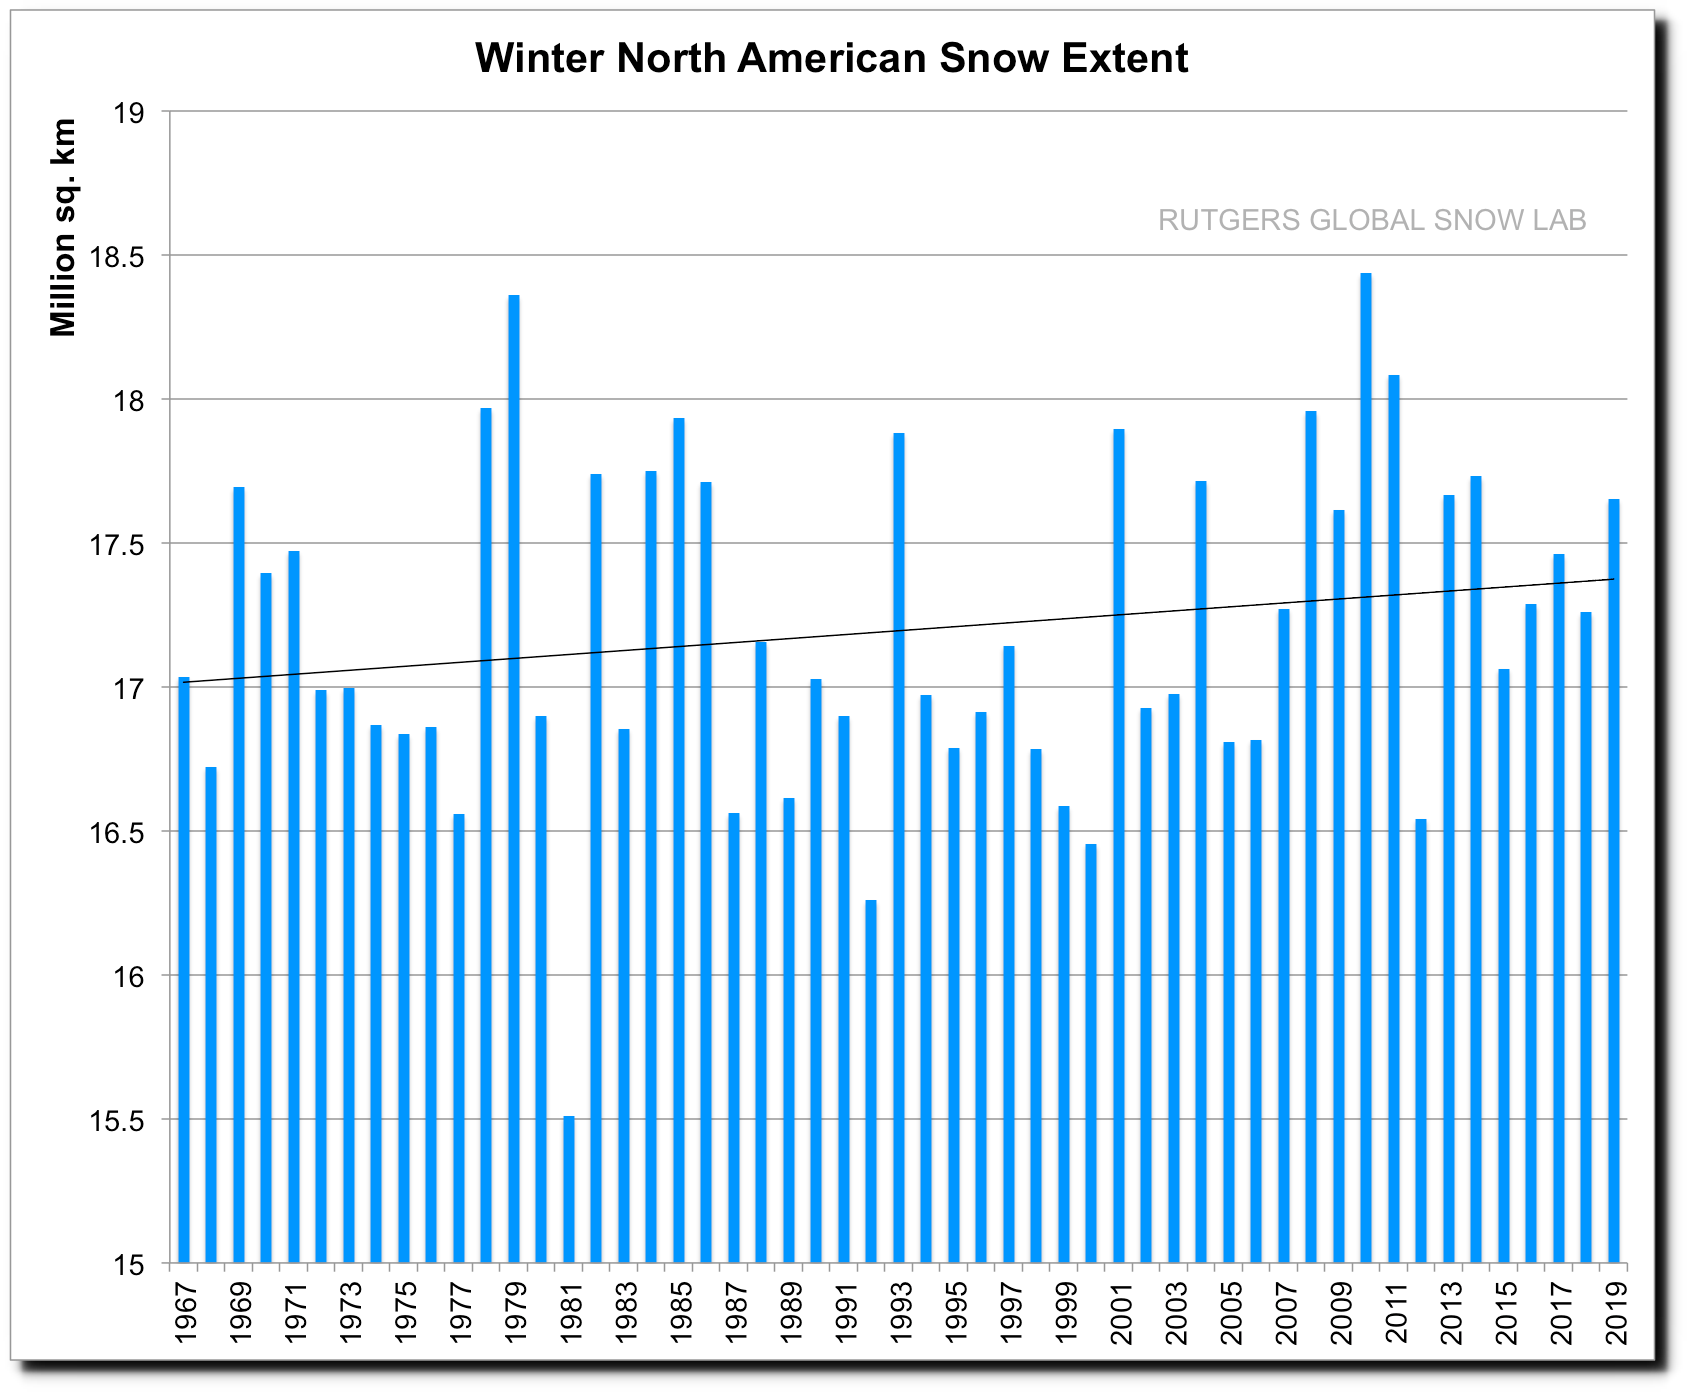
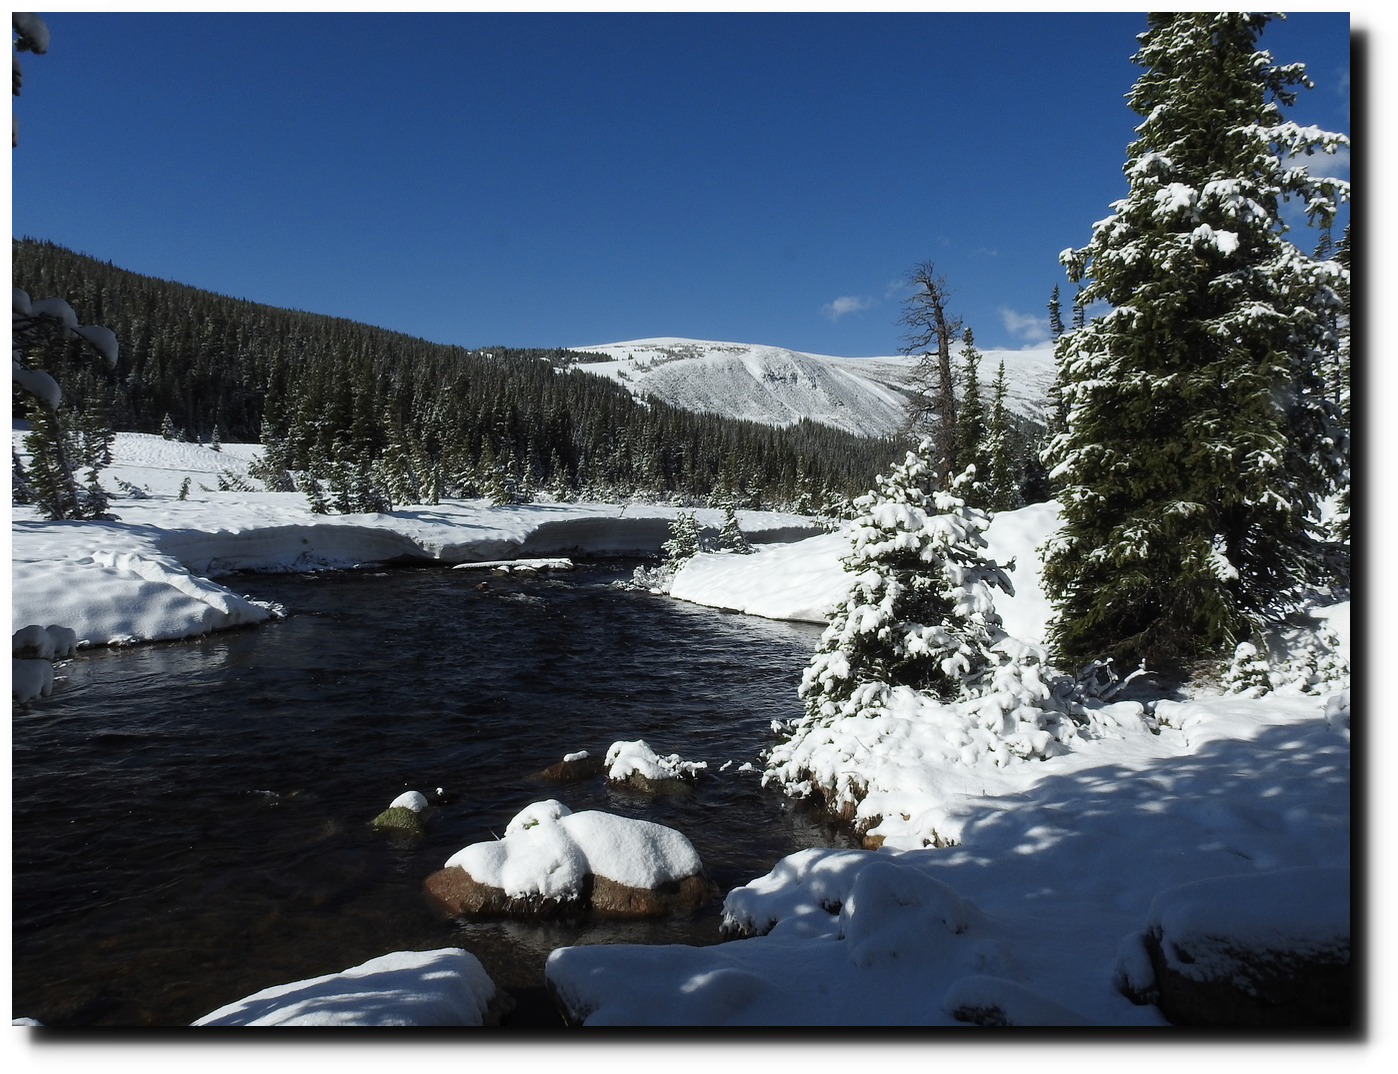
Fall/winter snow extent is increasing, indicating that polar air masses are moving further south.
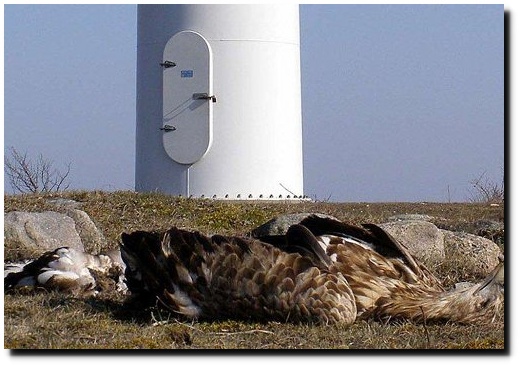
Migratory birds, by definition, live in a huge range of climates and temperatures. I took this picture of a Red Tailed Hawk in Boulder yesterday.

Here is one I took in Phoenix on New Years Day.

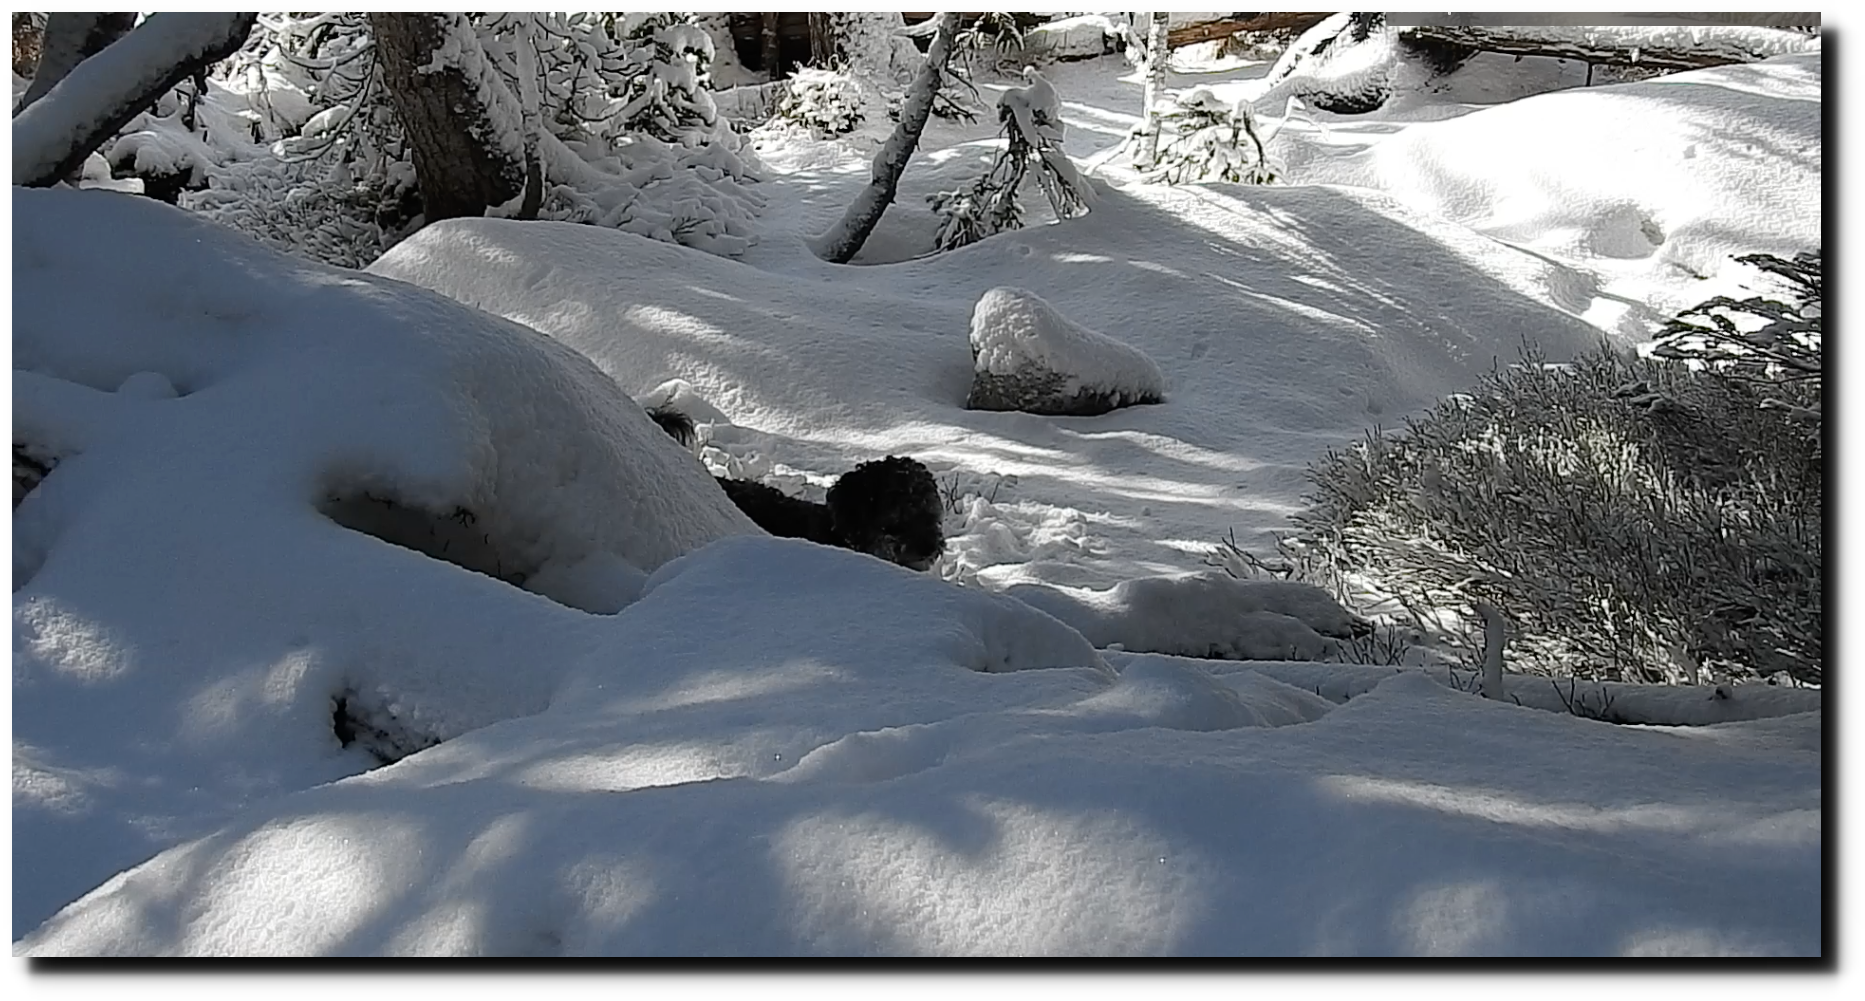
I took this Kestrel picture two days ago in Boulder.
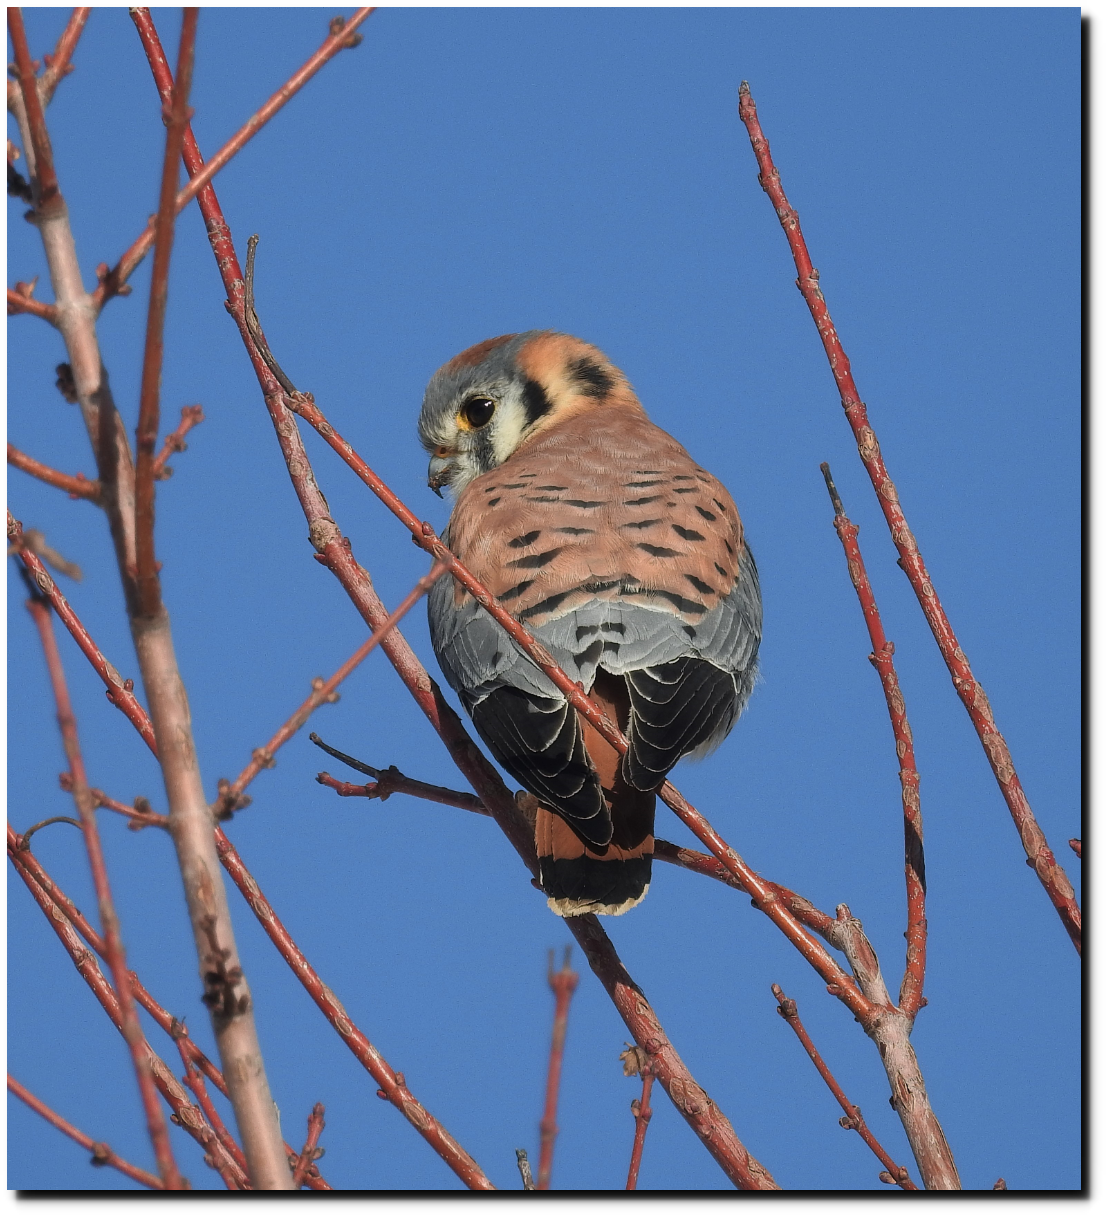
Here is one I took in Phoenix in May during a week with 100 degree weather.

Northeast of Phoenix on New Years Day, 2019
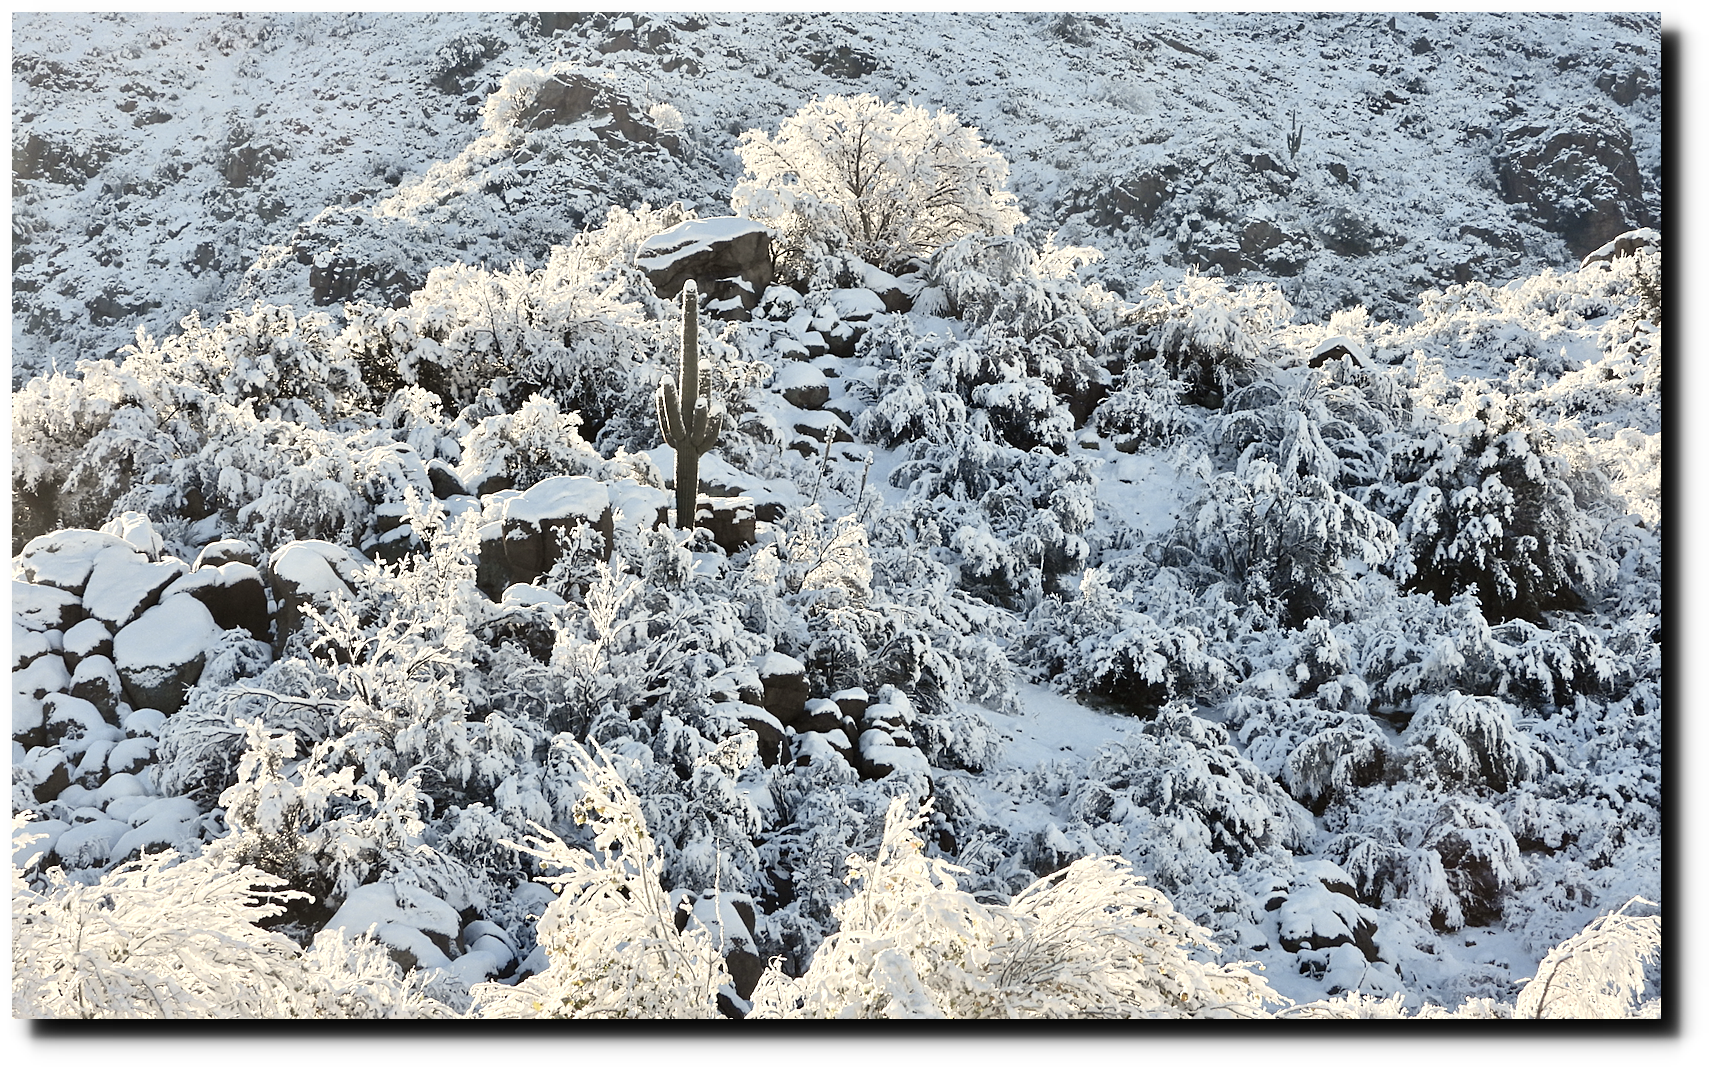
Scottsdale on February 22, 2019.

West of Boulder on the first day of summer, 2019.
There are huge numbers of factors affecting birds, including habitat loss and pesticide usage. The authors assumed what they were seeing was due to climate change, without producing any evidence to support it. Here is another article discussing the same theories, which said that they don’t hold up to scrutiny.
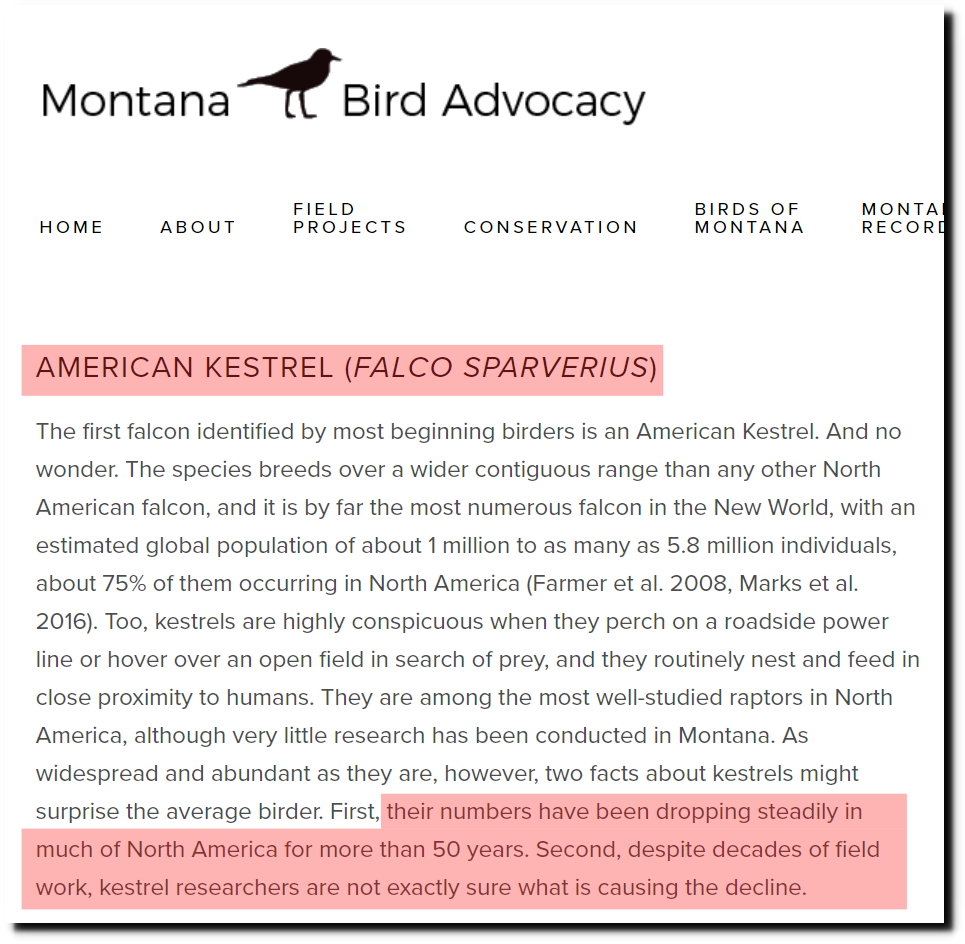
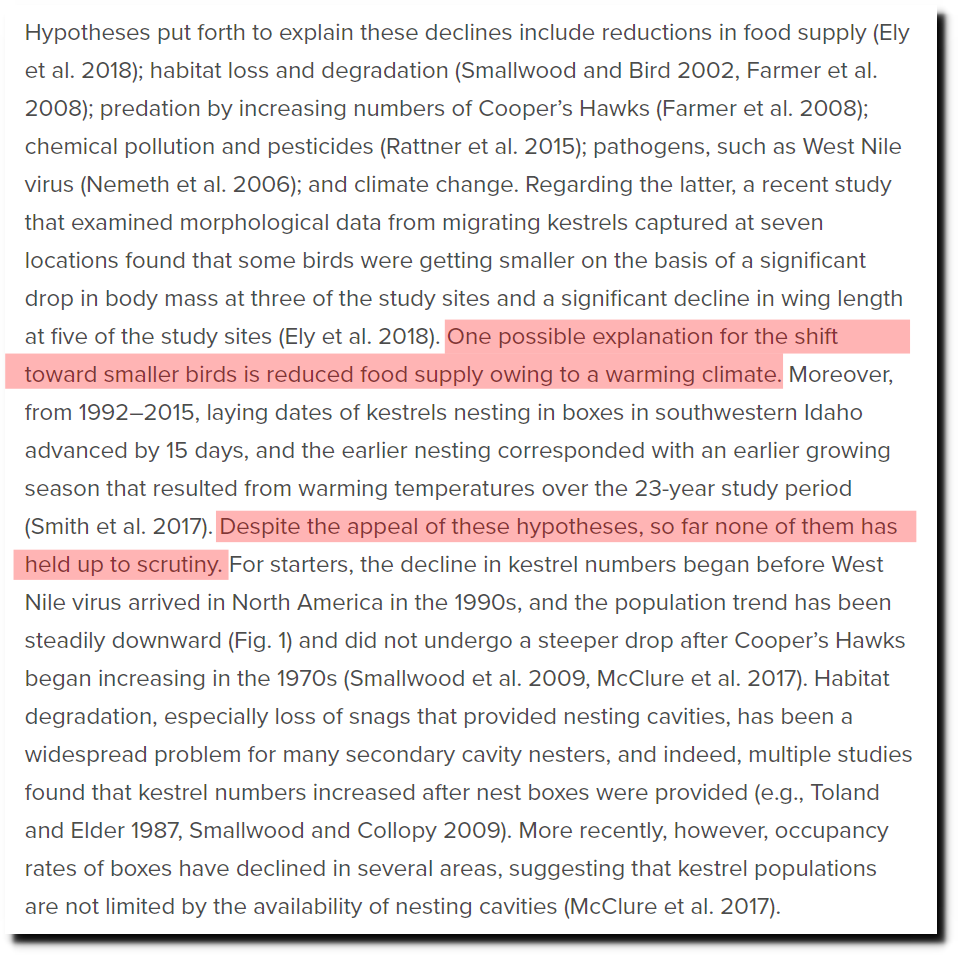
Essay no. 4, American Kestrel — Montana Bird Advocacy
“The first principle is that you must not fool yourself and you are the easiest person to fool.”
– Richard P. Feynman
Superstitions about climate lead to bad policy, which produce actual reductions in bird populations.

Posted in Uncategorized
Leave a comment
Australian Drought
The animation below shows sea surface temperature anomalies since August 1. Australia (like much of the southern hemisphere) has been surrounded by unusually cold water for months, which is the normal situation which causes drought.
Current Operational SST Anomaly Charts – OSPO
This cold water also just caused Australia’s coldest summer temperature on record.
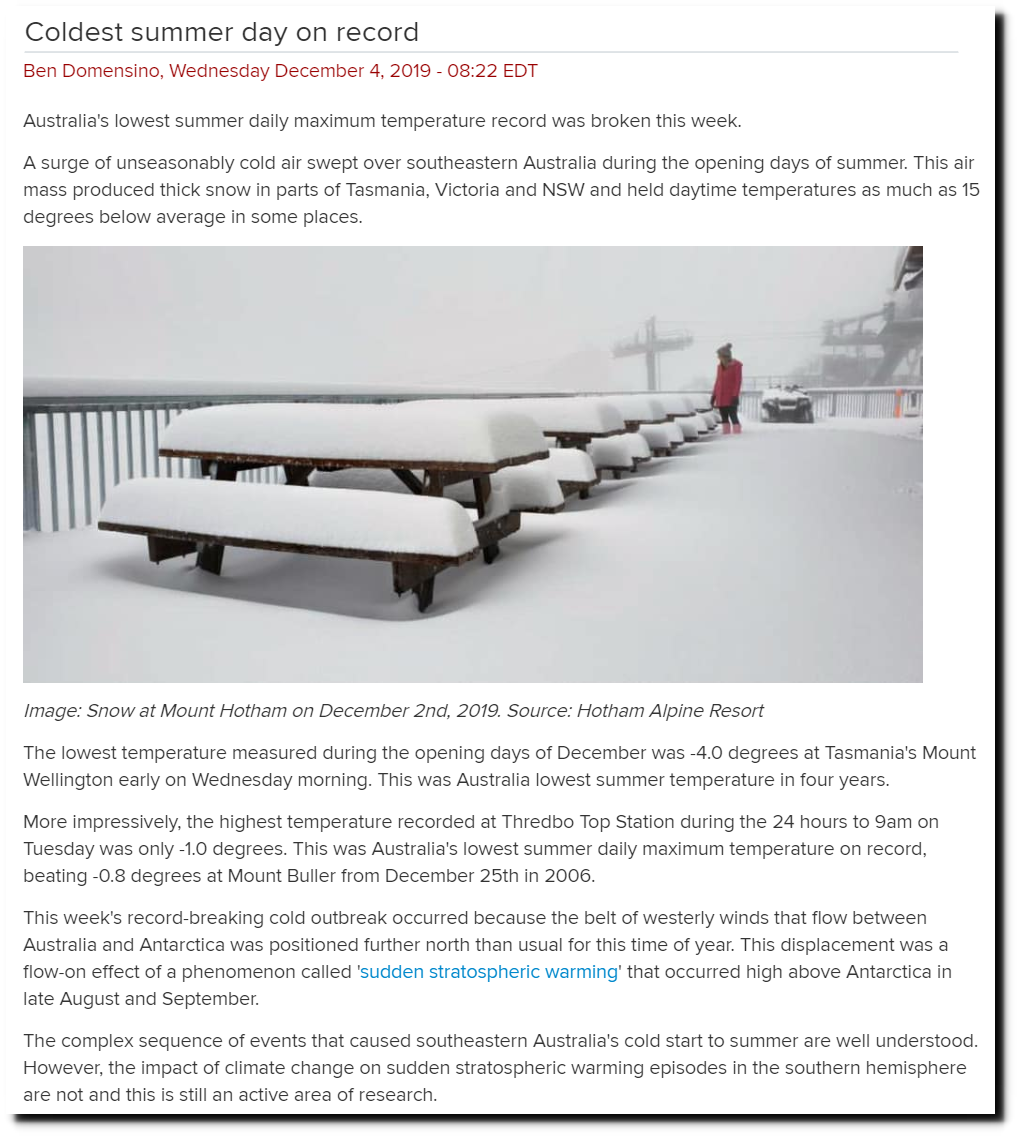
Weather News – Coldest summer day on record
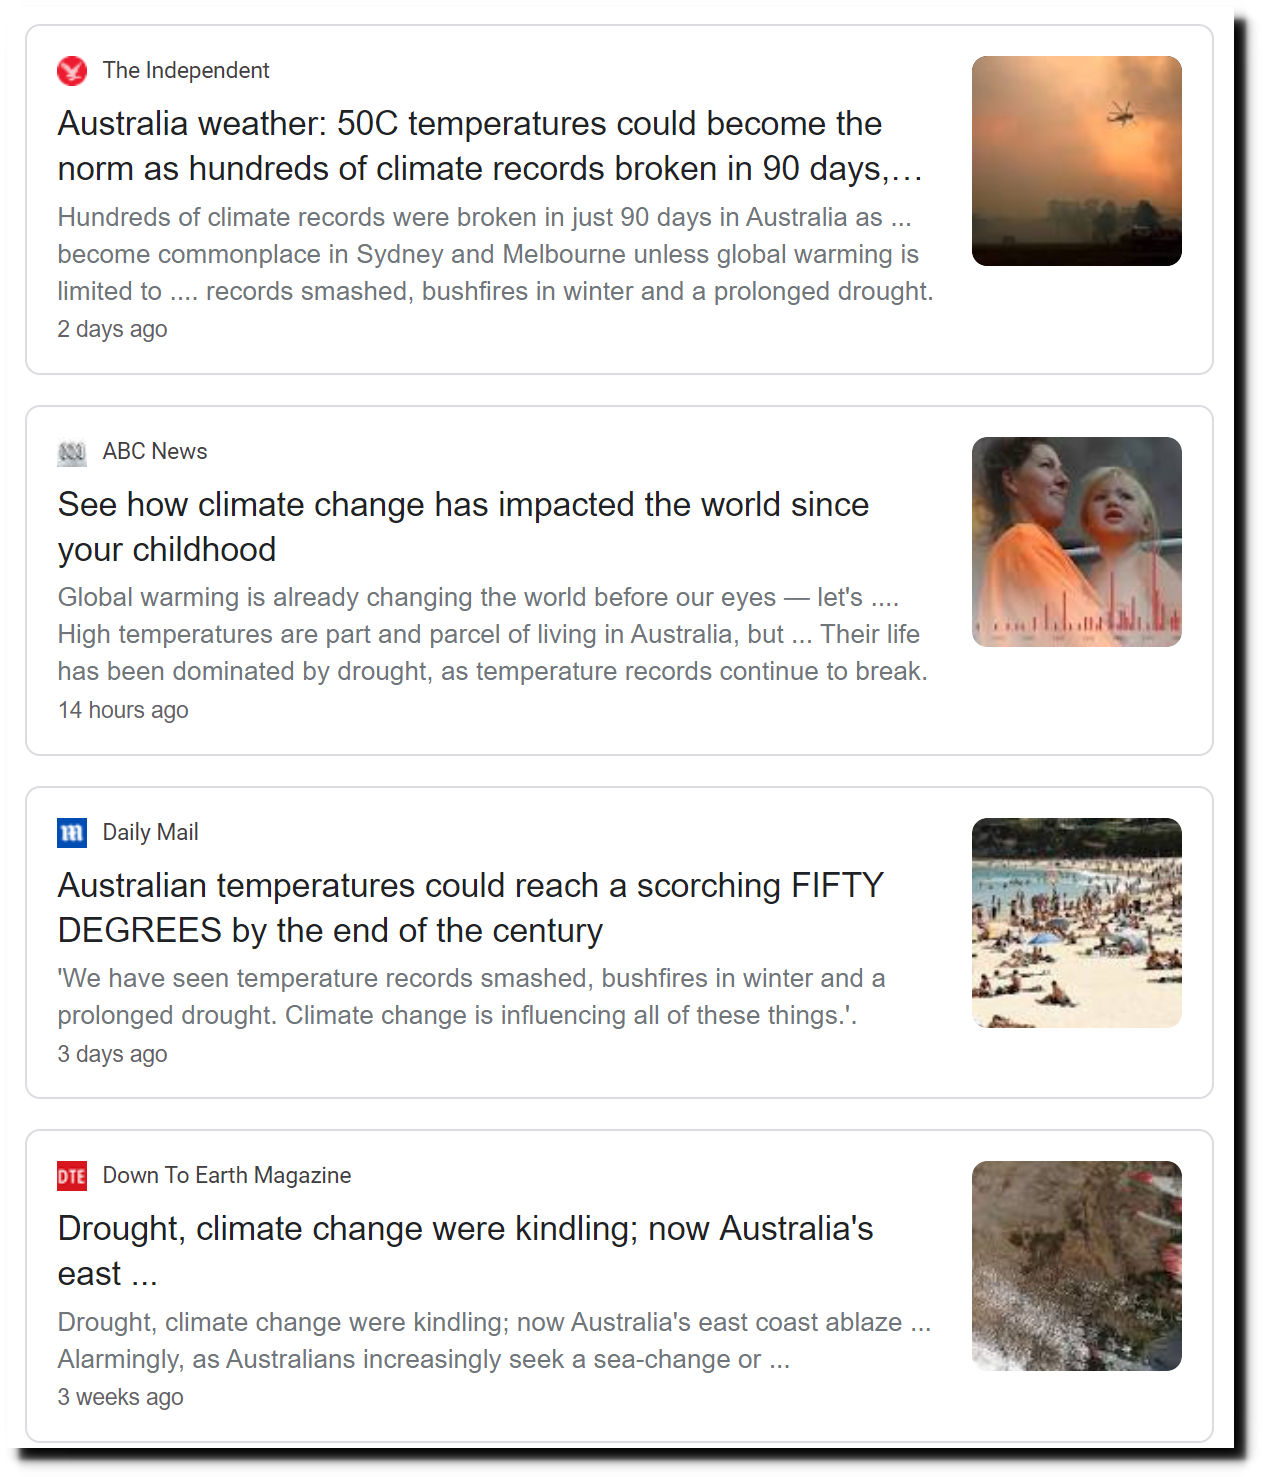
The press is (as always) taking advantage of the drought to spread misinformation.
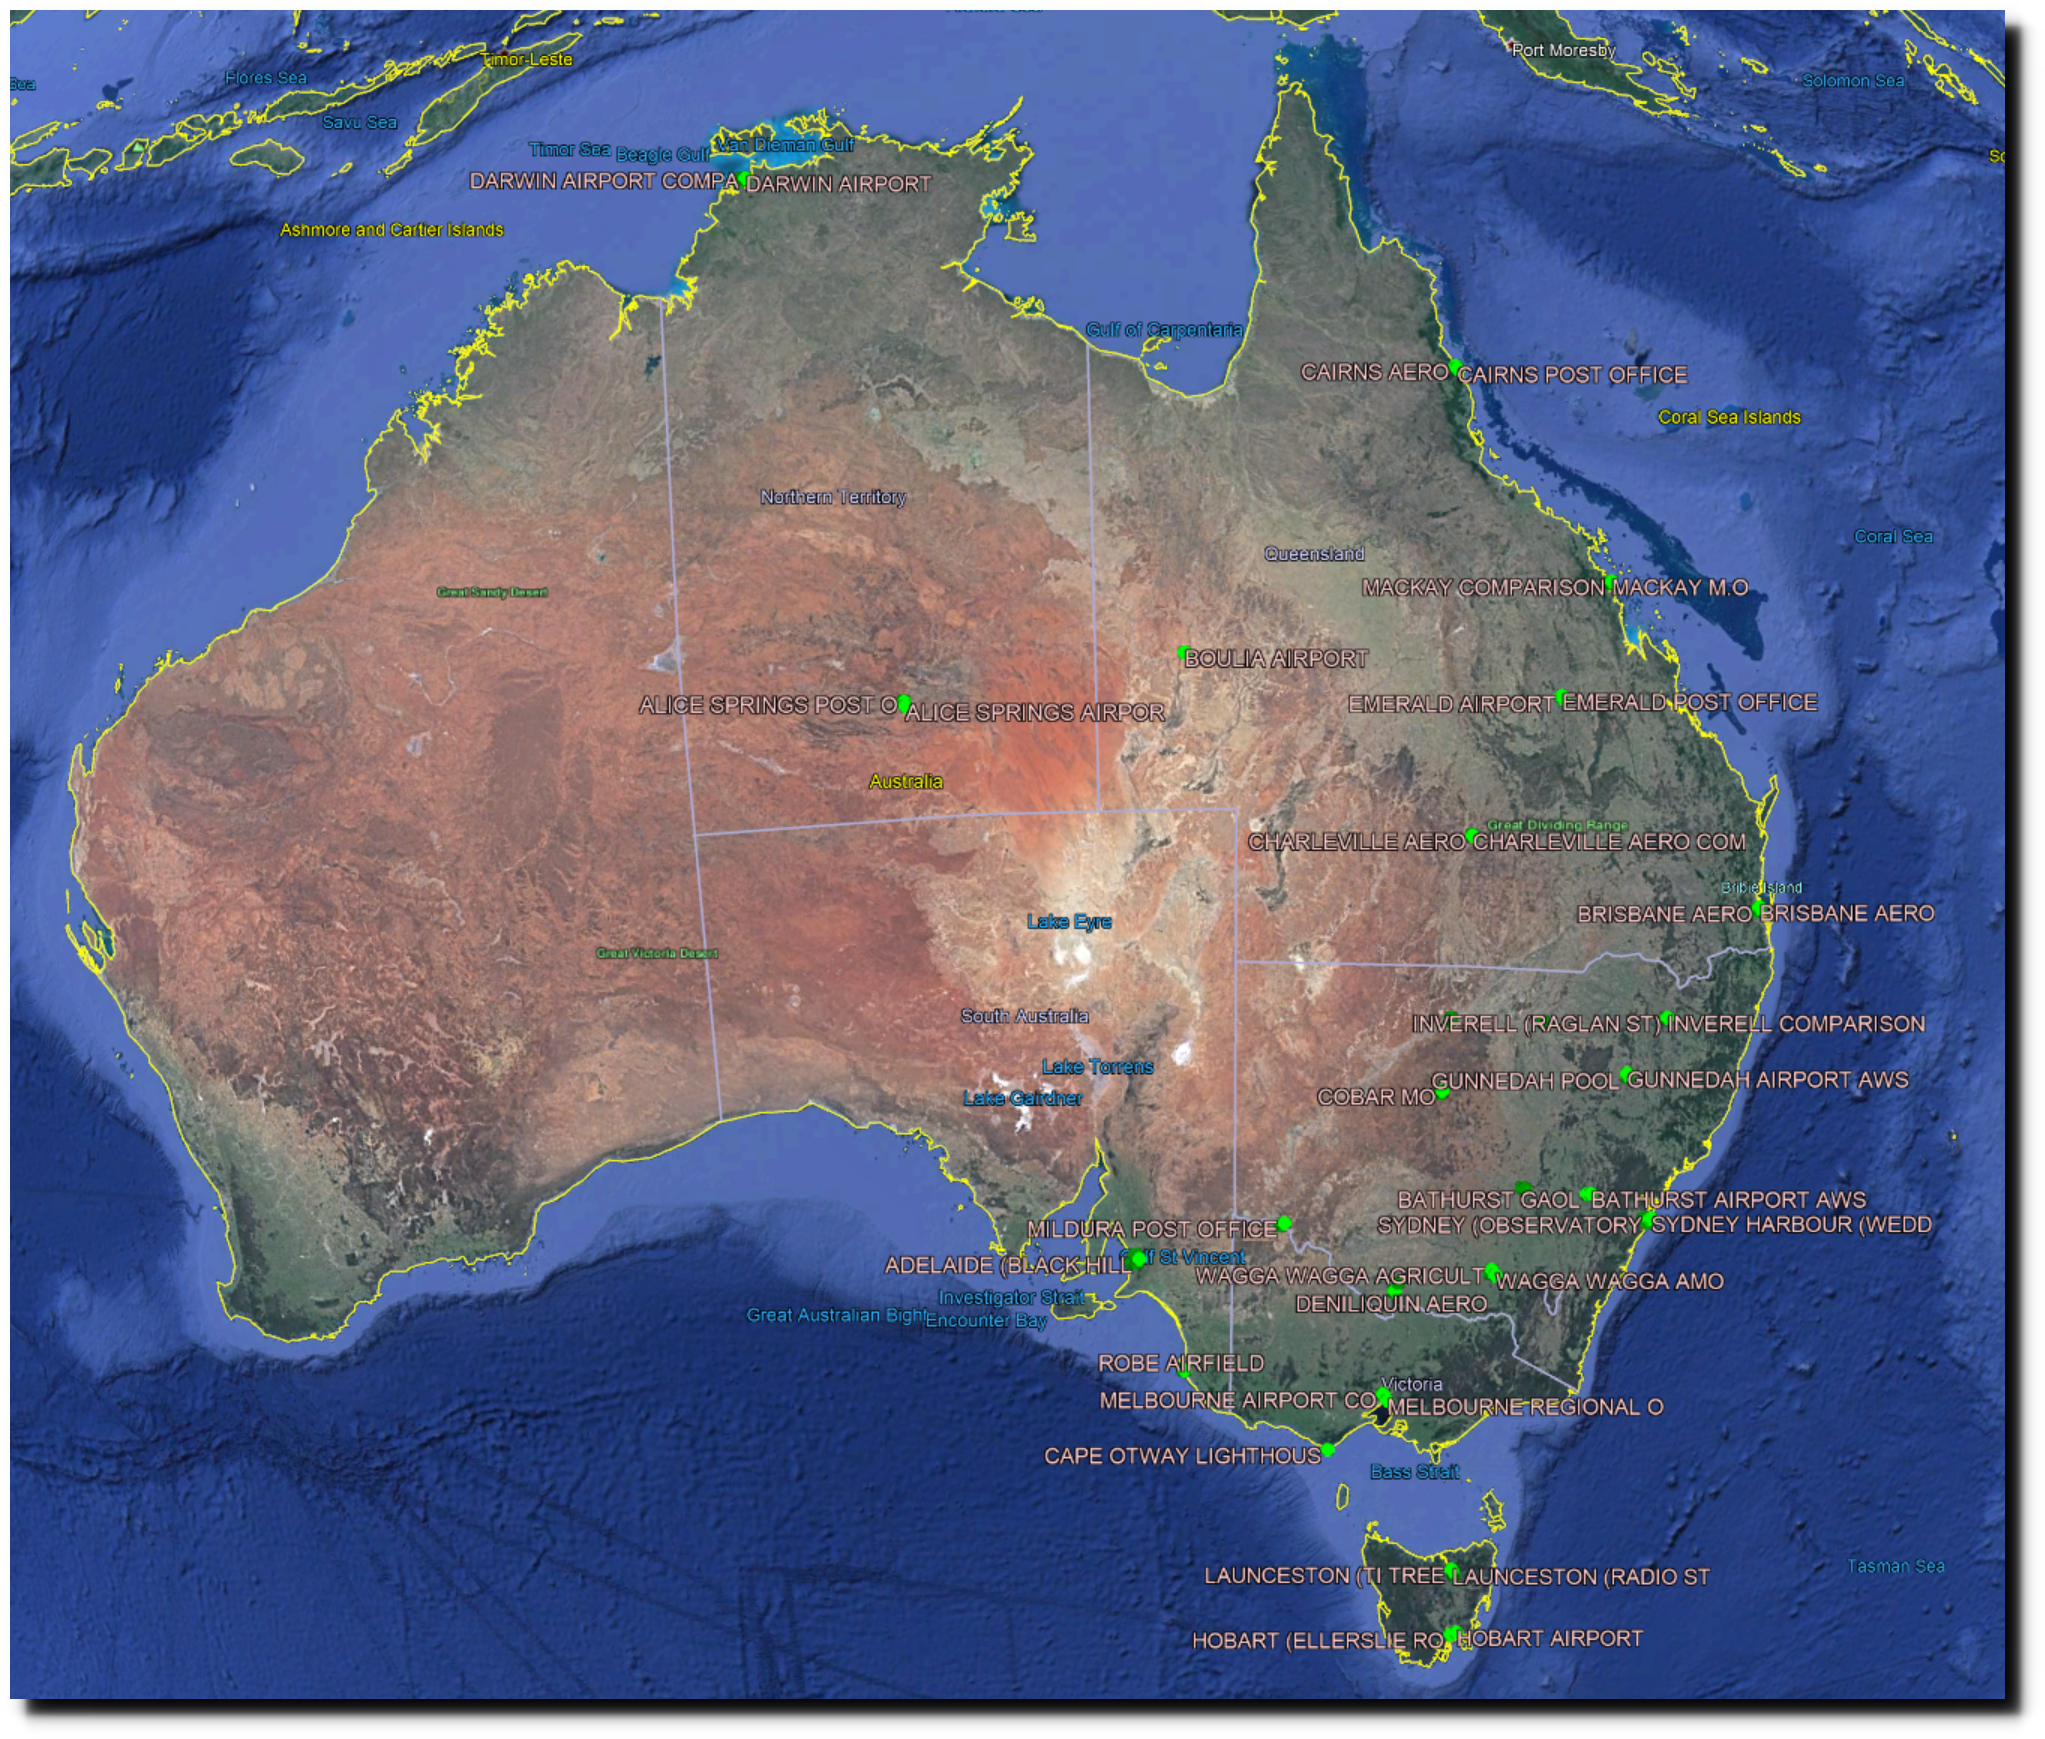
The eastern half of Australia has a fair number of locations with coherent long-term data.
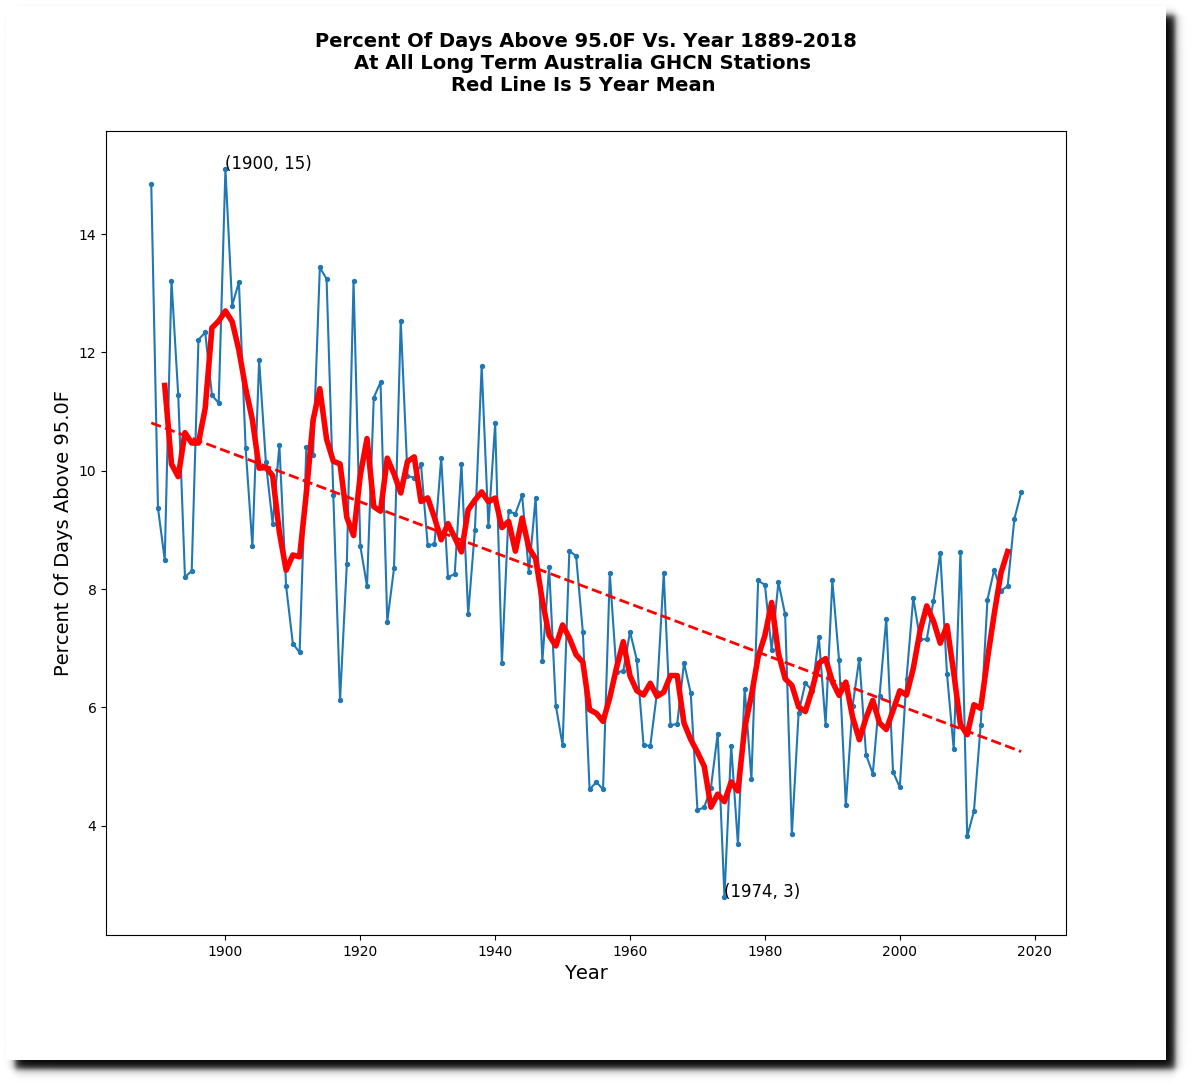
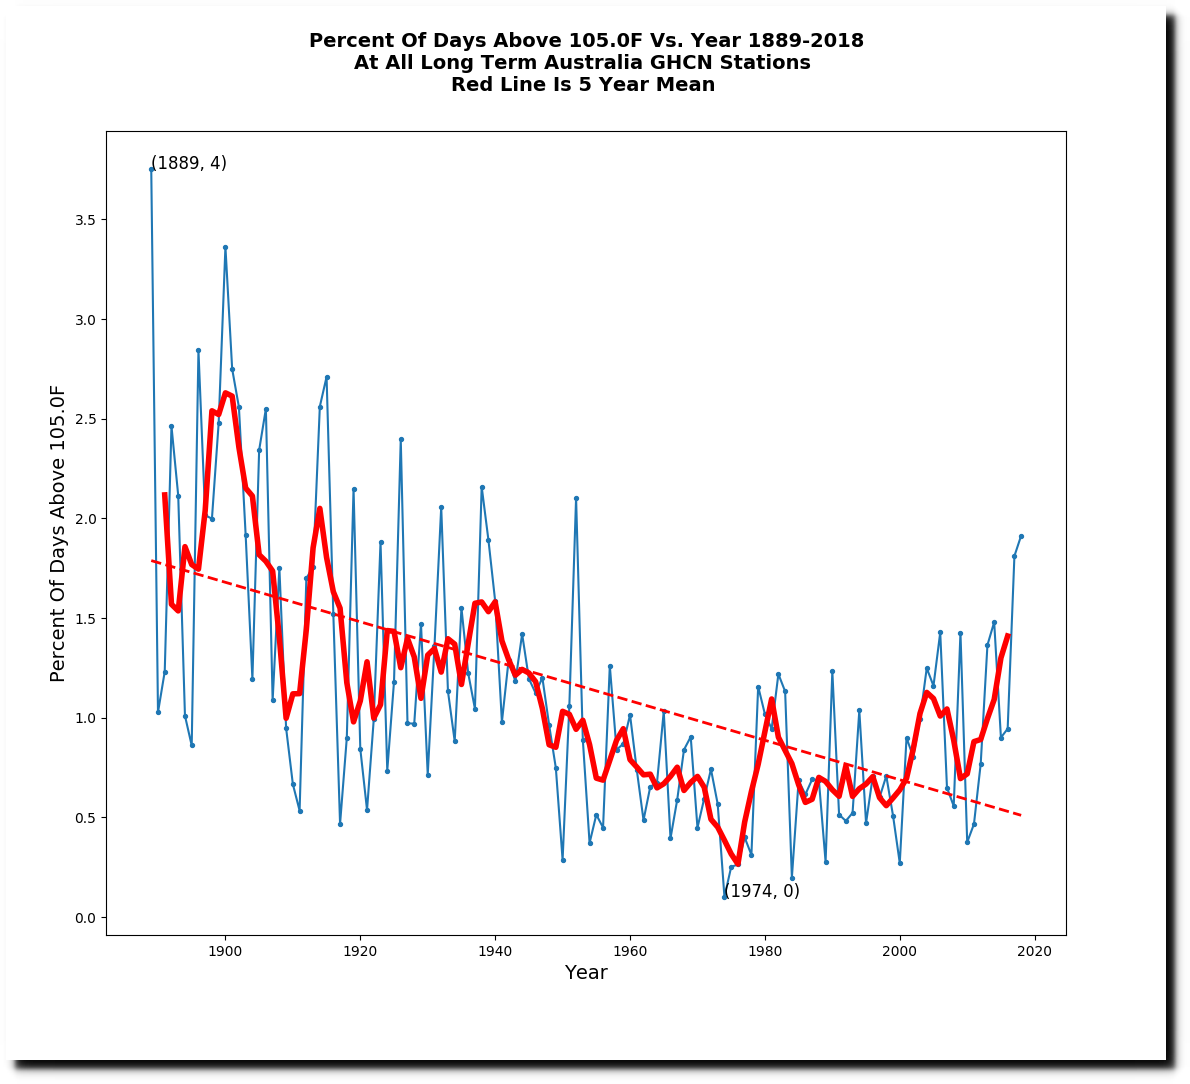
The frequency of hot days has plummeted in Australia.


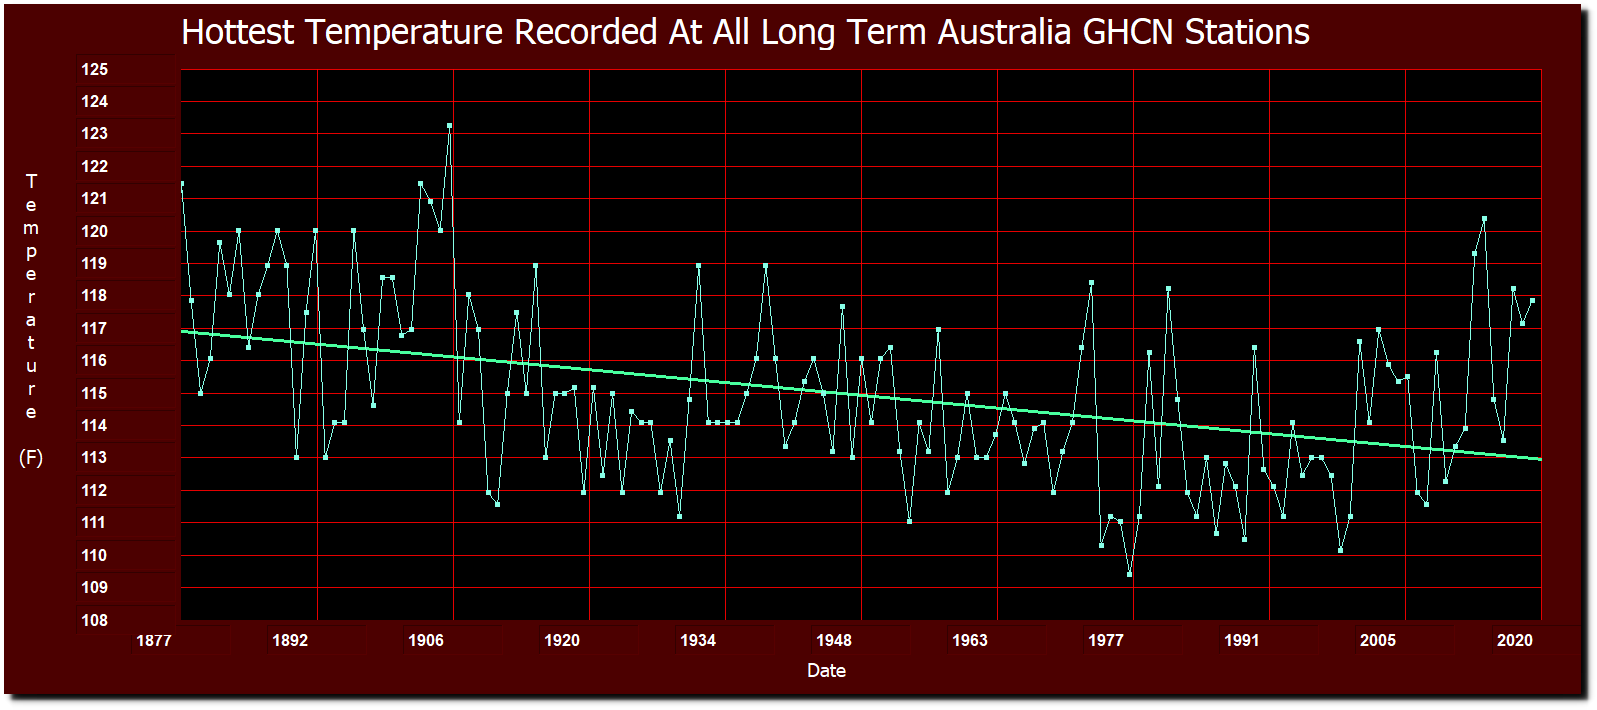
Peak temperatures have also declined.
The longest heatwave in the Australian GHCN record was at Boulia in 1889.

The world’s record heatwave occurred in western Australia during 1923-1924.
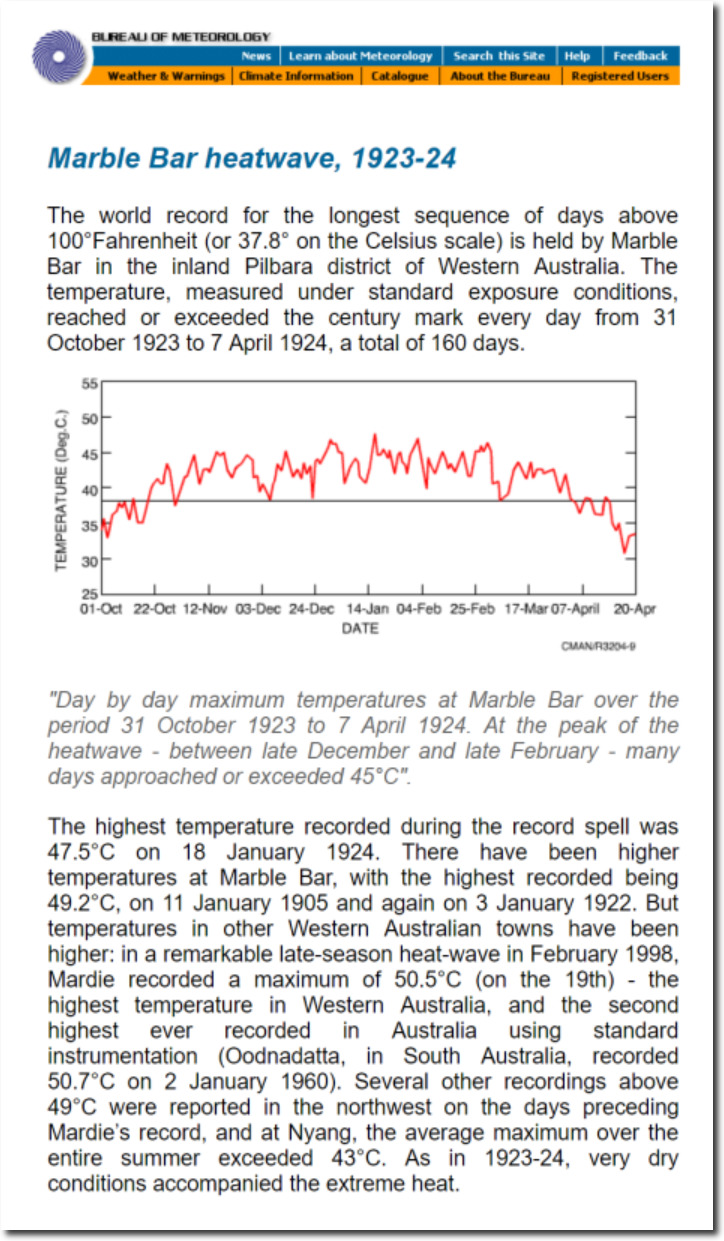
BOM – Australian Climate Extremes
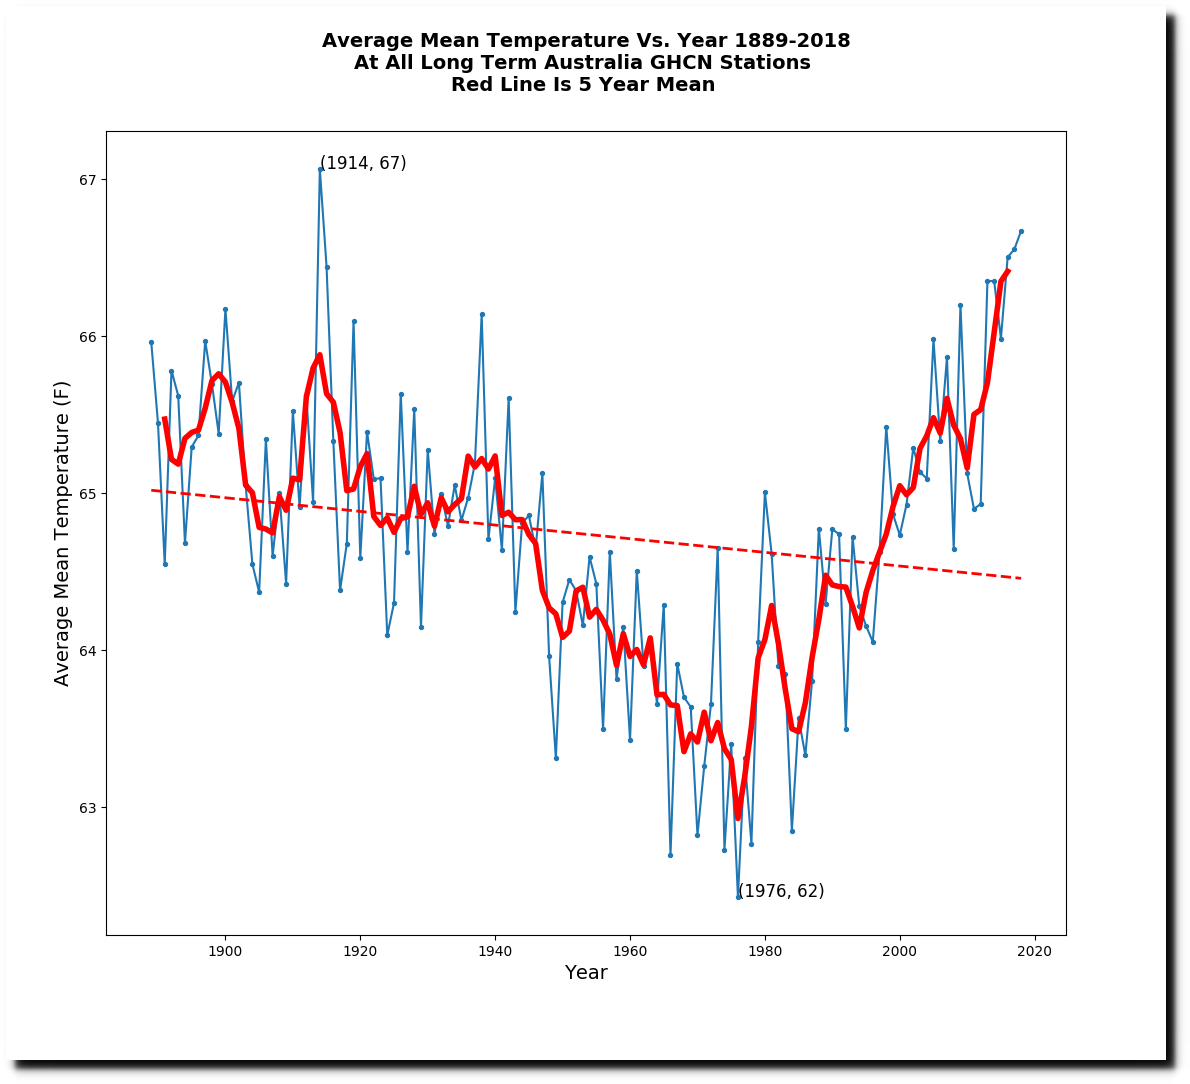
Average afternoon temperatures declined sharply from the 19th century, and bottomed out during the global cooling scare of the 1970s. Since then, they have risen back to 19th century levels.

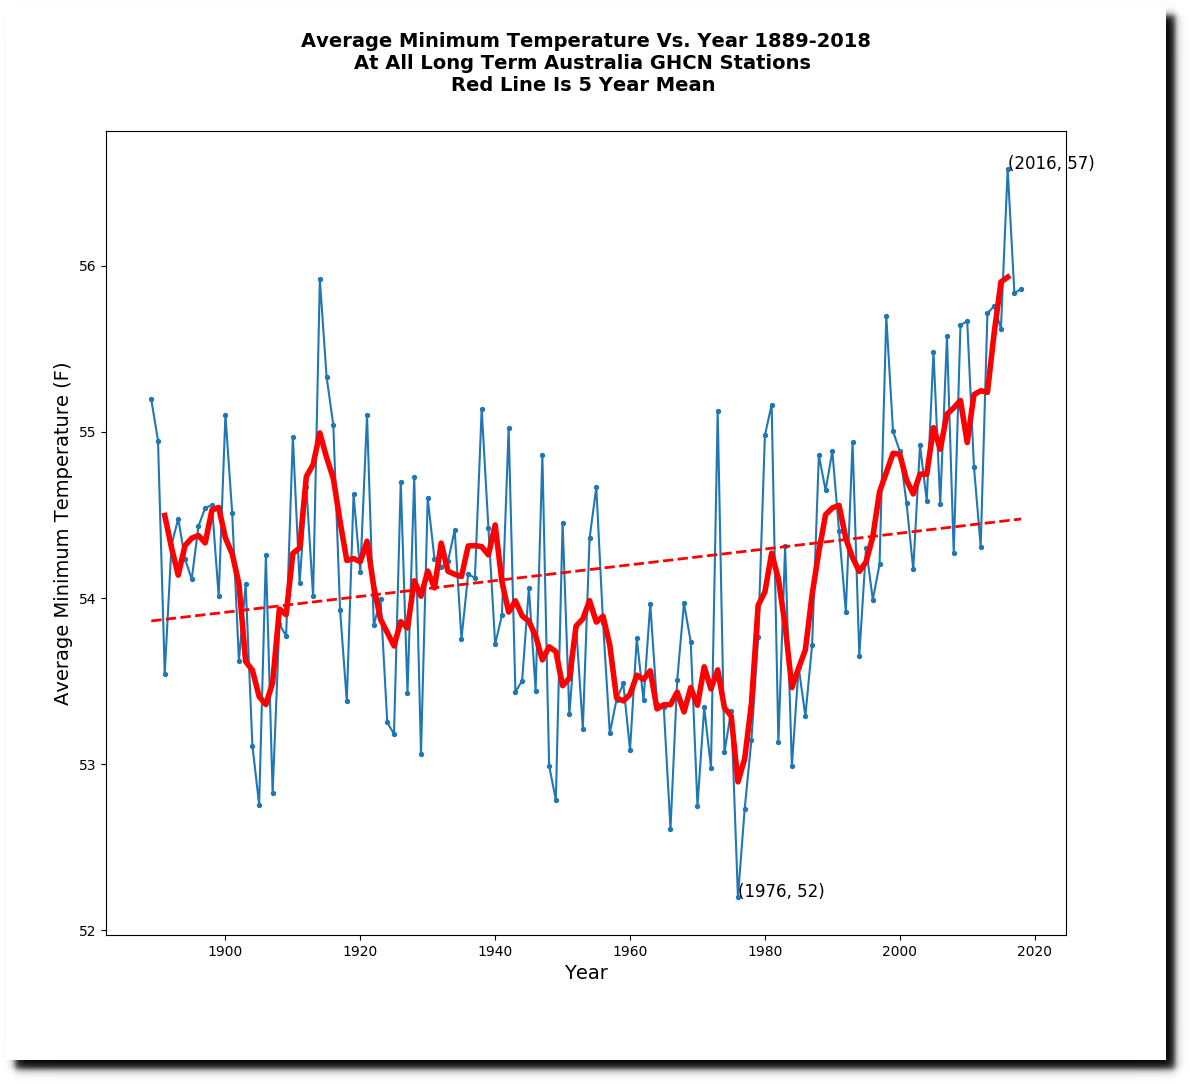
Minimum and mean temperatures have risen sharply, likely due to urban heat island effects.
The climate of Australia has always been alternating droughts and floods.
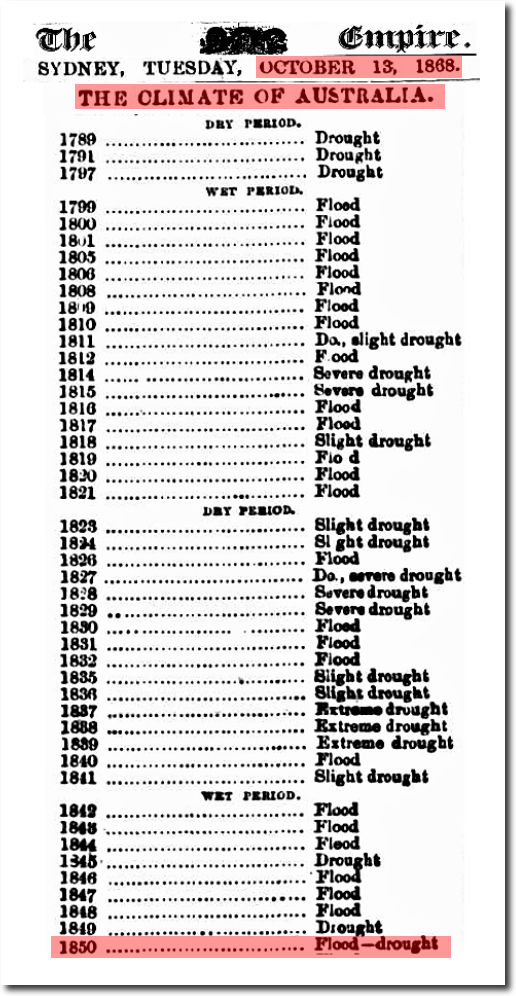
13 Oct 1868 – THE CLIMATE OF AUSTRALIA
Australia’s worst bush fores occurred in 1851.
BLACK THURSDAY.
PROBABLY one of the most terrible days of which there is any record in Australian annals was Thursday, the 6th of February, 1851, commonly known as Black Thursday. But a small proportion of our present colonists have any recollection of that day, as our total population then only amounted to about 70,000 souls, against the 350,000 of to-day. But such of their number as have access to files of the newspaper published at the time, would do well to turn them over, and, as a warning for the future, glance at the narrative of the disasters of that dreadful day.
We find it recorded that as early as seven or eight o’clock in the morning, the thermometer stood at 117° in the shade. At mid-day it sank to 109°, but in the afternoon it rose again, and at four o’clock was 113°. Monday last was about the hottest day of the present season ; yet the thermometer did not stand above 95° in the shade. Our readers who felt inconvenienced by the increase of heat between that and the usual 70° or 75° will have some difficulty in imagining the sensations produced by a still further rise of 20°. The intense heat of Black Thursday was not it’s only peculiarity. From early morning it was accompanied by a hot wind, almost of the strength of a hurricane, and throughout the day the surface of the country was exposed to the full power of it’s withering influence. Bush-fires raged across hundreds of miles of country, sweeping along with almost the rapidity of lightning, and destroying, nearly instantaneously, men, women, and children, crops and homesteads, fences and gardens, and vast quantities of cattle, sheep, horses, pigs, and fowls. From the whole land arose a cry of utter desolation.
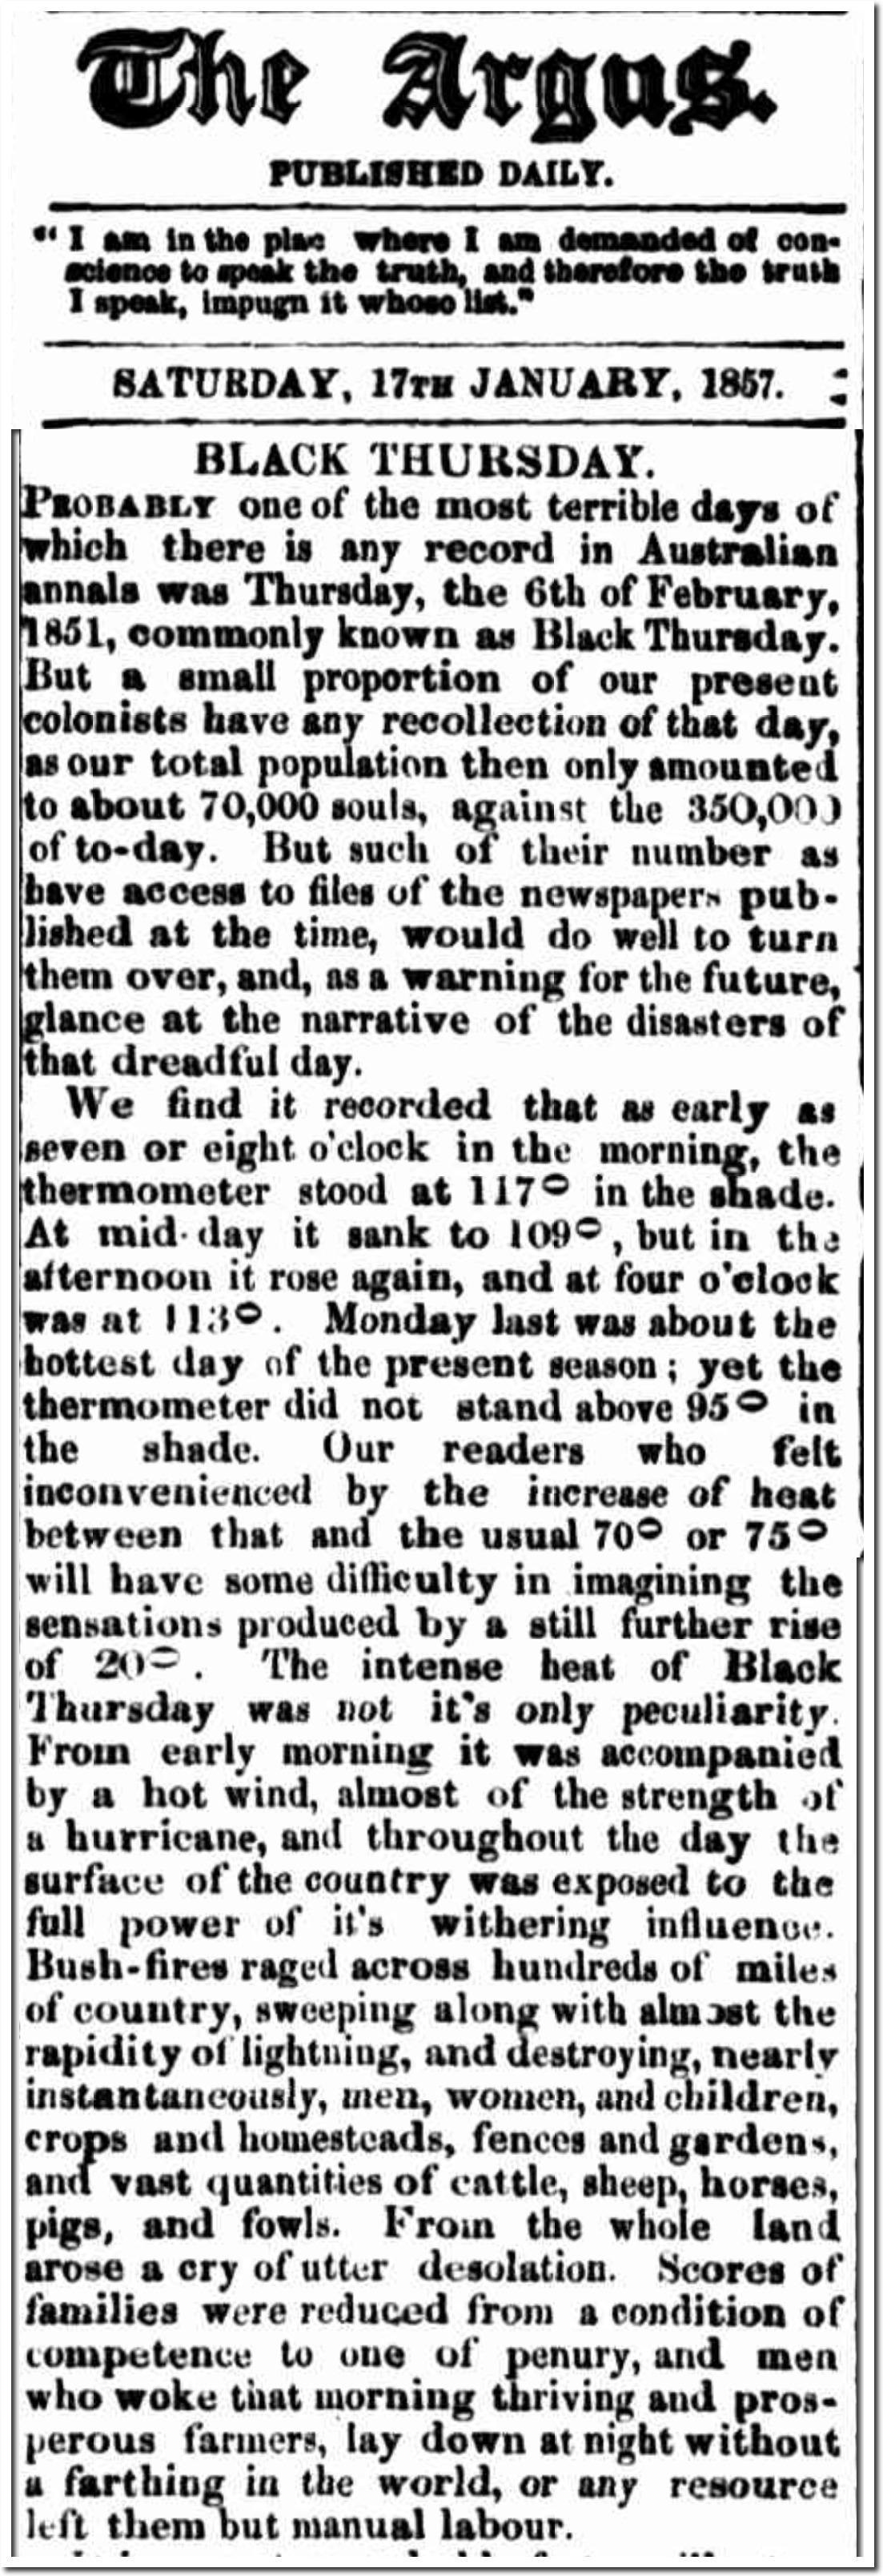
17 Jan 1857 – BLACK THURSDAY. – Trove
Superstitious people always imagined that the climate is changing.
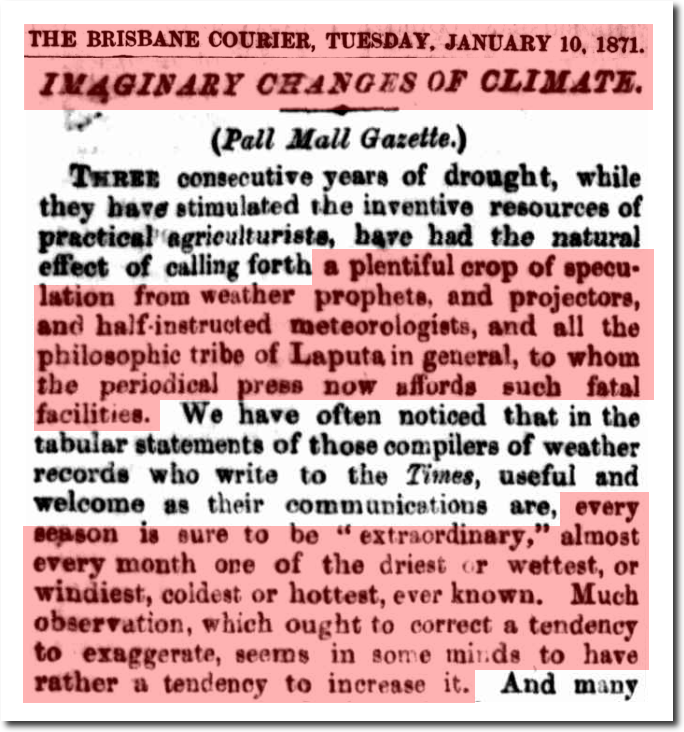
10 Jan 1871 – IMAGINARY CHANGES OF CLIMATE
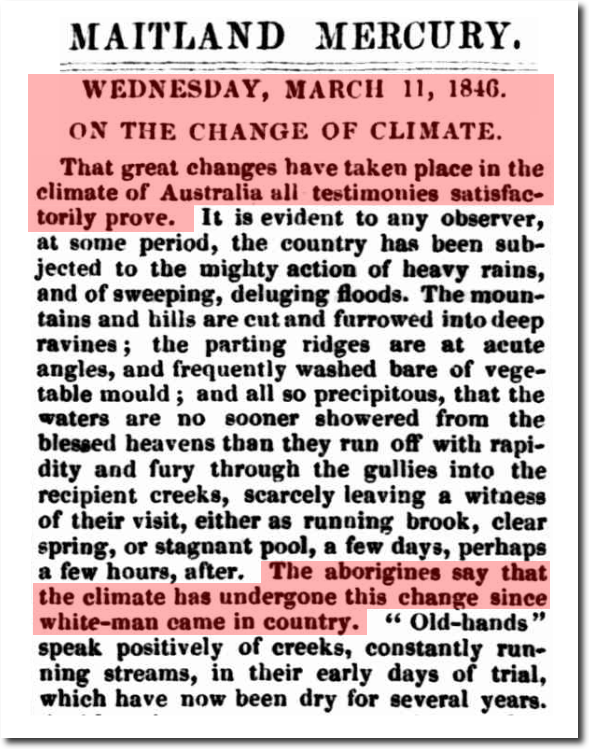
And blame for climate change has always been placed on white men.
Posted in Uncategorized
Leave a comment
YouTube TOU Change Coming
YouTube just sent me this automated message. With their TOU change coming on December 12, this message may prove to be helpful.
Posted in Uncategorized
Leave a comment