NASA prominently features this graph of “global temperature” showing very close agreement between different data sets by different government agencies since 1880.
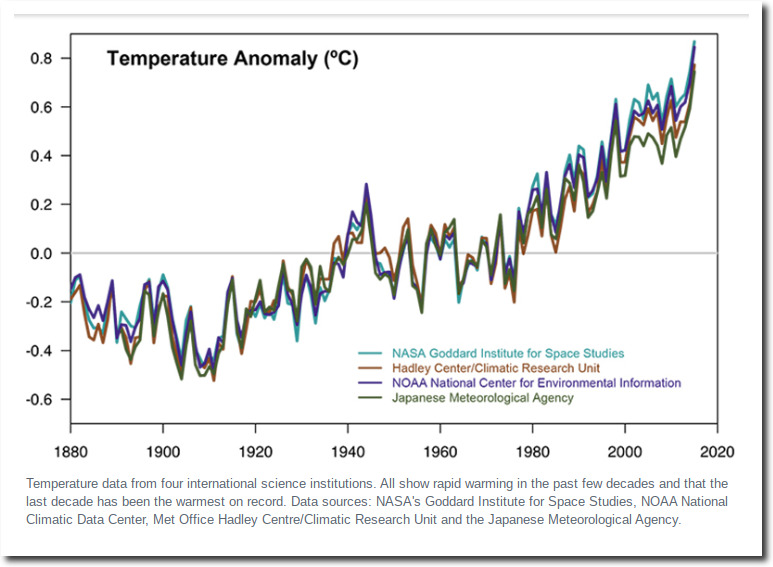
NASA: Climate Change and Global Warming
I am going to show you the evidence now why the only way this could have happened is via collusion between the agencies. There is not enough data available to generate a coherent global long-term temperature record, much less have close agreement by independent agencies.
In 1978, the New York Times reported there was too little temperature data from the Southern Hemisphere to draw any reliable conclusions.
International Team of Specialists Finds No End in Sight to 30?Year Cooling Trend in Northern Hemisphere
New York Times, January 5, 1978
The report, prepared by German, Japanese and American specialists, appears in the Dec. 15 issue of Nature, the British journal. The findings indicate that from 1950 to 1975 the cooling, per decade, of most climate indexes in the Northern Hemisphere was from 0.1 to 0.2 degrees Celsius, roughly 0.2 to 0.4 degrees Fahrenheit.
Data from the Southern Hemisphere, particularly south of latitude 30 south, are so meager that reliable conclusions are not possible, the report says. The 30th parallel of south latitude passes through South Africa, Chile and southern Australia. The cooling trend seems to?extend at least part way into the Southern Hemisphere but there have been indications of warming at high southern latitudes.
https://www.nytimes.com/1978/01/05/archives/international-team-of-specialists-finds-no-end-in-sight-to-30year.html
In 1981, NASA’s James Hansen reported the same thing. There is little historical data from the Southern Hemisphere and oceans.
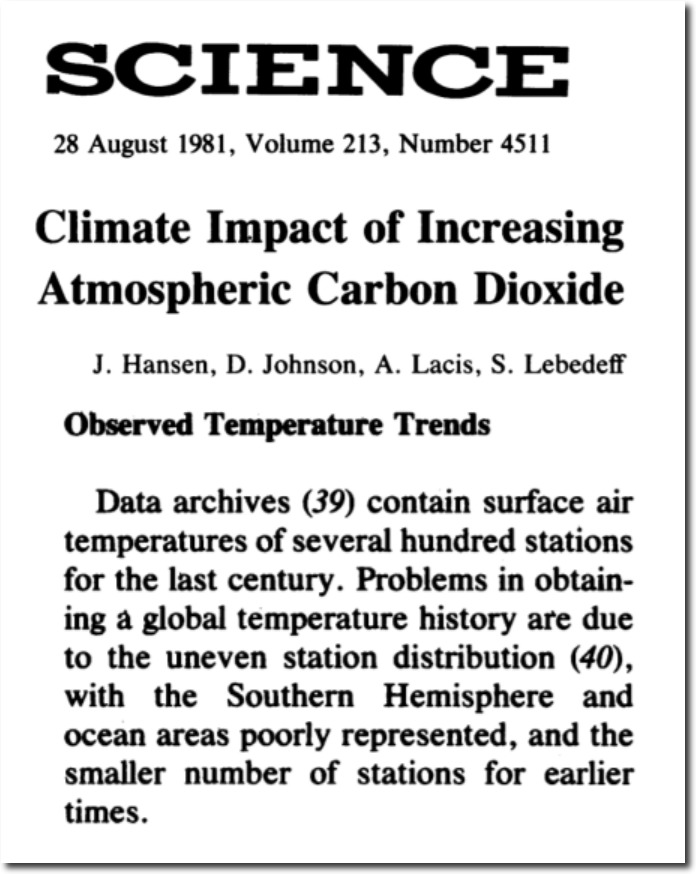
Climate Impact of Increasing Atmospheric Carbon Dioxide | Science
In this 2009 Climategate E-mail, Phil Jones from CRU said there was very little ship data in large areas of the Southern Hemisphere. and that the historical data in those regions was “mostly made up.”
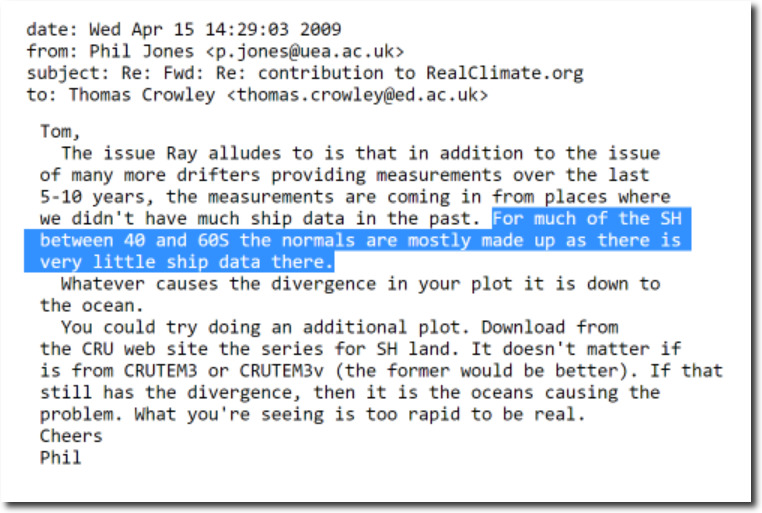
di2.nu/foia/foia2011/mail/2729.txt
Maps from NOAA show that there was very little quality thermometer data outside of the US in the year 1900.
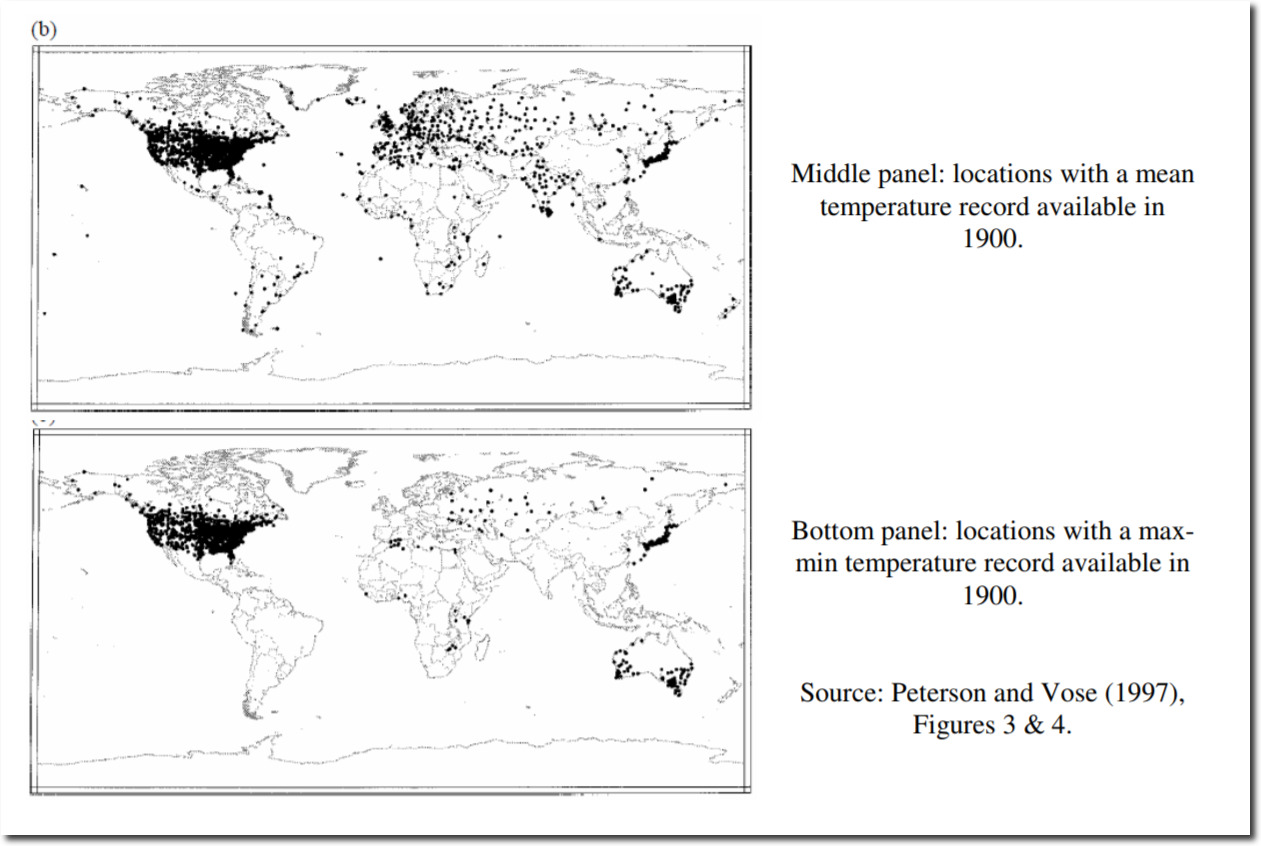
A Critical Review of Global Surface Temperature Data Products by Ross McKitrick :: SSRN
Same story in 1920. Very little quality data outside of the US, Western Europe, Japan and parts of Australia.
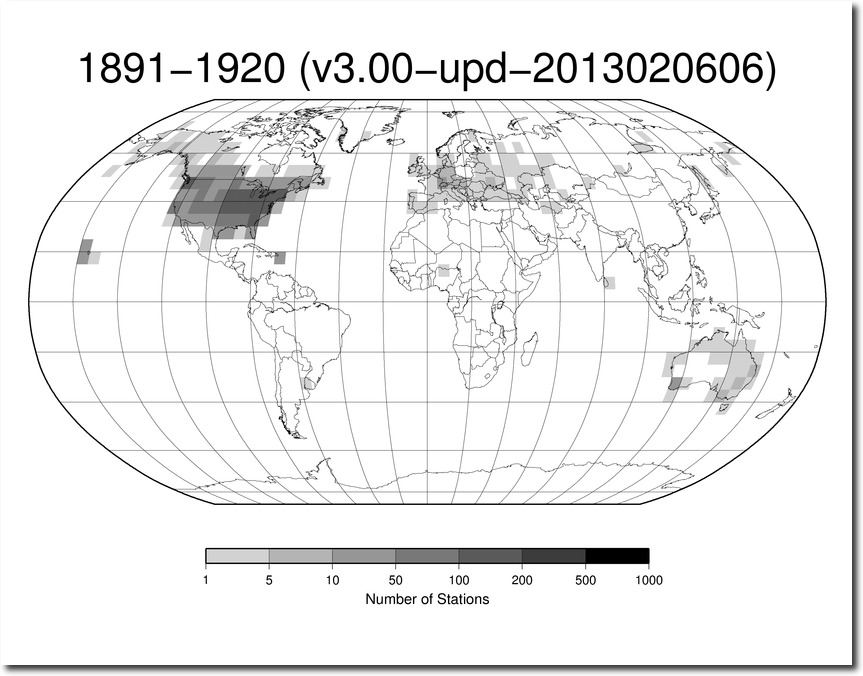
station-counts-1891-1920-temp.png (825×638)
There are still very large areas of missing data, represented by gray in the NOAA map below.
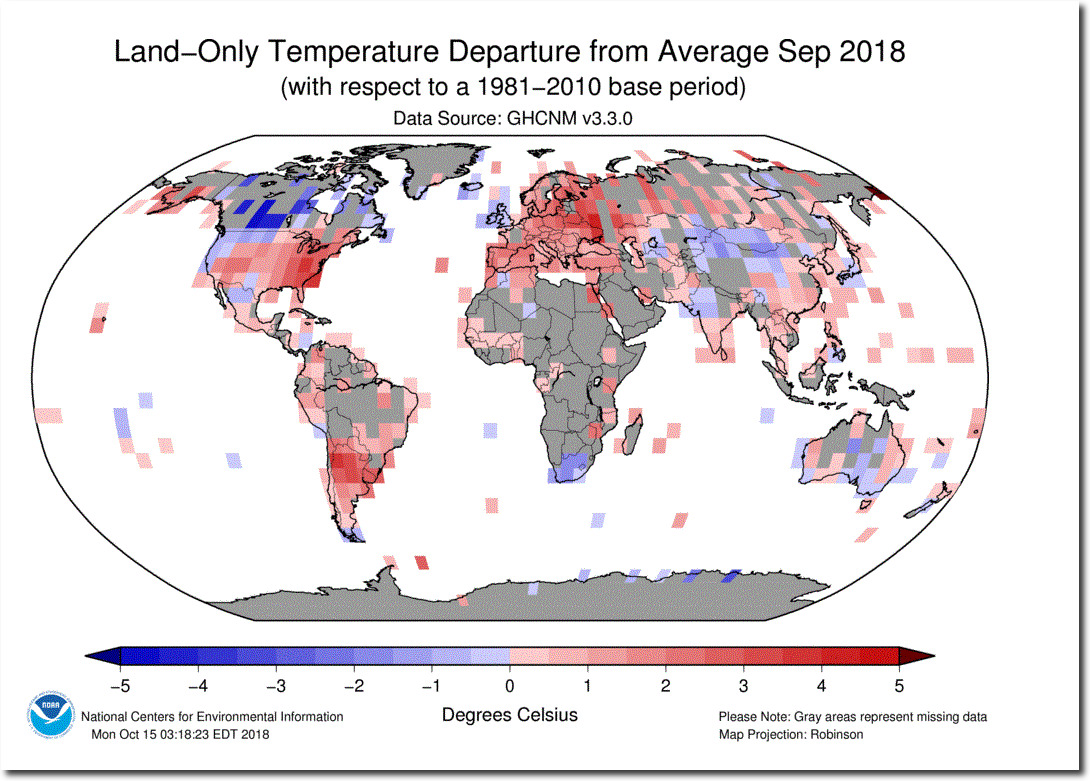
201809.gif (1052×743)
However, the lack of data doesn’t stop NOAA from declaring record heat in places with no thermometer data.
Fake Data – The Basis Of Climate Science | The Deplorable Climate Science Blog
The US has the only high quality long term temperature set covering a large area in the world, and the US temperature record is massively tampered with – to turn 90 years of cooling into warming.
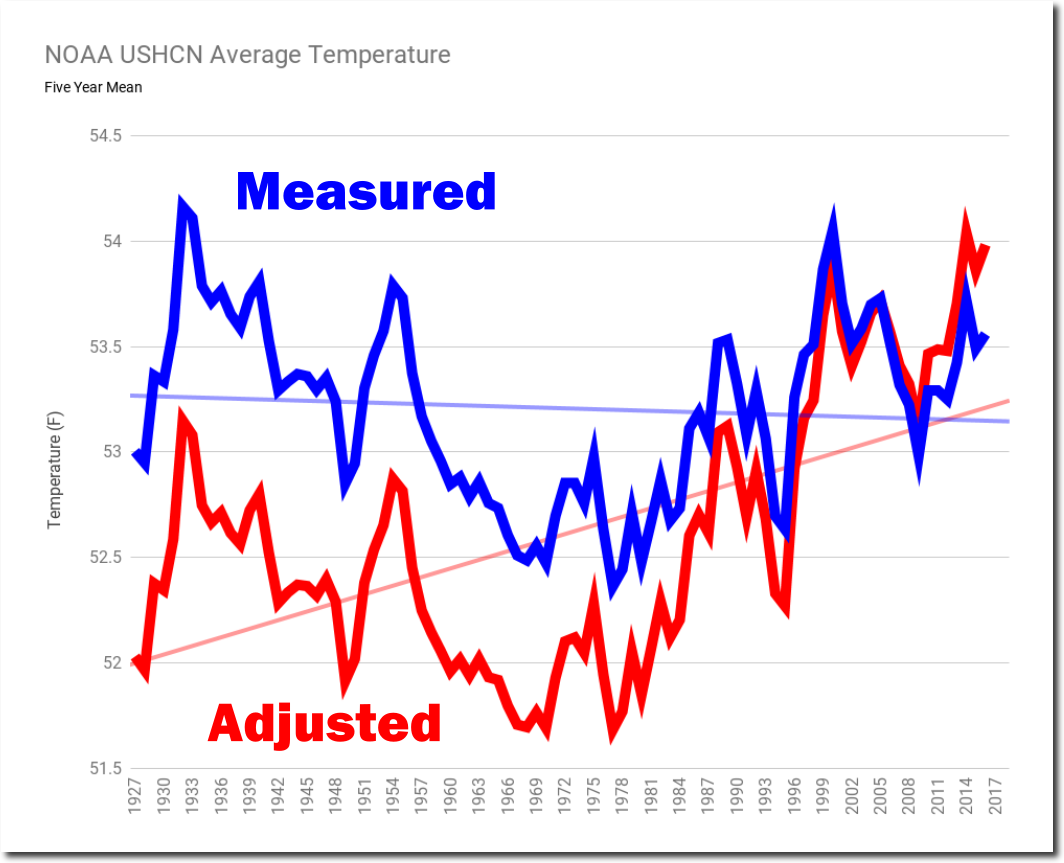
NOAA US Data Tampering Update | The Deplorable Climate Science Blog
No legitimate scientist would alter data like this. If they have theories about possible issues with the data, the correct way to handle it is to put error bars on the graph – not alter the data and present it as if it is the actual thermometer data. That is fraud, not science. Between 1999 and 2016, NASA completely altered the shape of the US temperature graph to turn seventy years of cooling into warming.
NASA 1999 NASA 2016
As far as global temperatures go, NASA has massively altered their own surface temperature record over the past 20 years, and have doubled pre-2000 warming. How can four different independent agencies come up with four very similar graphs, when NASA doesn’t even agree with themselves from 20 years ago?
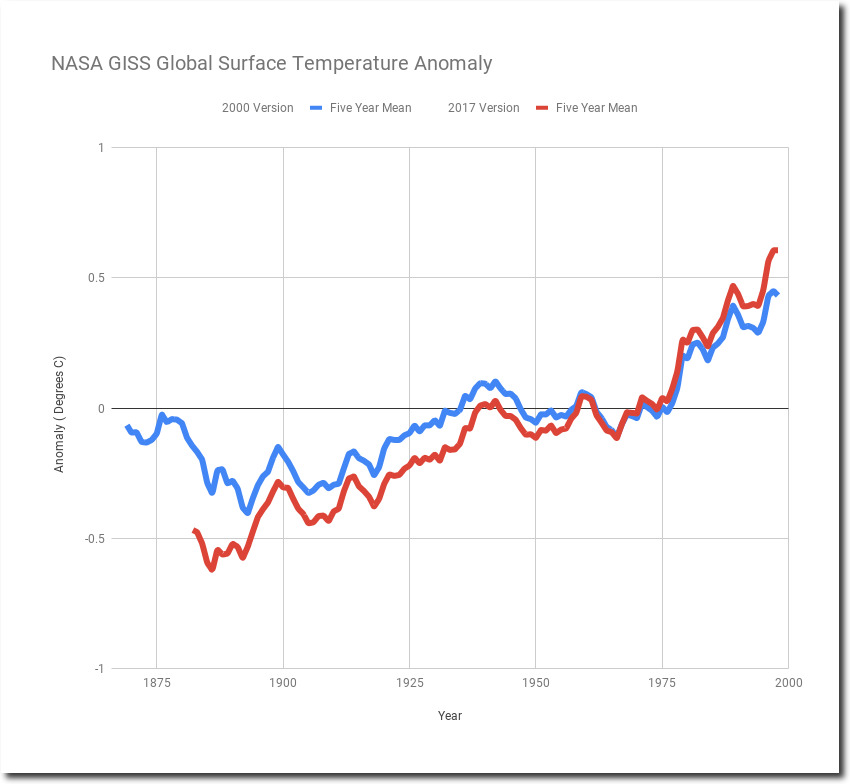
Spreadsheet Data
NASA surface temperature graphs have completely erased the post-1940 cooling seen in 1974 NCAR graphs.
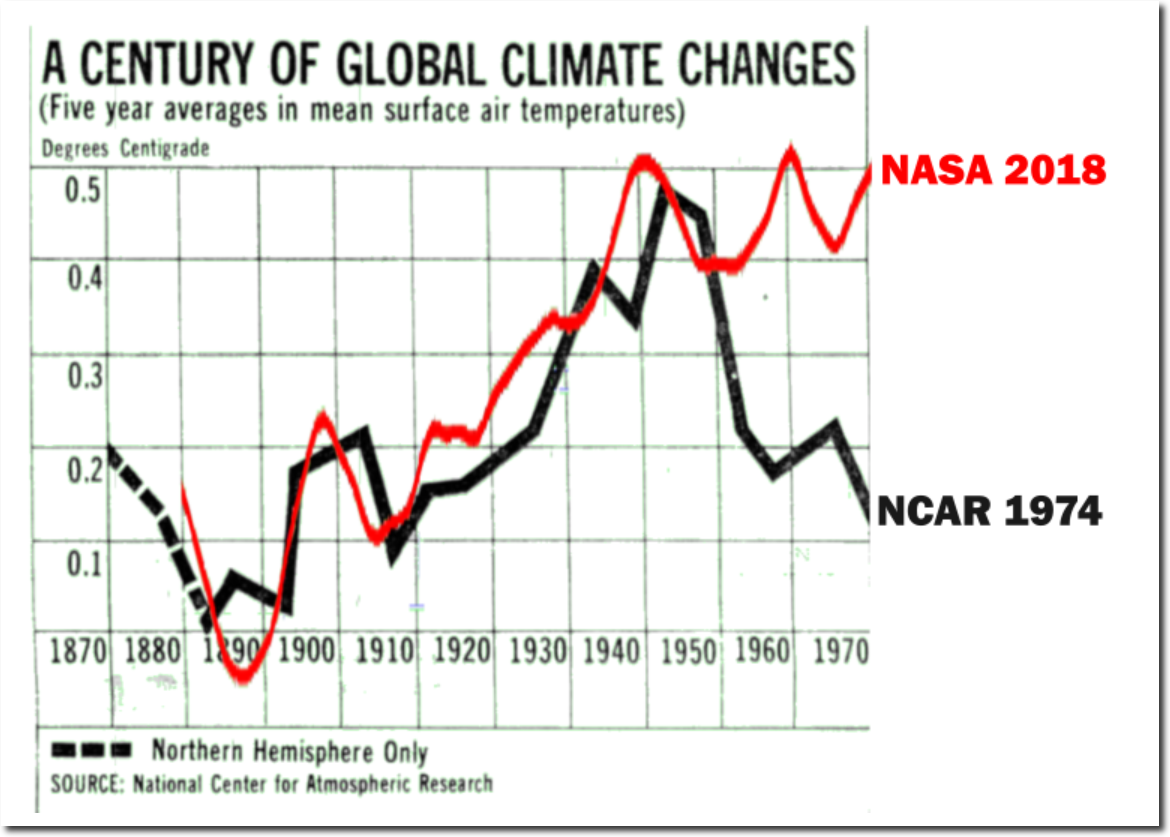
NCAR 1974 NASA 2018
This removal of the “1940’s blip” was done intentionally. Climate scientists openly discussed their desire to get rid of the 1940s warmth.

di2.nu/foia/1254108338.txt
But historical records show that the time around the 1940 was very warm – with glaciers rapidly melting in Greenland, North America and Europe.

17 Dec 1939, Page 15 – Harrisburg Sunday Courier
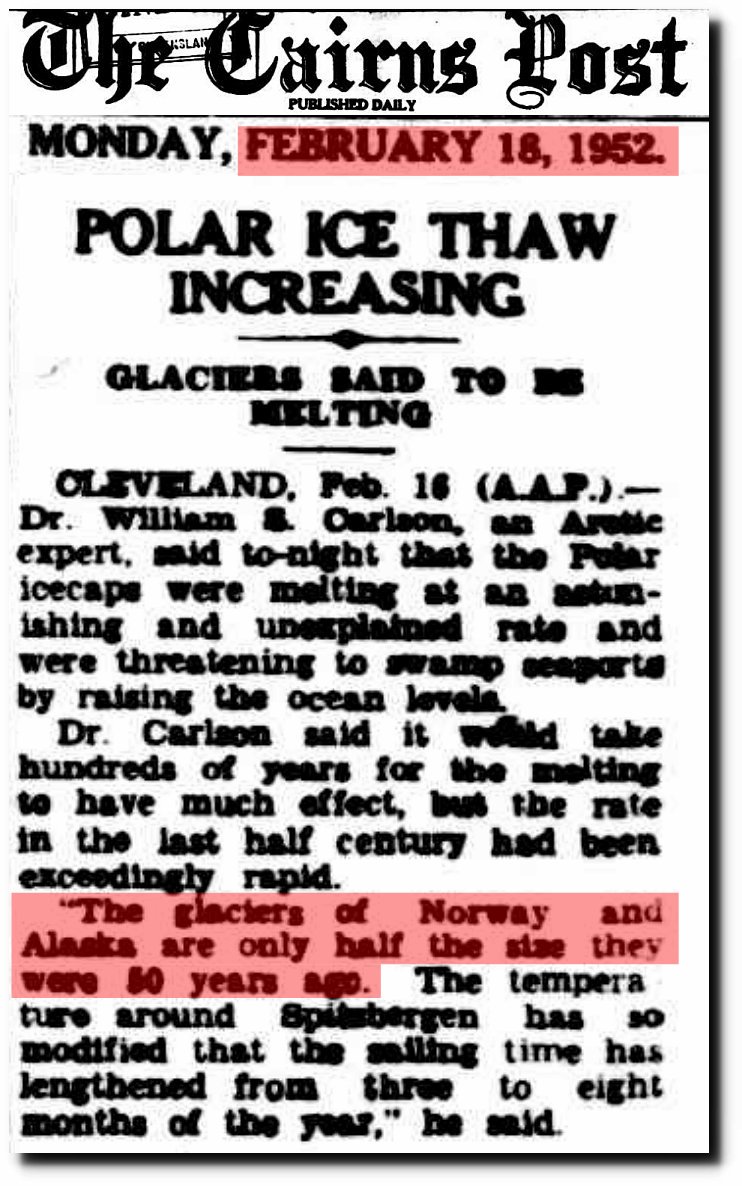
18 Feb 1952 – POLAR ICE THAW INCREASING
This warmth of the 1930s and 1940s, turned rapidly into cooling – which has been largely erased in current NASA temperature graphs.

January 30, 1961 – NYTimes
U.S. and Soviet Press Studies of a Colder Arctic – The New York Times
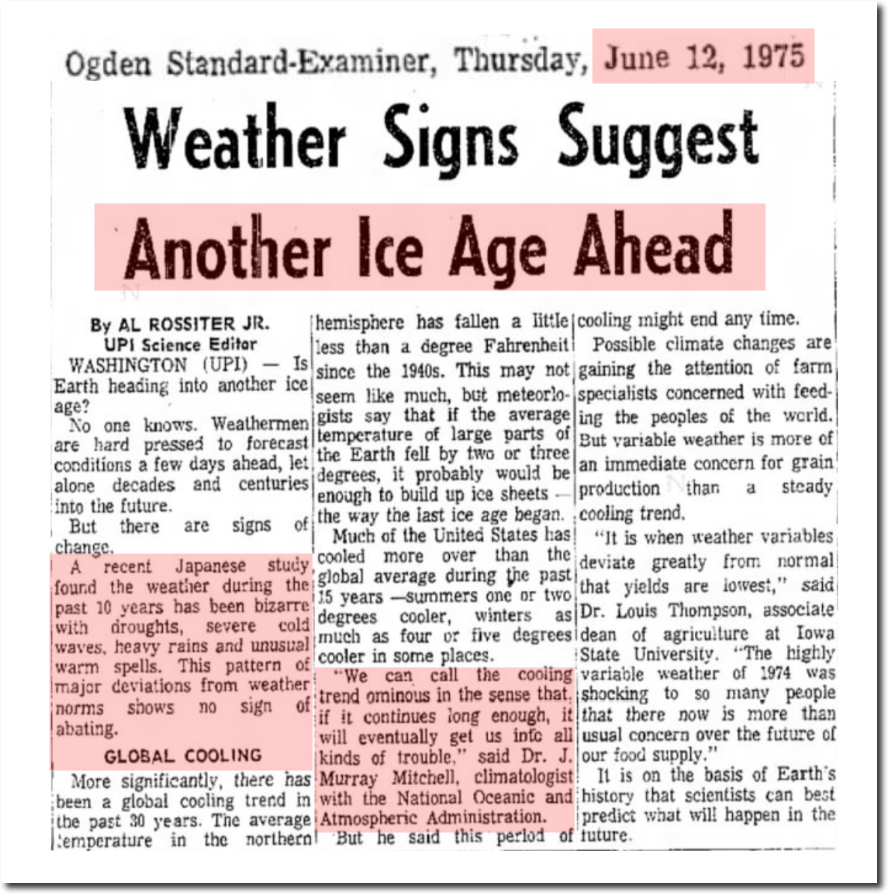
12 Jun 1975, Page 10 – The Ogden Standard-Examiner at Newspapers.com
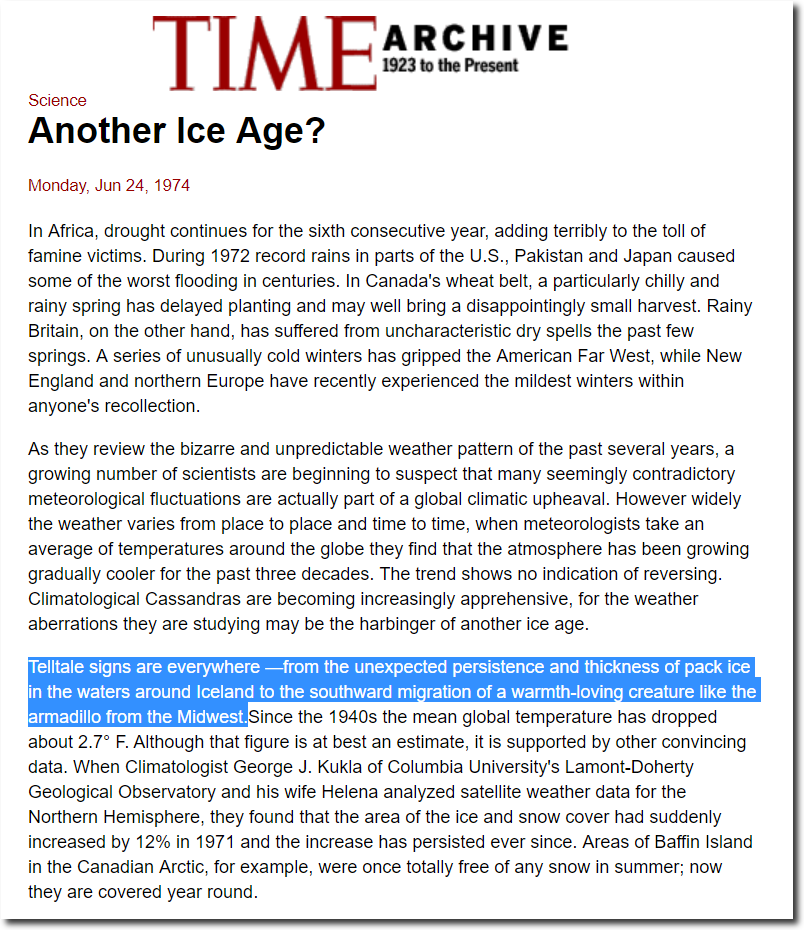
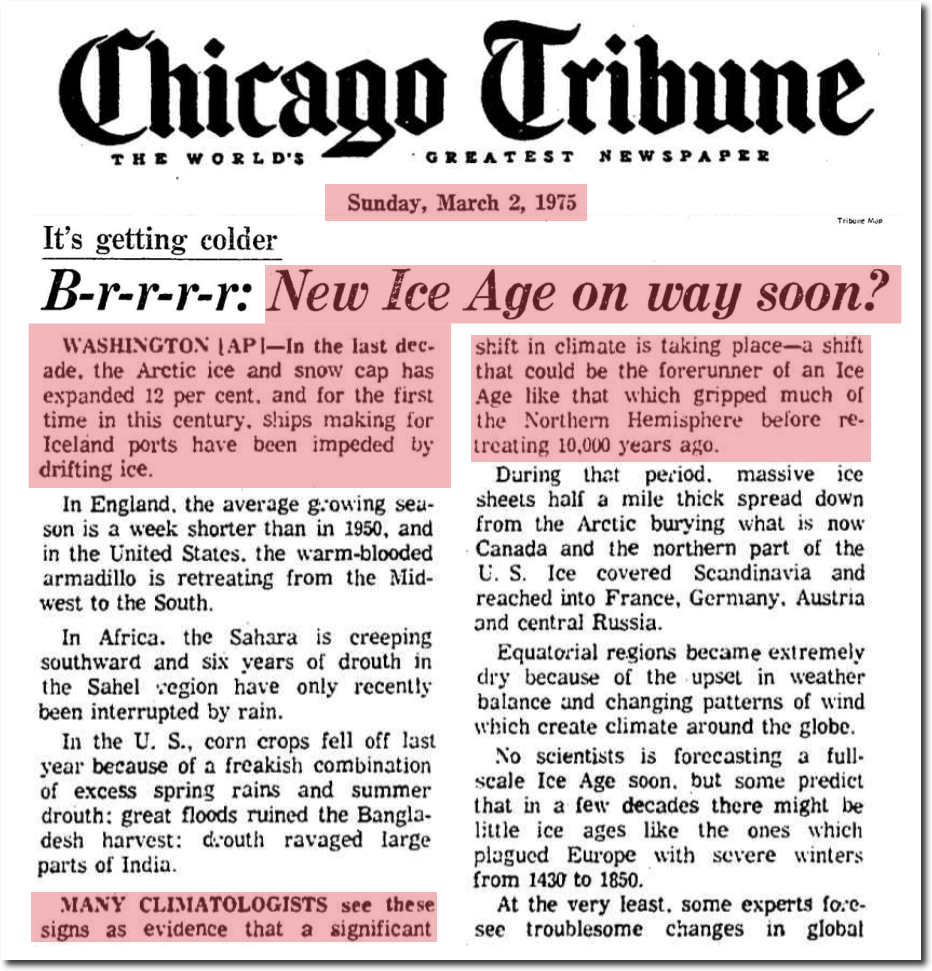
TIME Magazine Archive Article — Another Ice Age? — Jun. 24, 1974
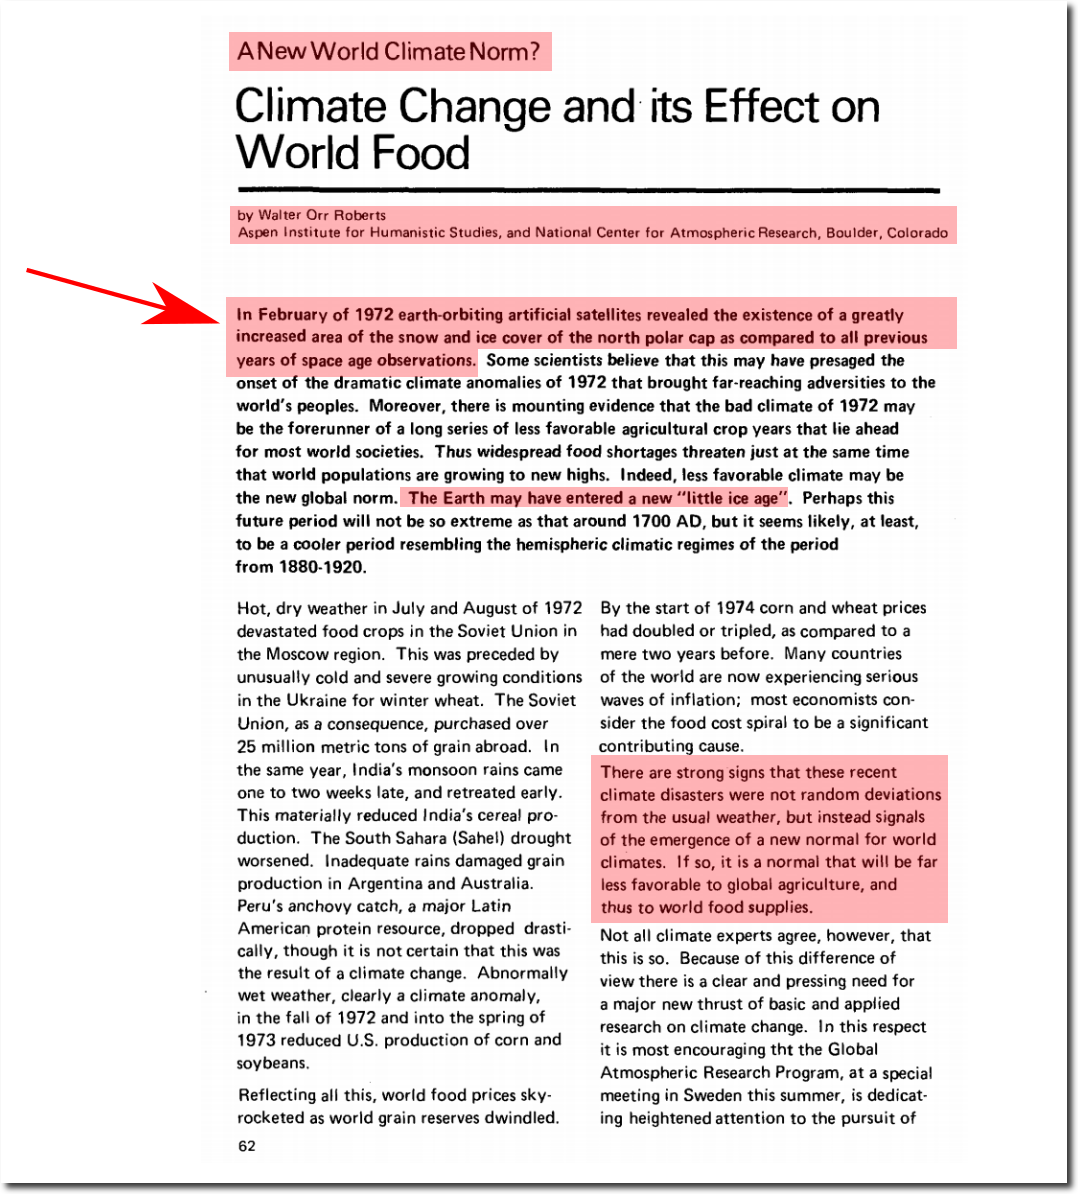
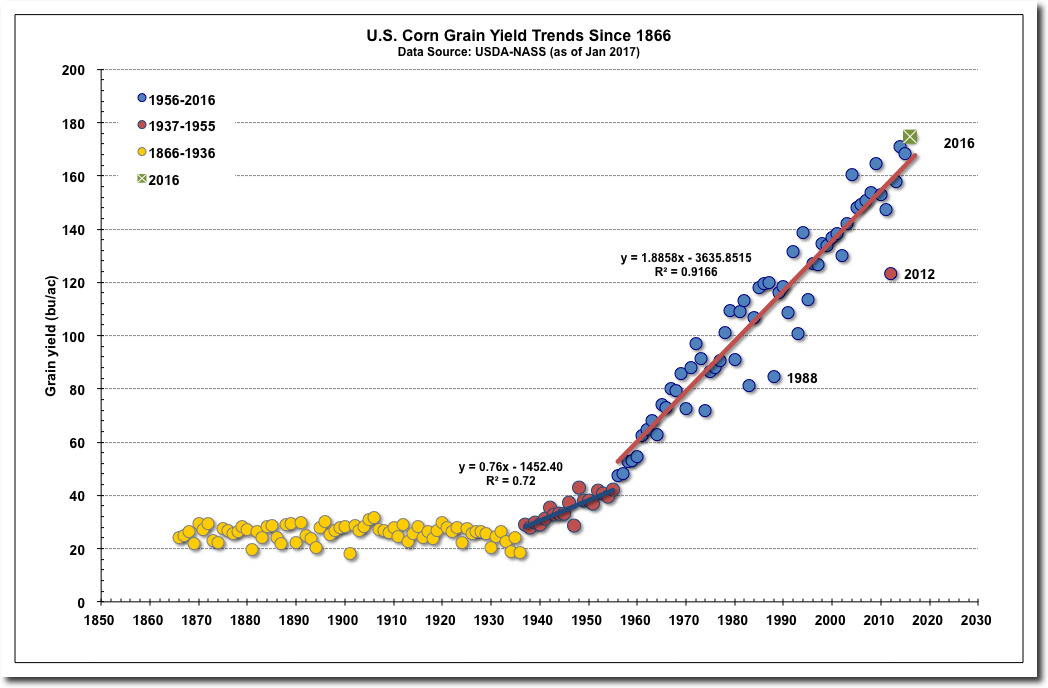
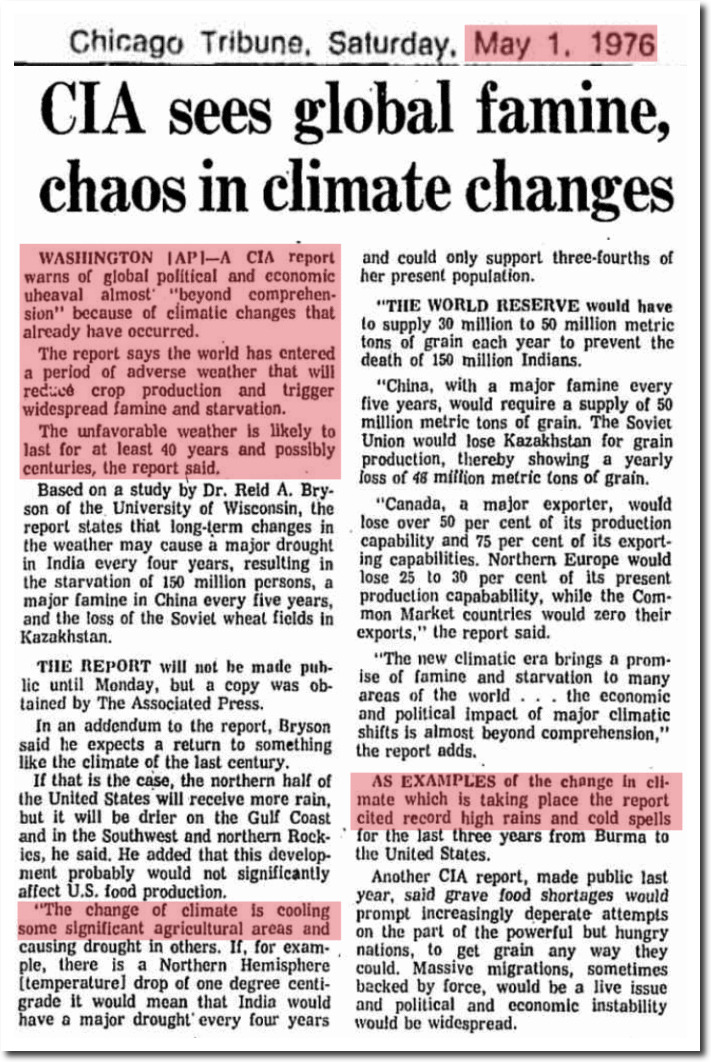
A recent meeting of climate experts in Bonn, West Germany, produced the unanimous conclusion that the change in global weather patterns poses a severe threat to agriculture that could lead to major crop failures and mass starvation.
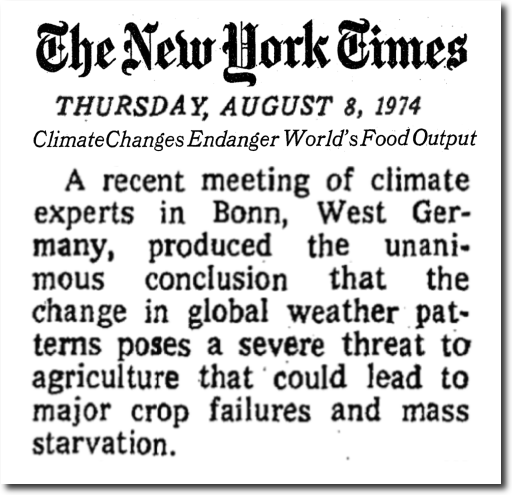
Climate Changes Endanger World’s Food Output – The New York Times
Wayback Machine
12 Jun 1974, Page 20 – at Newspapers.com
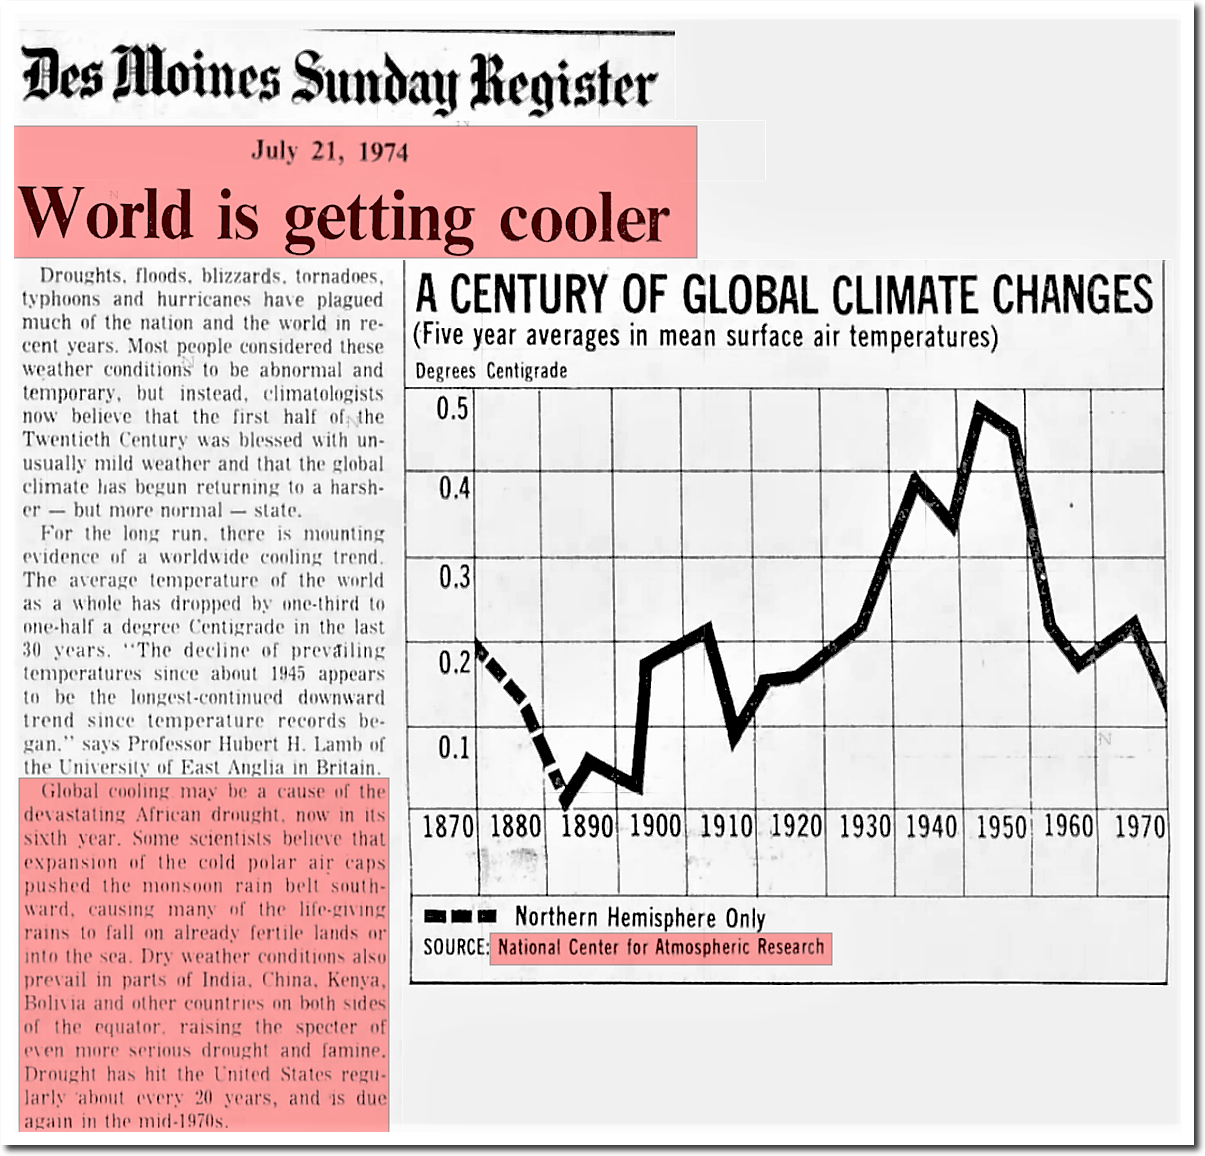
21 Jul 1974, 13 – The Des Moines Register at Newspapers.com
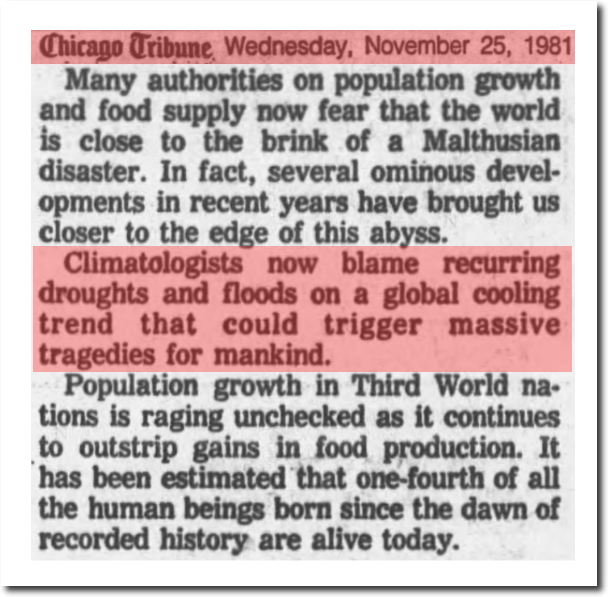
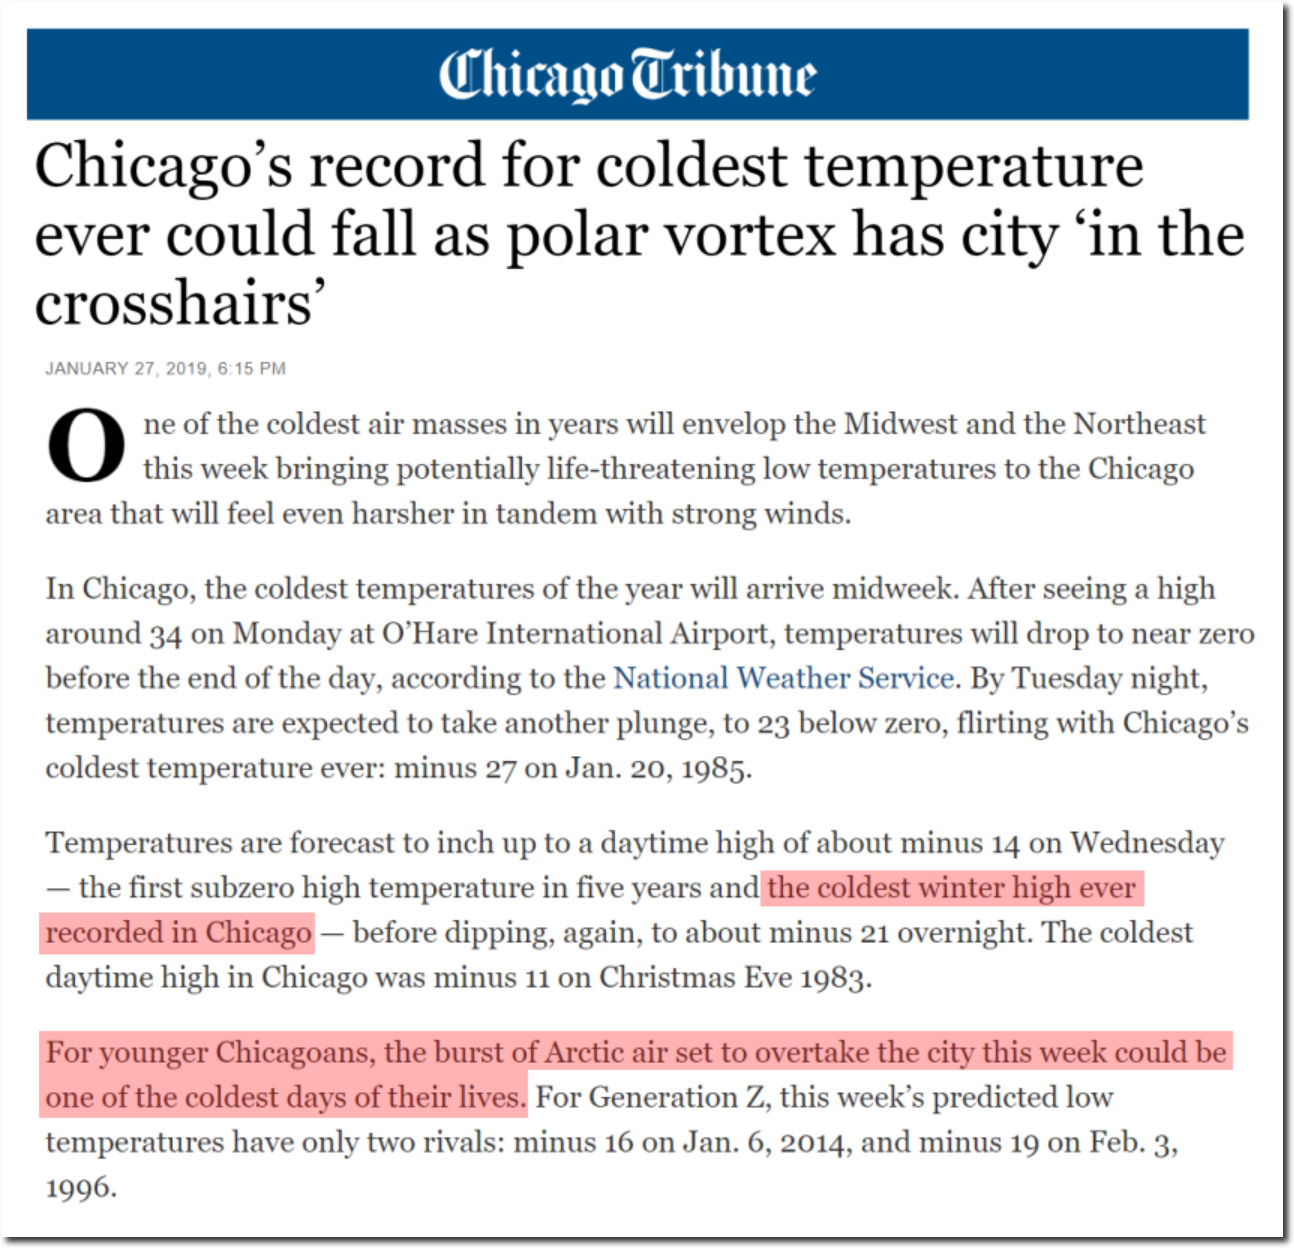
25 Nov 1981, 13 – Chicago Tribune at Newspapers.com
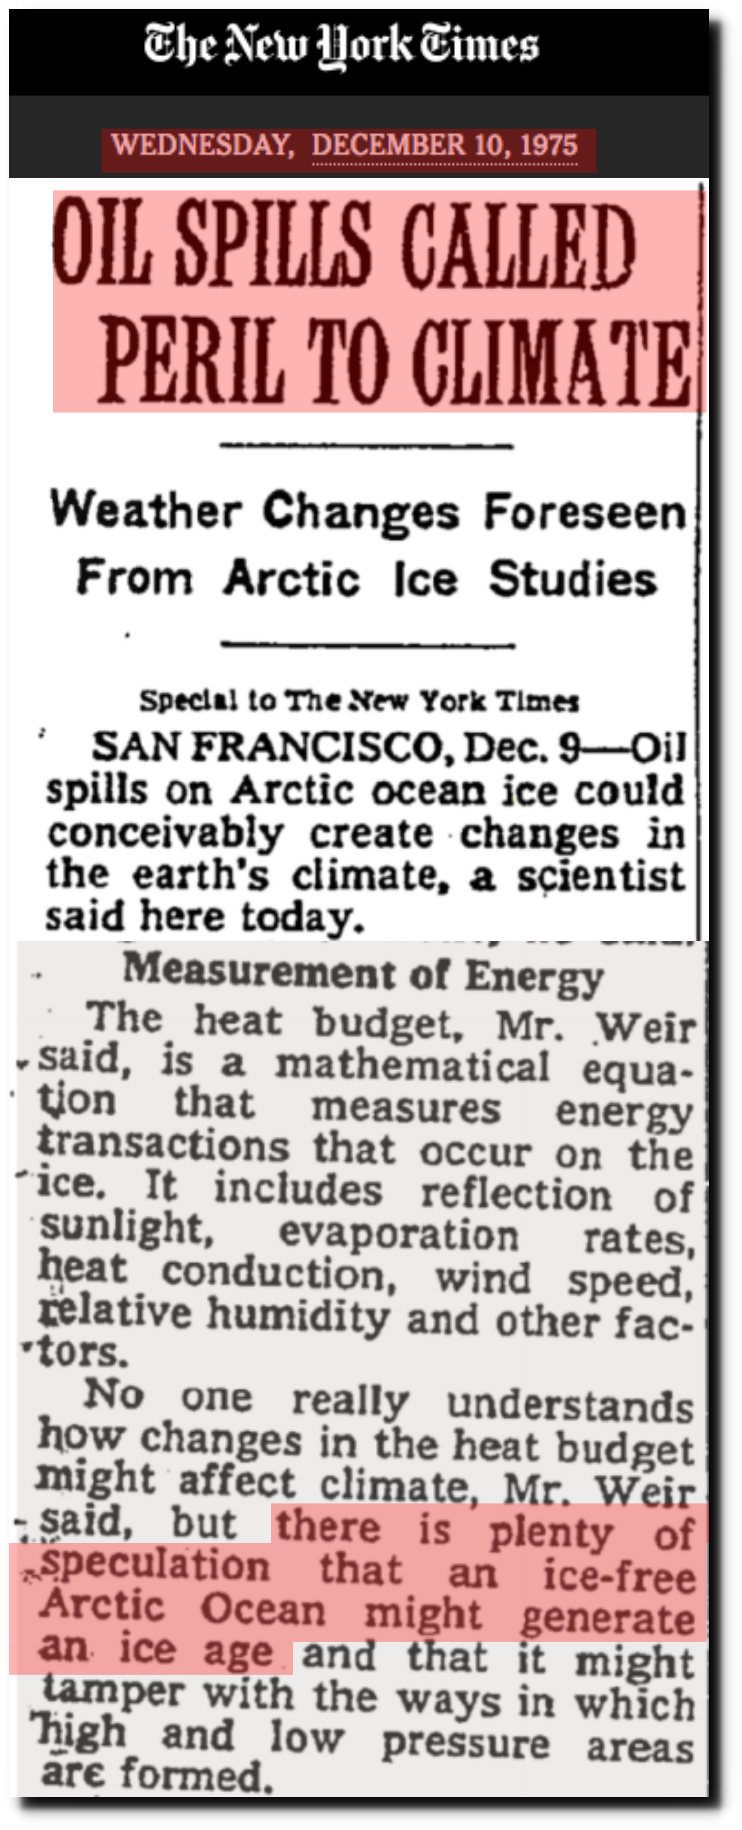
OIL SPILLS CALLED PERIL TO CLIMATE – The New York Times
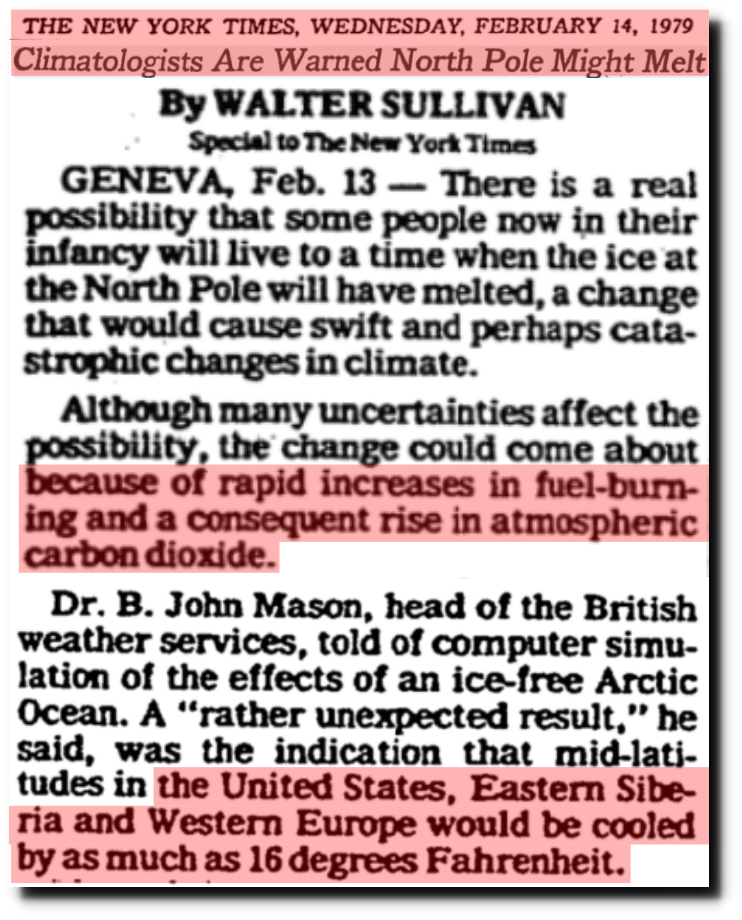
Climatologists Are Warned North Pole Might Melt – The New York Times
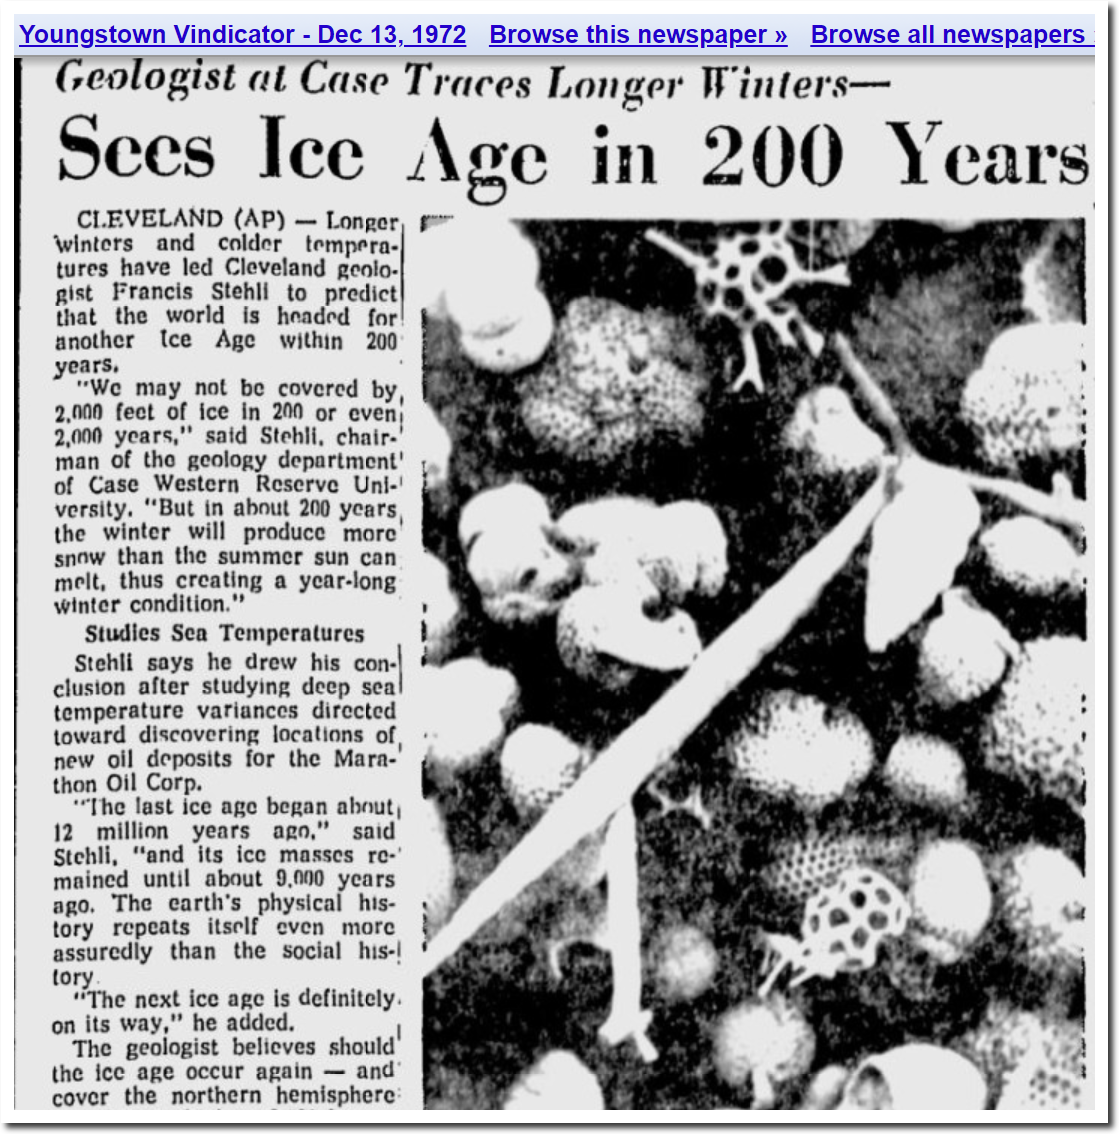
Youngstown Vindicator – Google News Archive Search
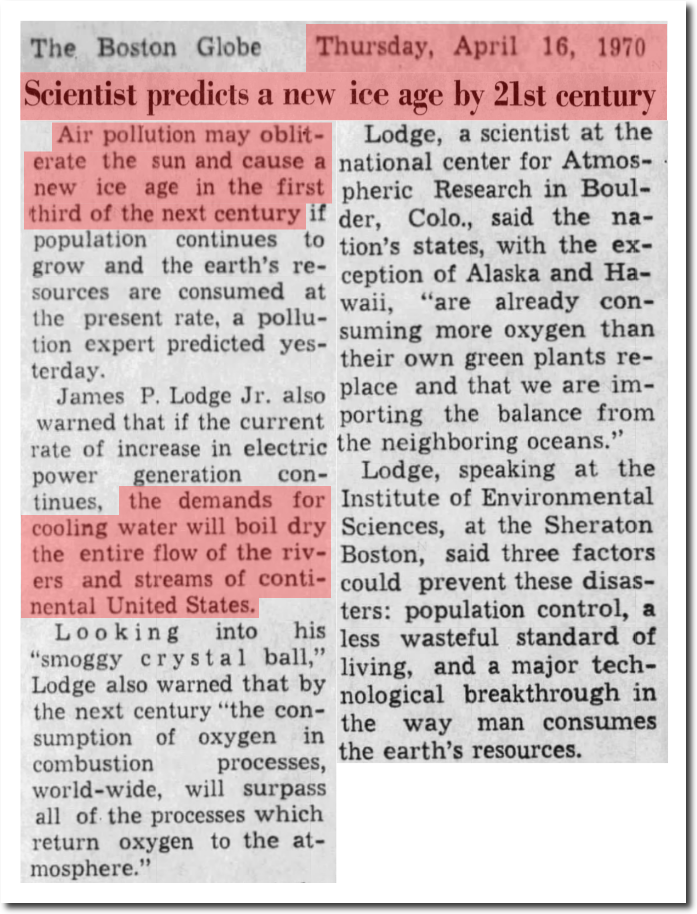
16 Apr 1970, 18 – The Boston Globe at Newspapers.com
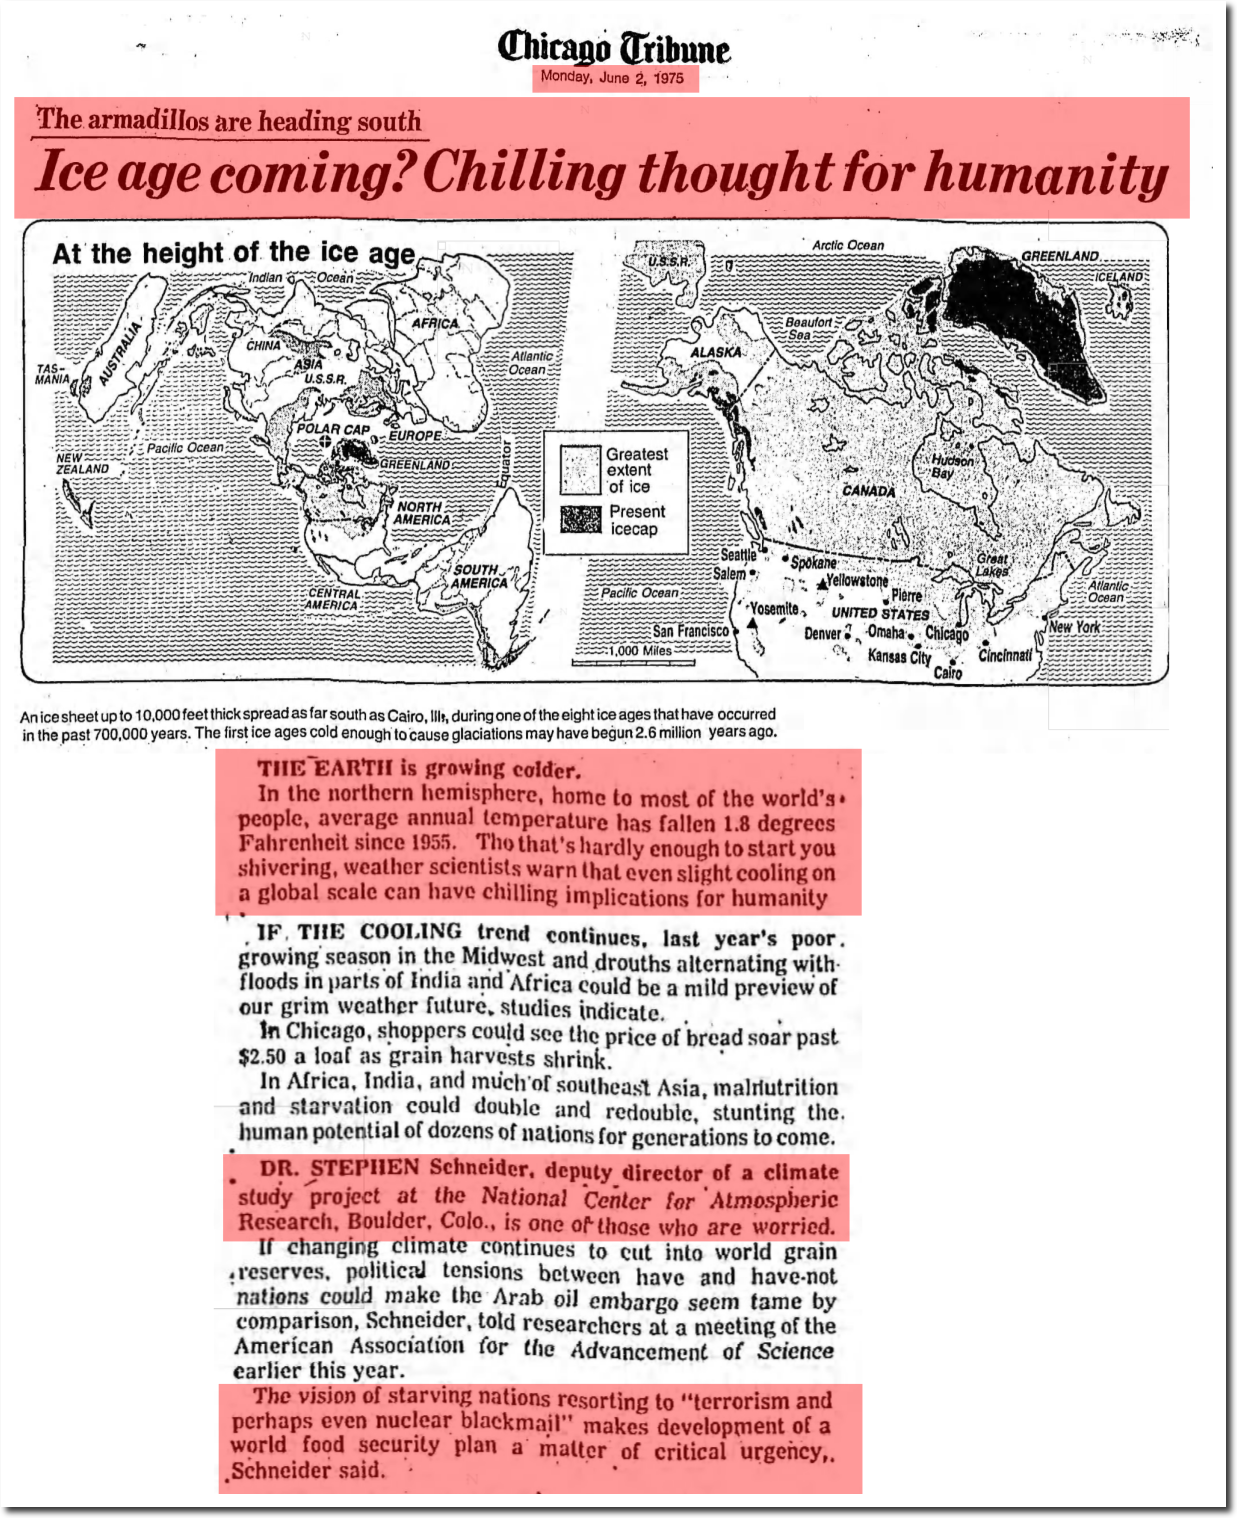
02 Jun 1975, Page 76 – Chicago Tribune at Newspapers.com
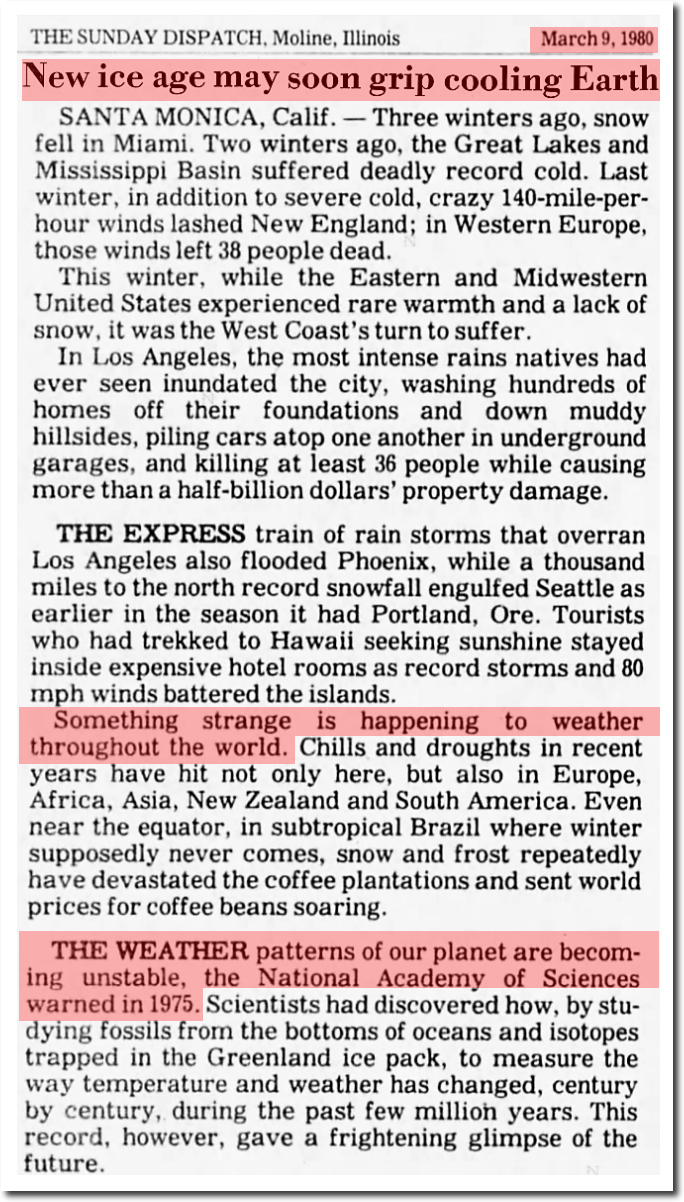
09 Mar 1980, 4 – The Dispatch at Newspapers.com
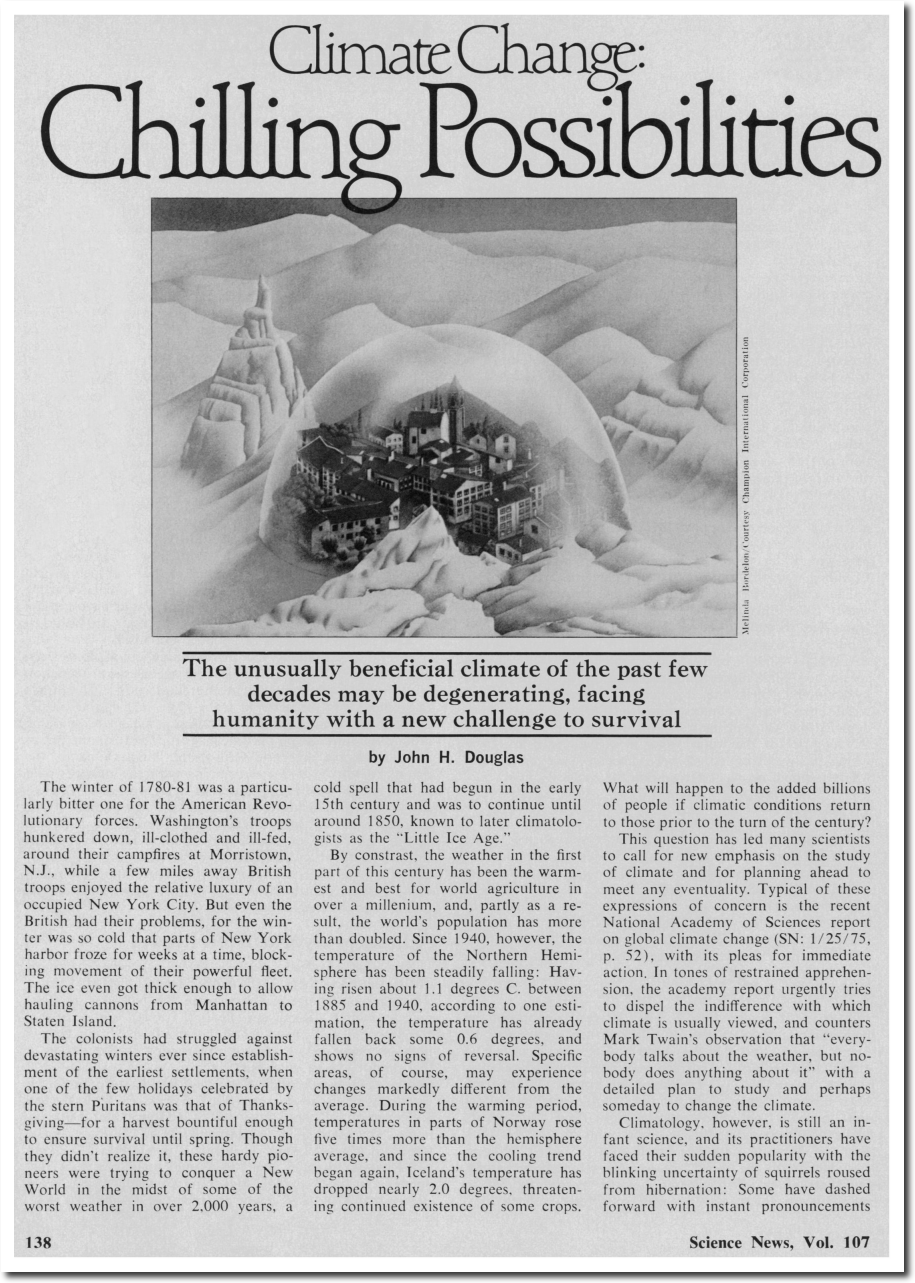
https://www.sciencenews.org/sites/default/files/8983
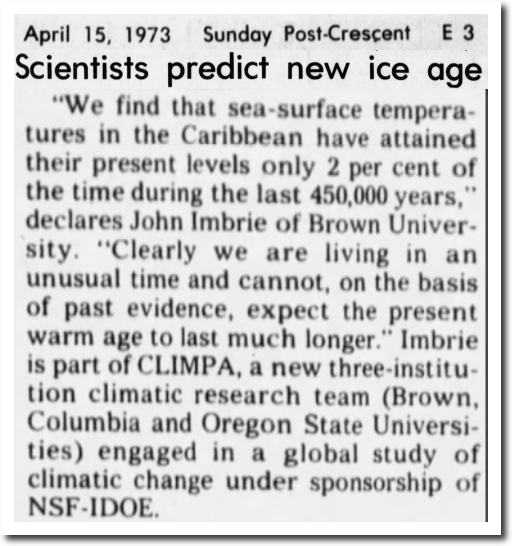
15 Apr 1973, 59 – The Post-Crescent at Newspapers.com
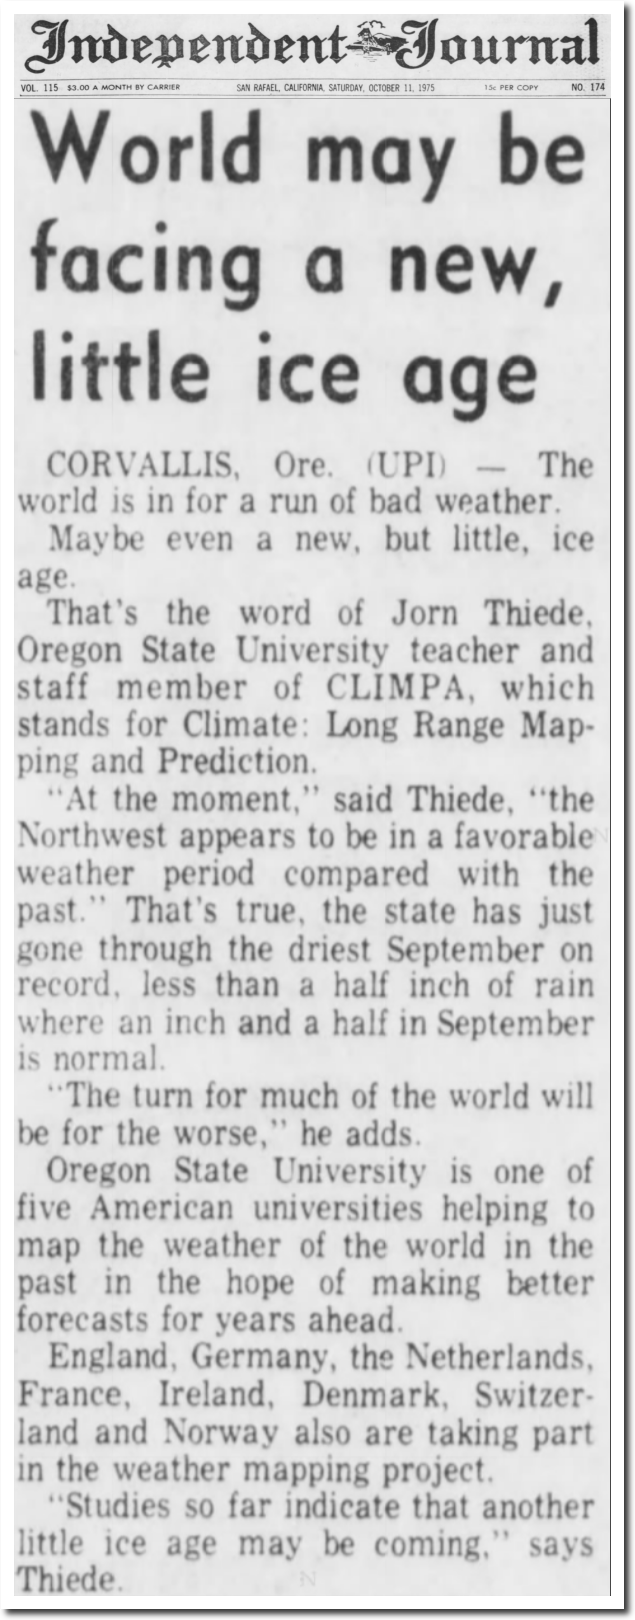
11 Oct 1975, Page 41 – Daily Independent Journal at Newspapers.com

14 Apr 1973, Page 8 – Iowa City Press-Citizen
THE ROLE OF NOAA’S CLIMATE PREDICTION CENTER IN THE DEVELOPMENT OF CLIMATE SERVICES
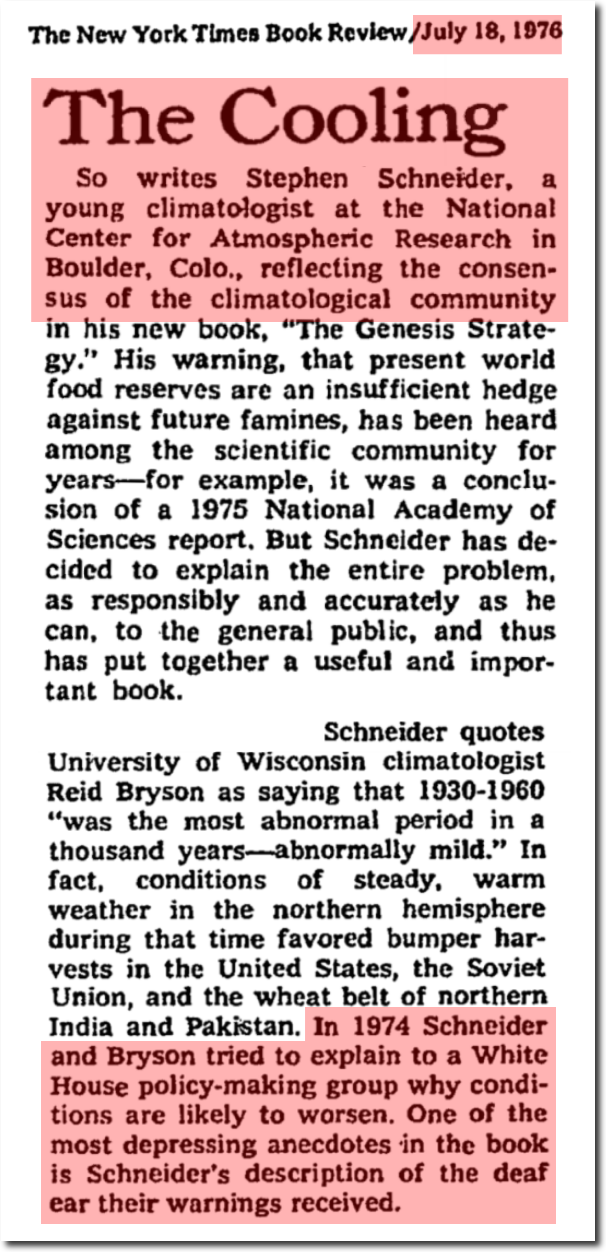
The Genesis Strategy – The New York Times
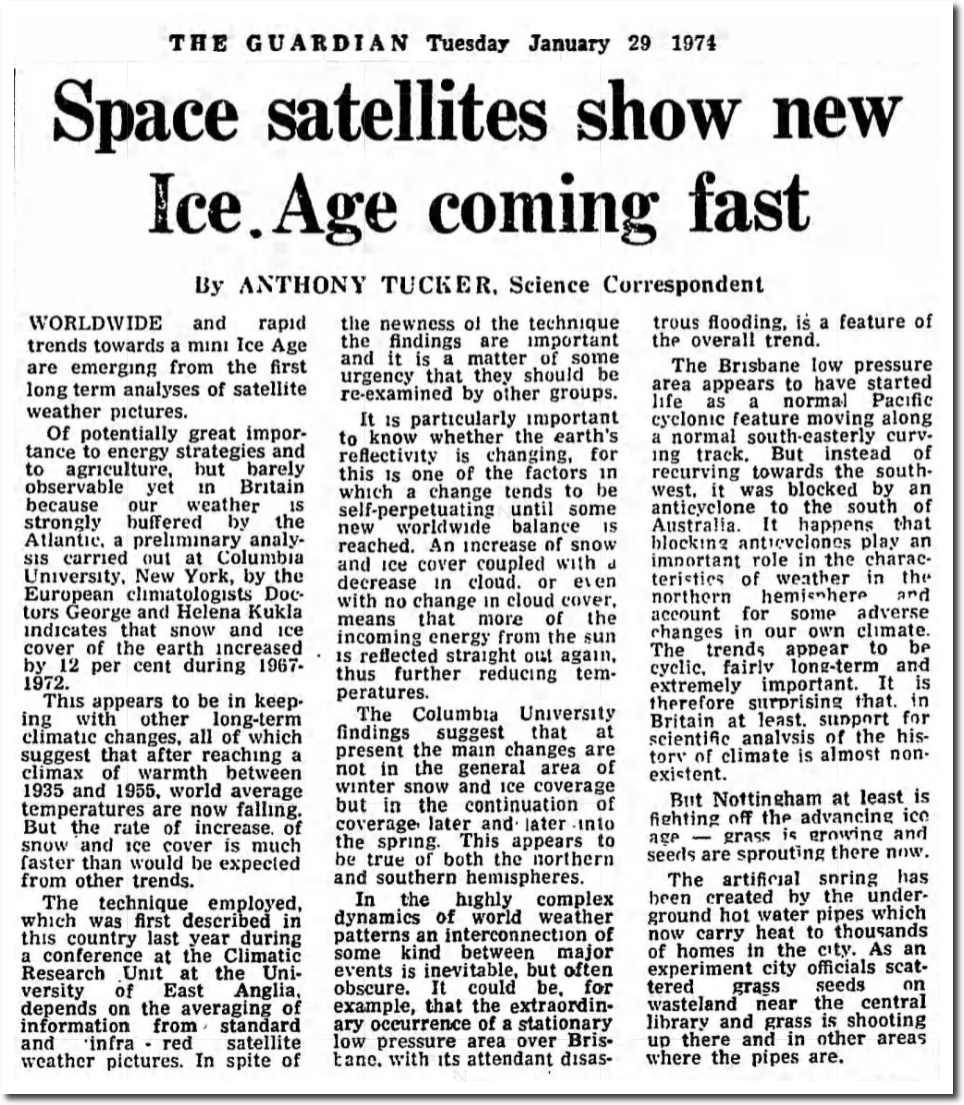
29 Jan 1974, 5 – The Guardian at Newspapers.com
The National Geographic Archive | November 1976 | page 1
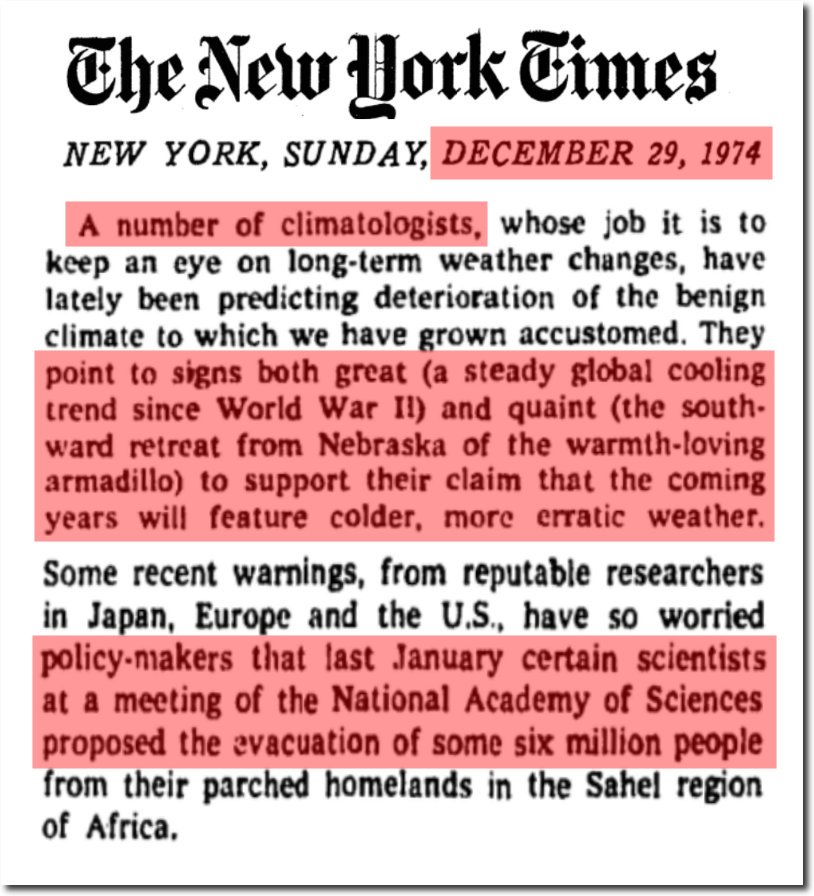
TimesMachine: December 29, 1974 – NYTimes.com
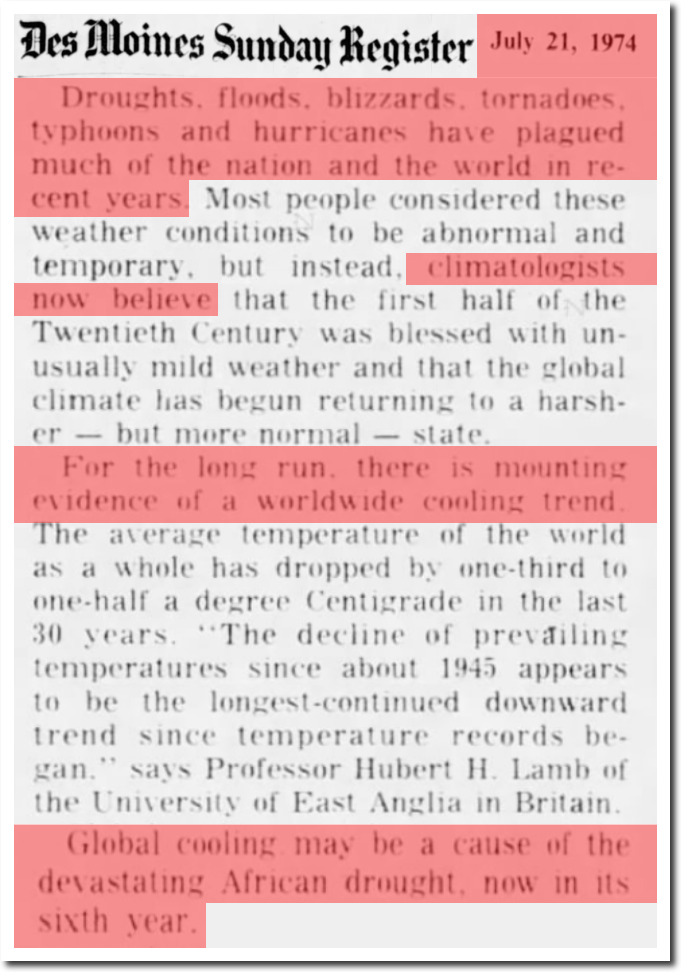
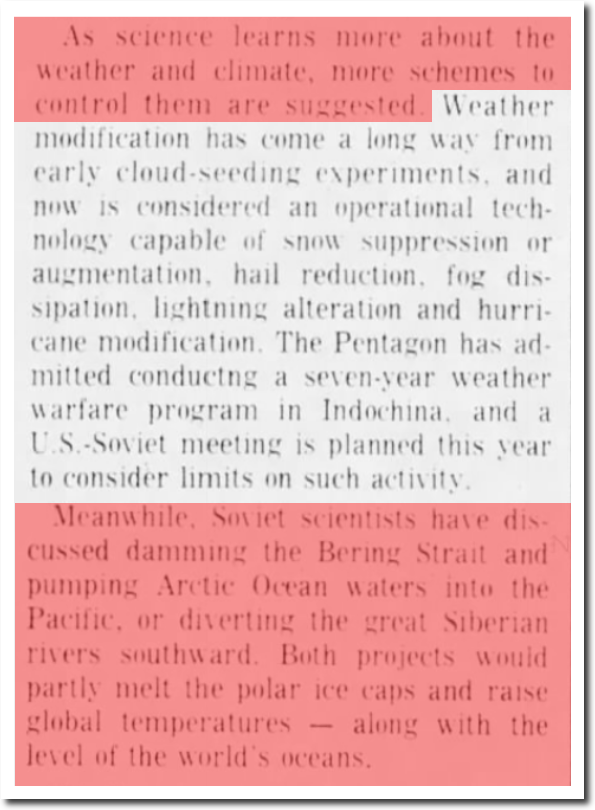
21 Jul 1974, 13 – The Des Moines Register at Newspapers.com
?www.denisdutton.com/newsweek_coolingworld.pdf
I’ve worked with global temperature data, and know that you can produce any shaped global temperature graph you want by picking the right set of stations. There are grossly inadequate amounts of both historical and current data to produce a meaningful long term temperature graph for the earth. Much of the data is fake – by their own admission.
The best temperature data set (by far) is the US data, which has been altered by NOAA and NASA over the past 20 years to turn 90 years of cooling in to warming. Global temperatures have also been massively altered over the past 45 years. And climate scientists colluded to remove the 1940s blip.
There is no conceivable way this graph could have been produced without lots of collusion between the four “independent” agencies.


