Prior to sixty years ago, September was a very hot month in the US. The average maximum September temperature has plummeted, as has the frequency of hot days.
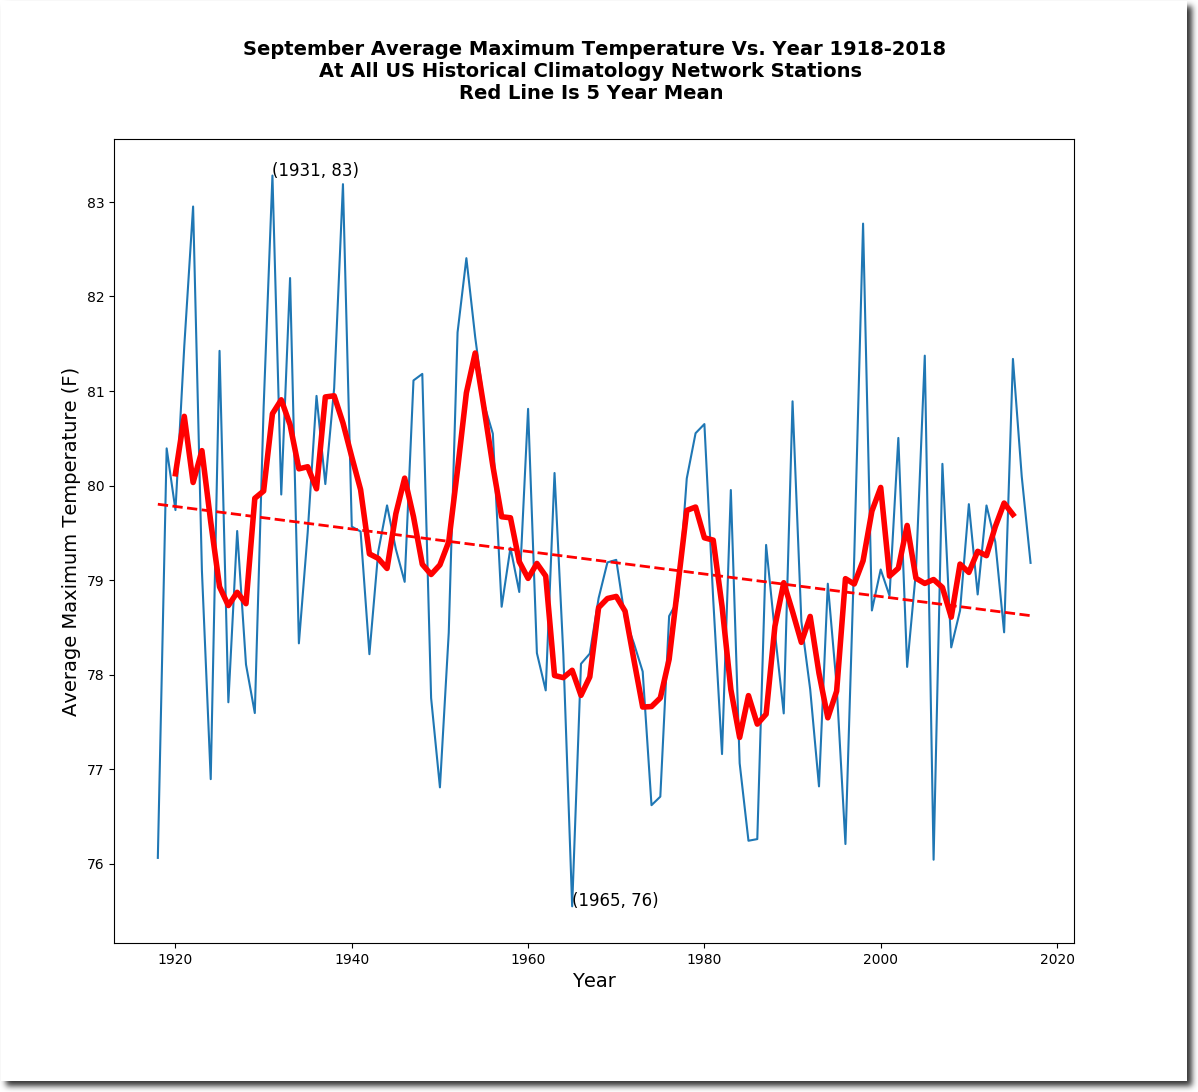
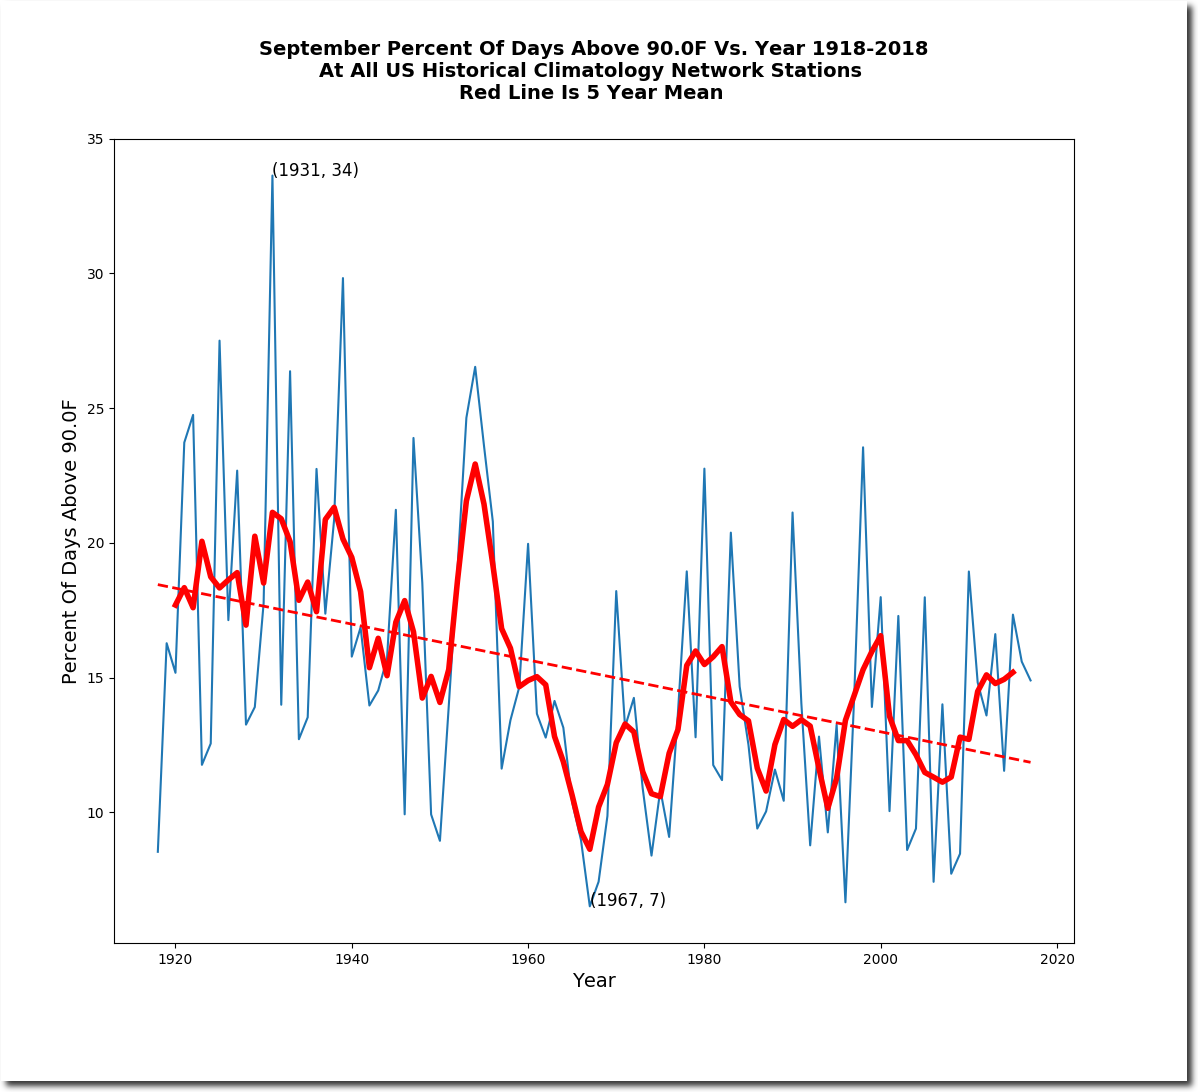

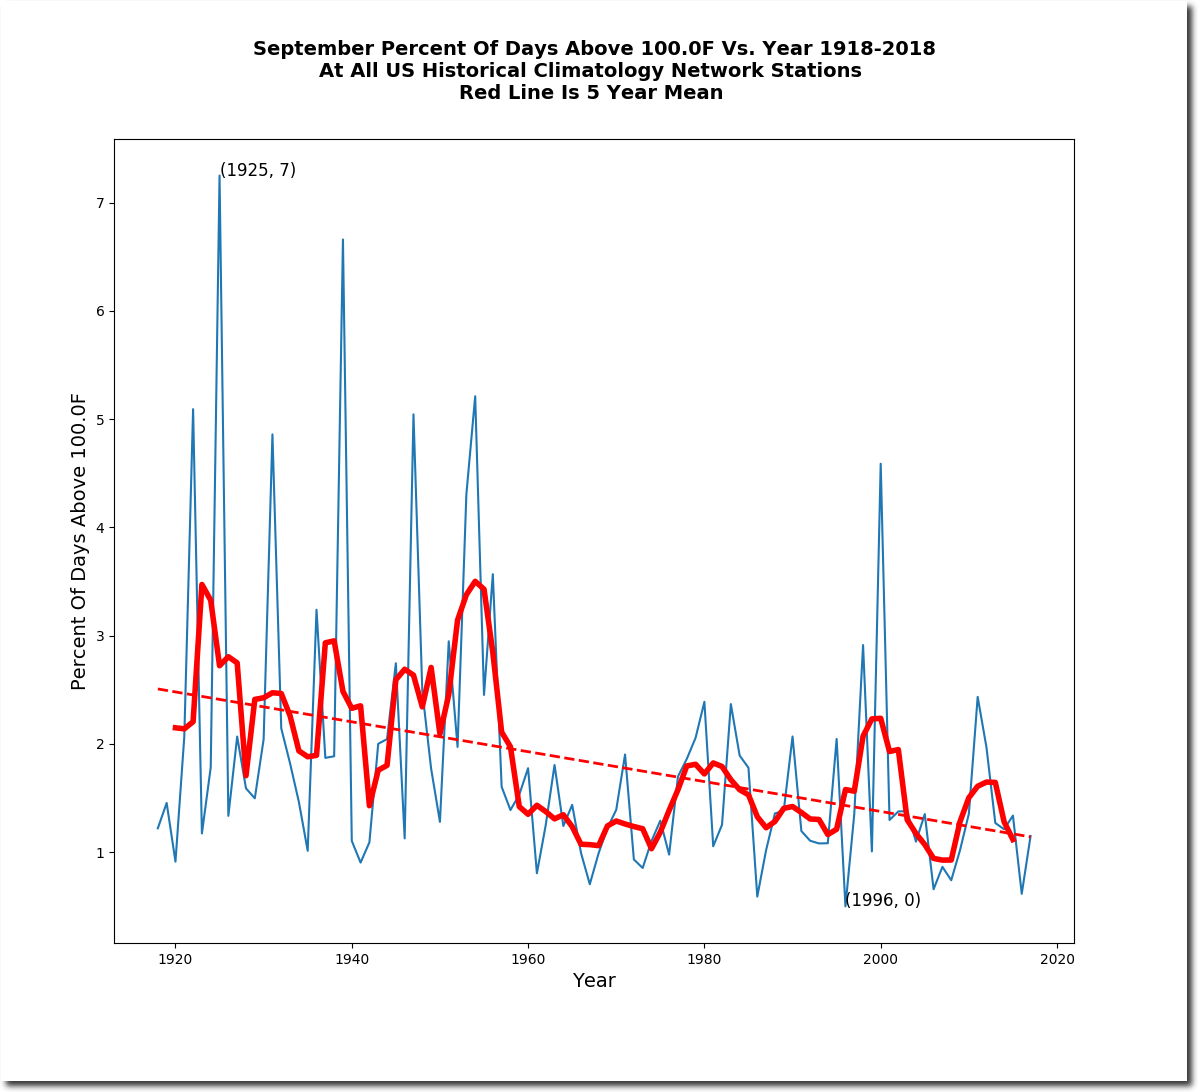
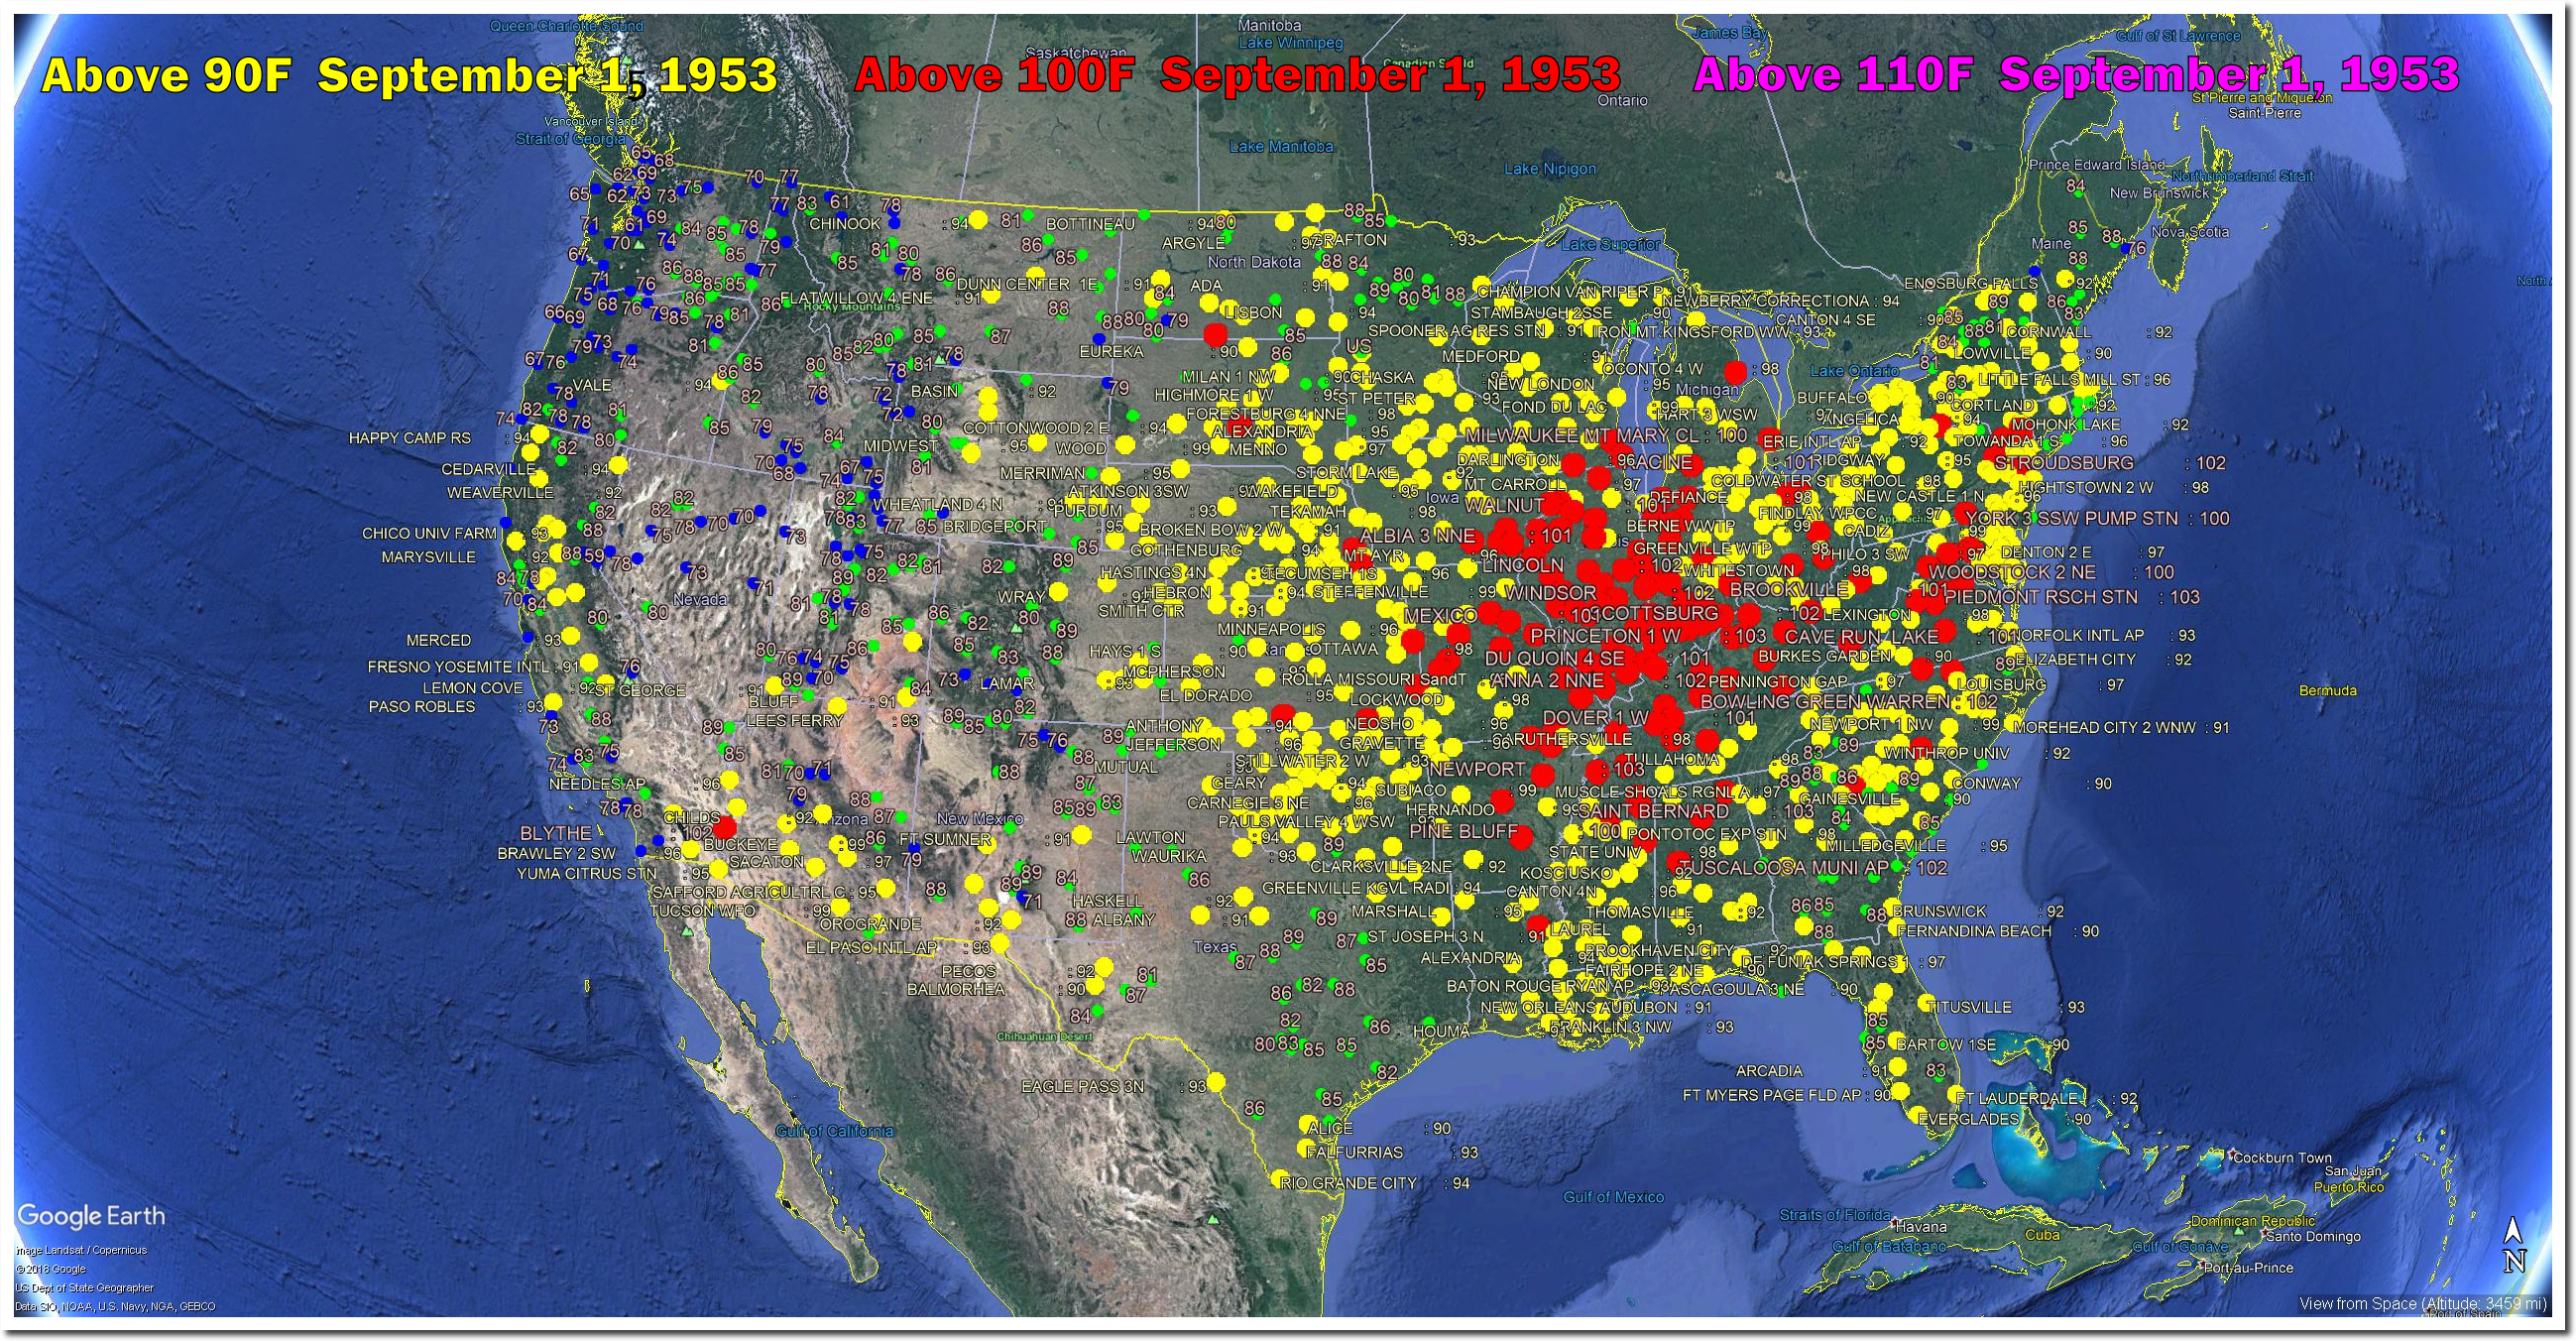
On this date in 1953, much of the Eastern US was over 100 degrees.
Prior to sixty years ago, September was a very hot month in the US. The average maximum September temperature has plummeted, as has the frequency of hot days.
On this date in 1953, much of the Eastern US was over 100 degrees.
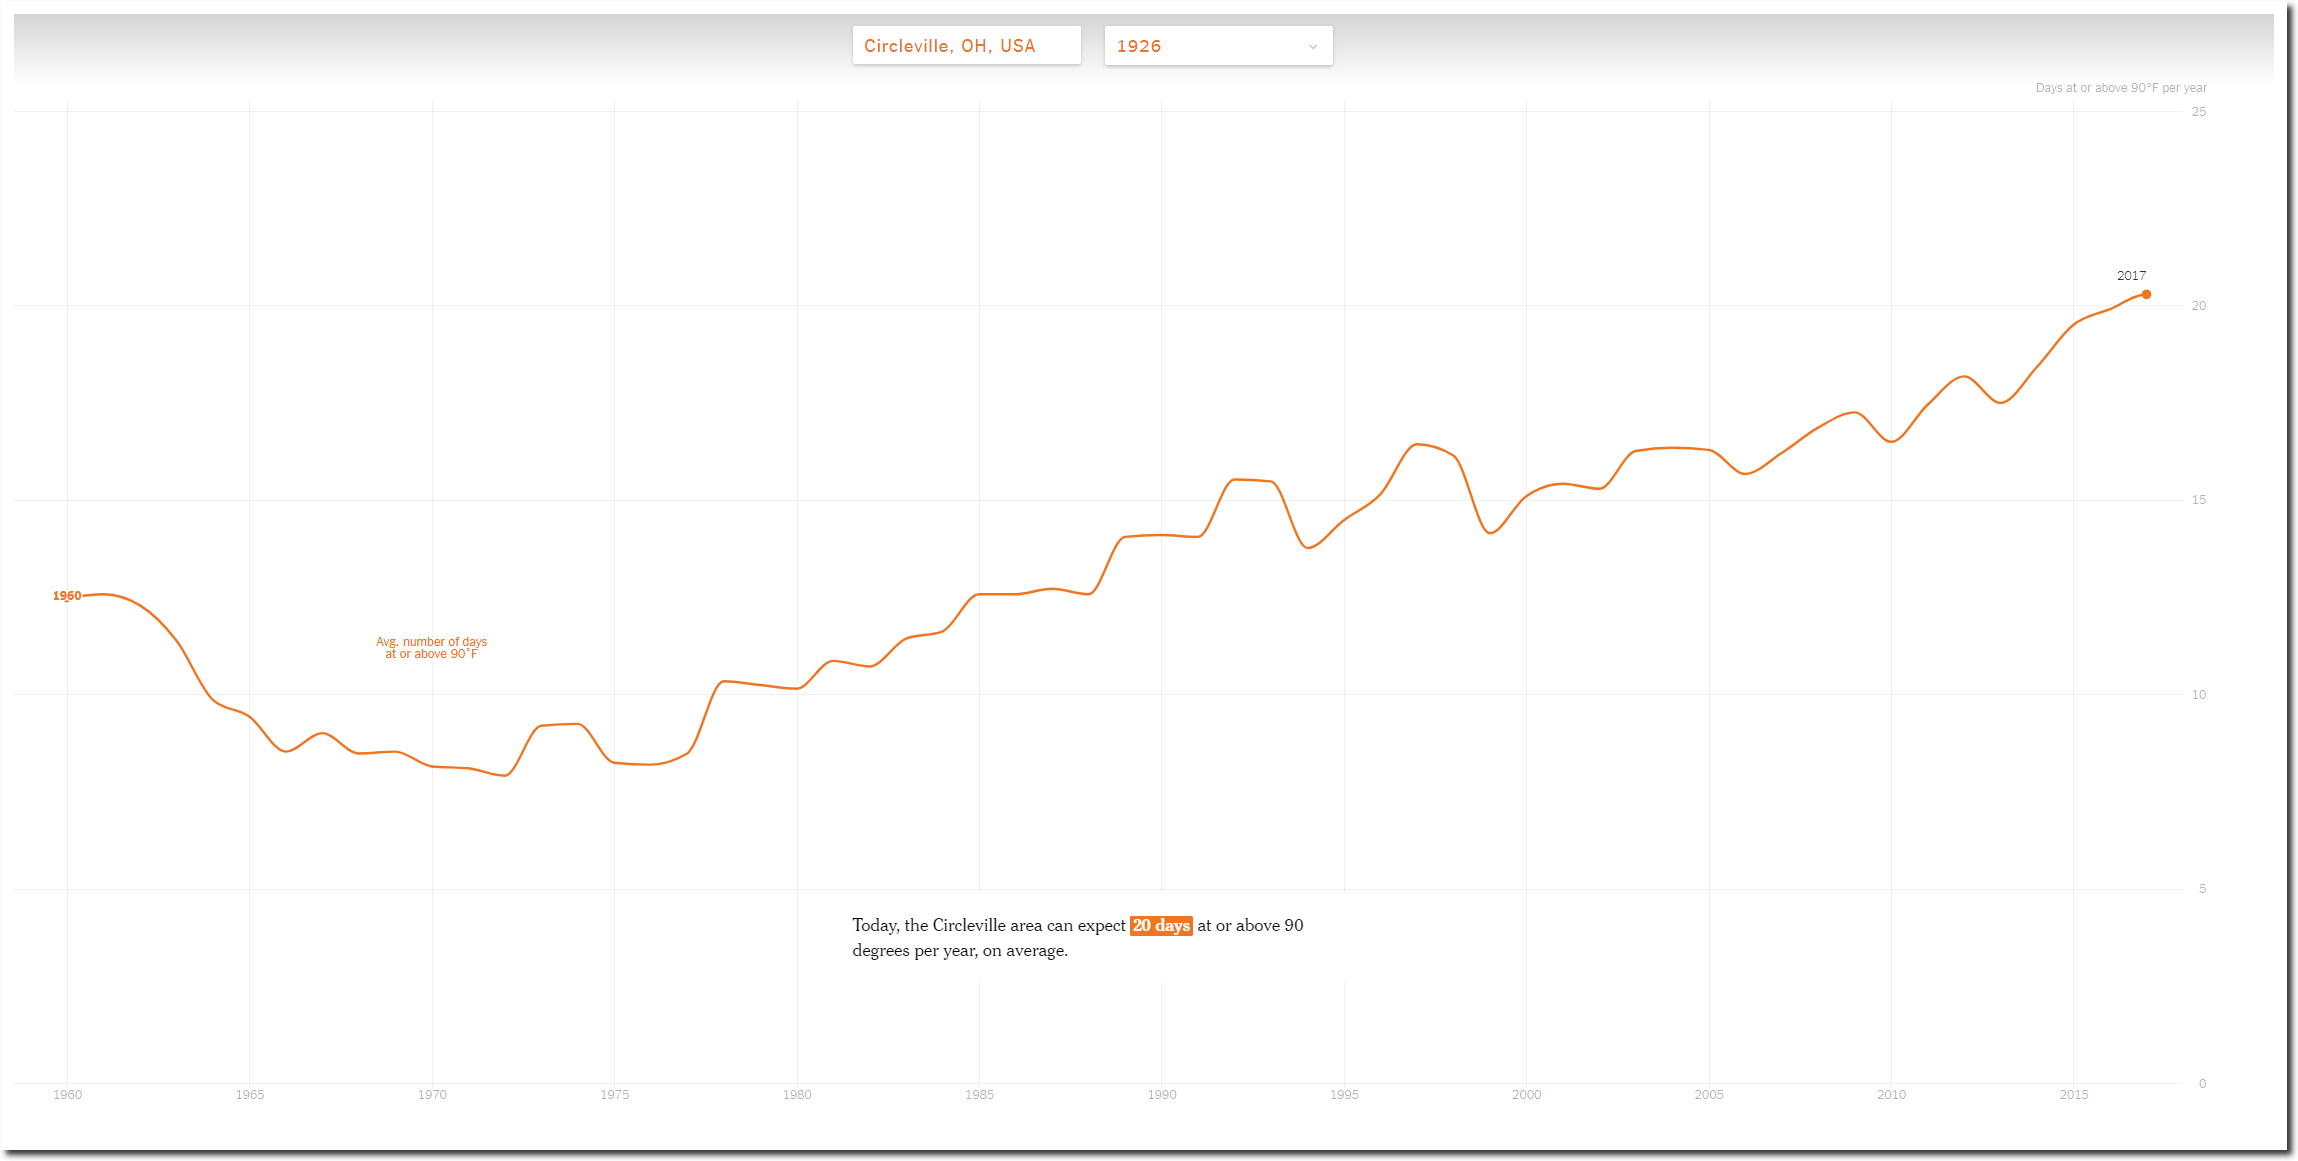
The New York Times claims Circleville, Ohio only got twelve days per year over 90 degrees around 1960.

How Much Hotter Is Your Hometown Than When You Were Born? – The New York Times
In fact, Circleville averaged closer to forty days per year around 1960. The New York Times lied by a factor of more than three. In 1936, Circleville had eighty-five days over 90 degrees.
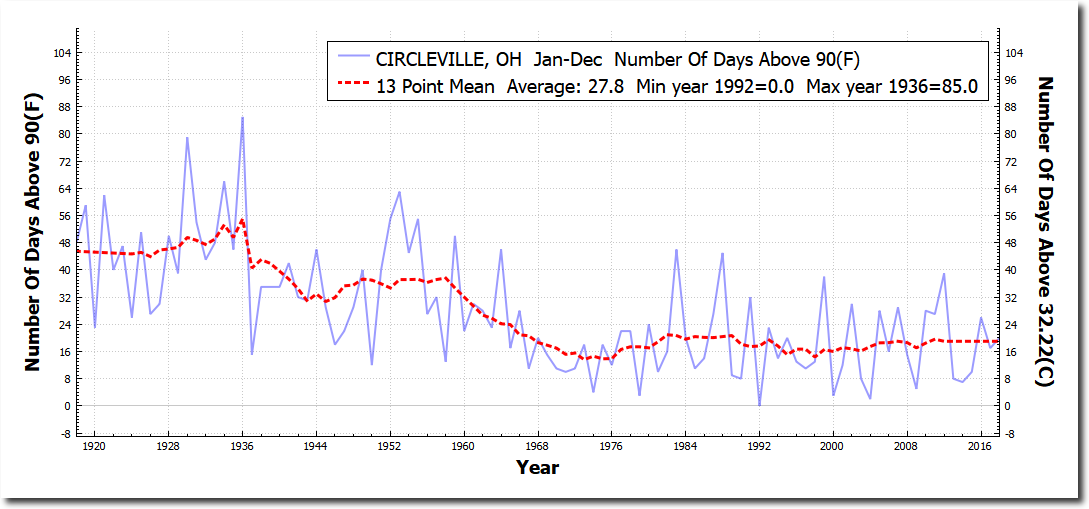
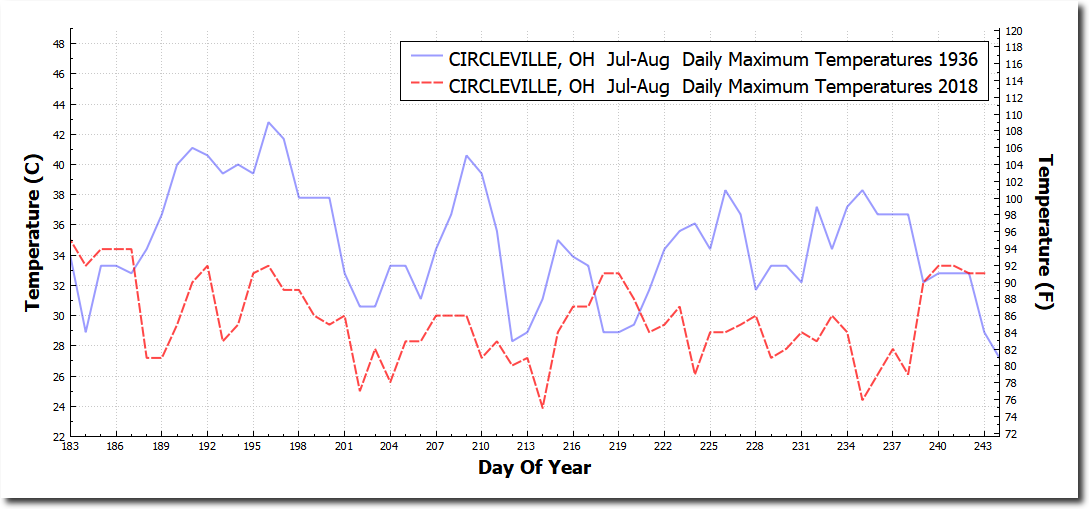
July/August 1936 was nine degrees warmer than this year at Circleville, with almost every day in 1936 warmer than this year.
They claim the number of days over 90F has increased since 1960, when in fact it has decreased sharply.
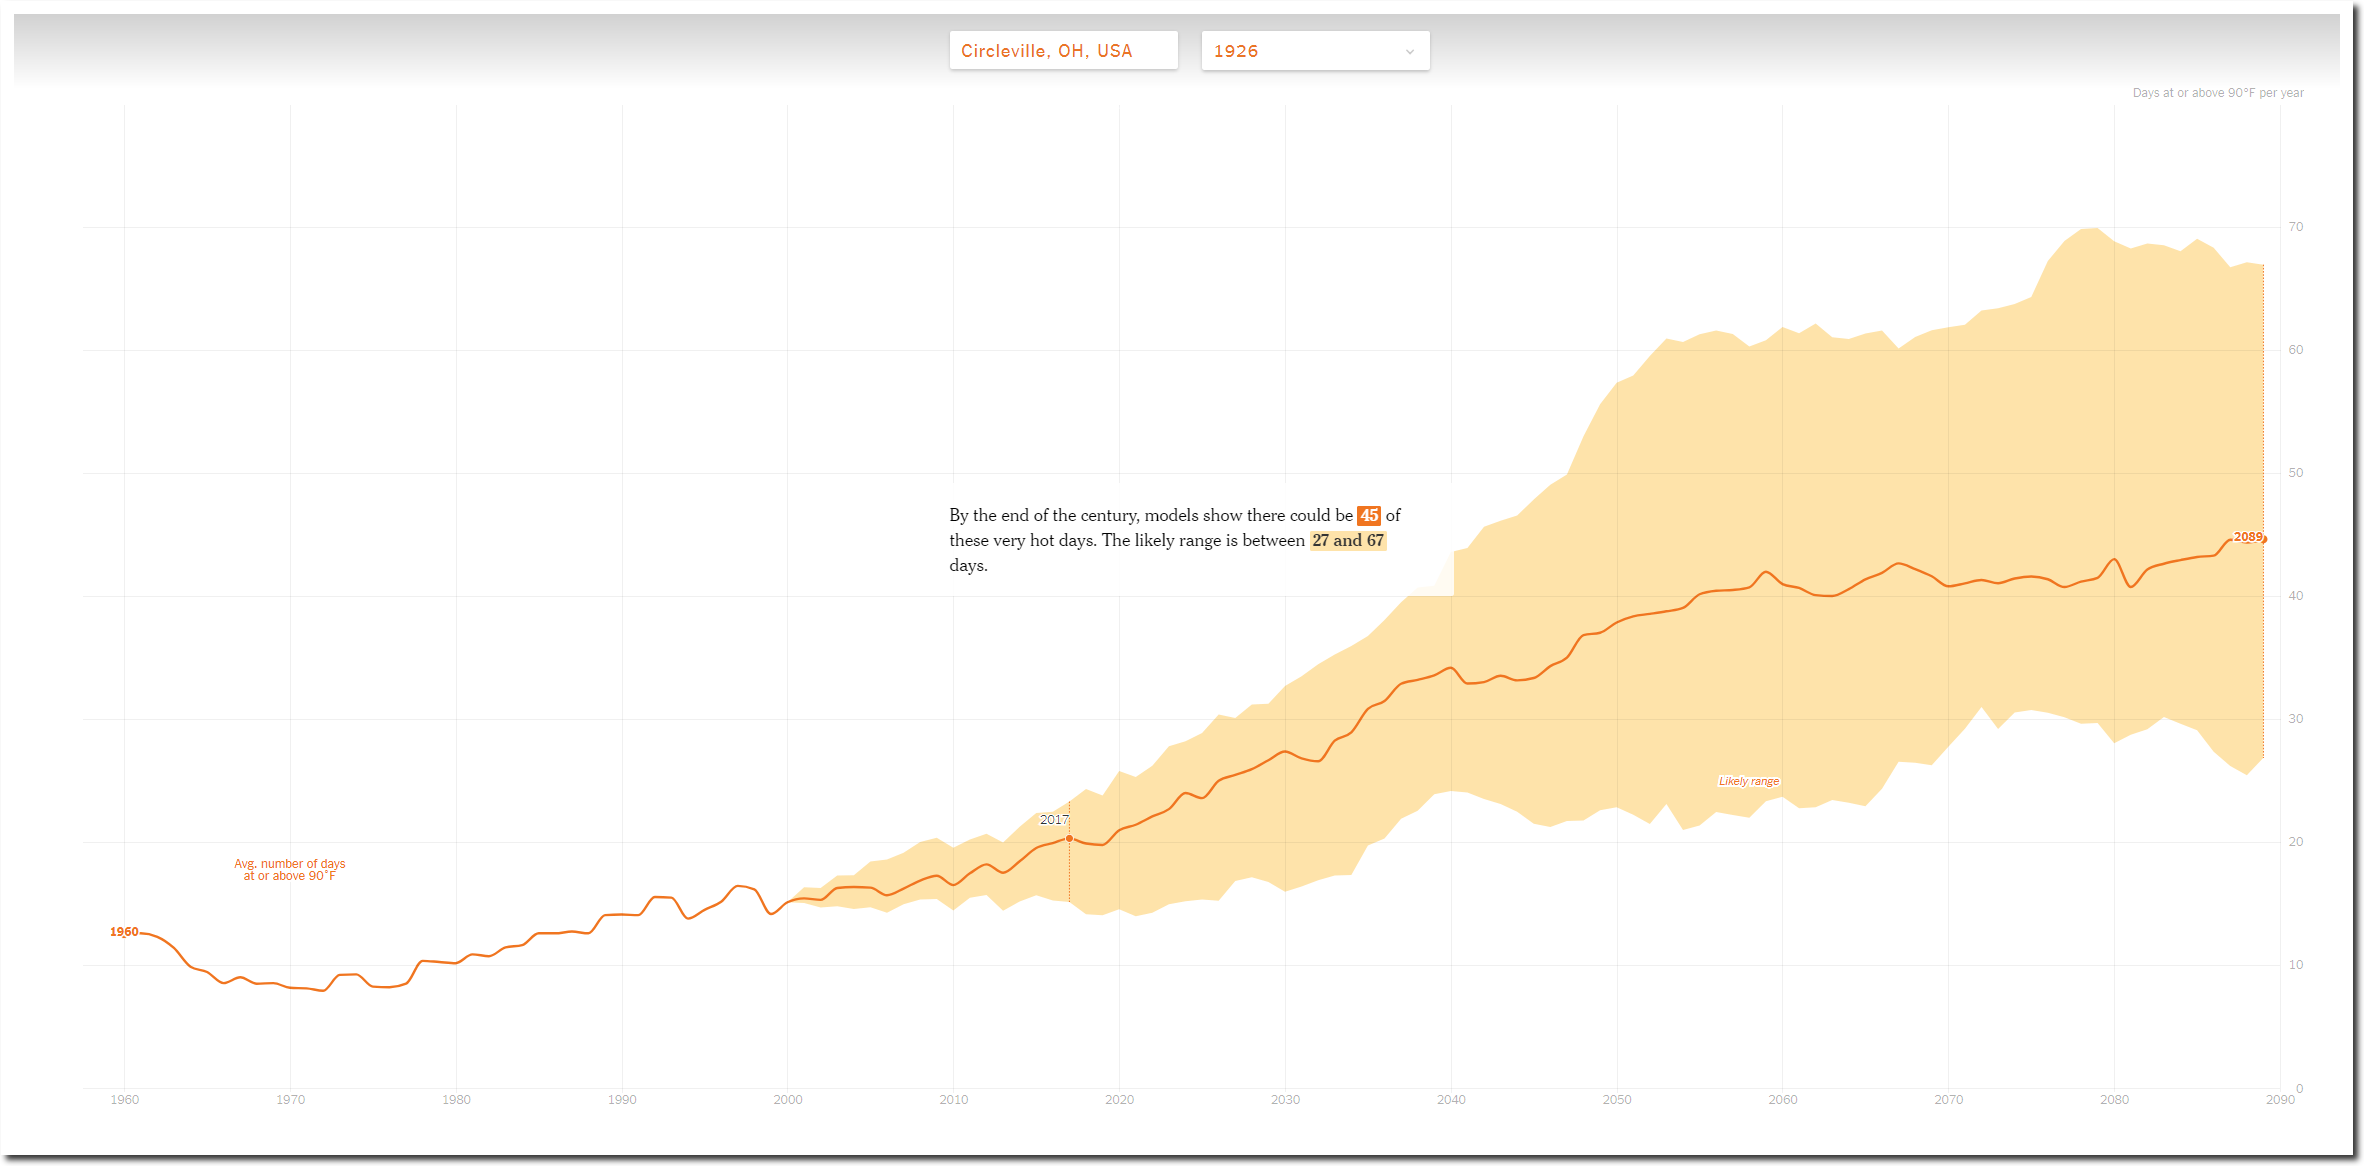
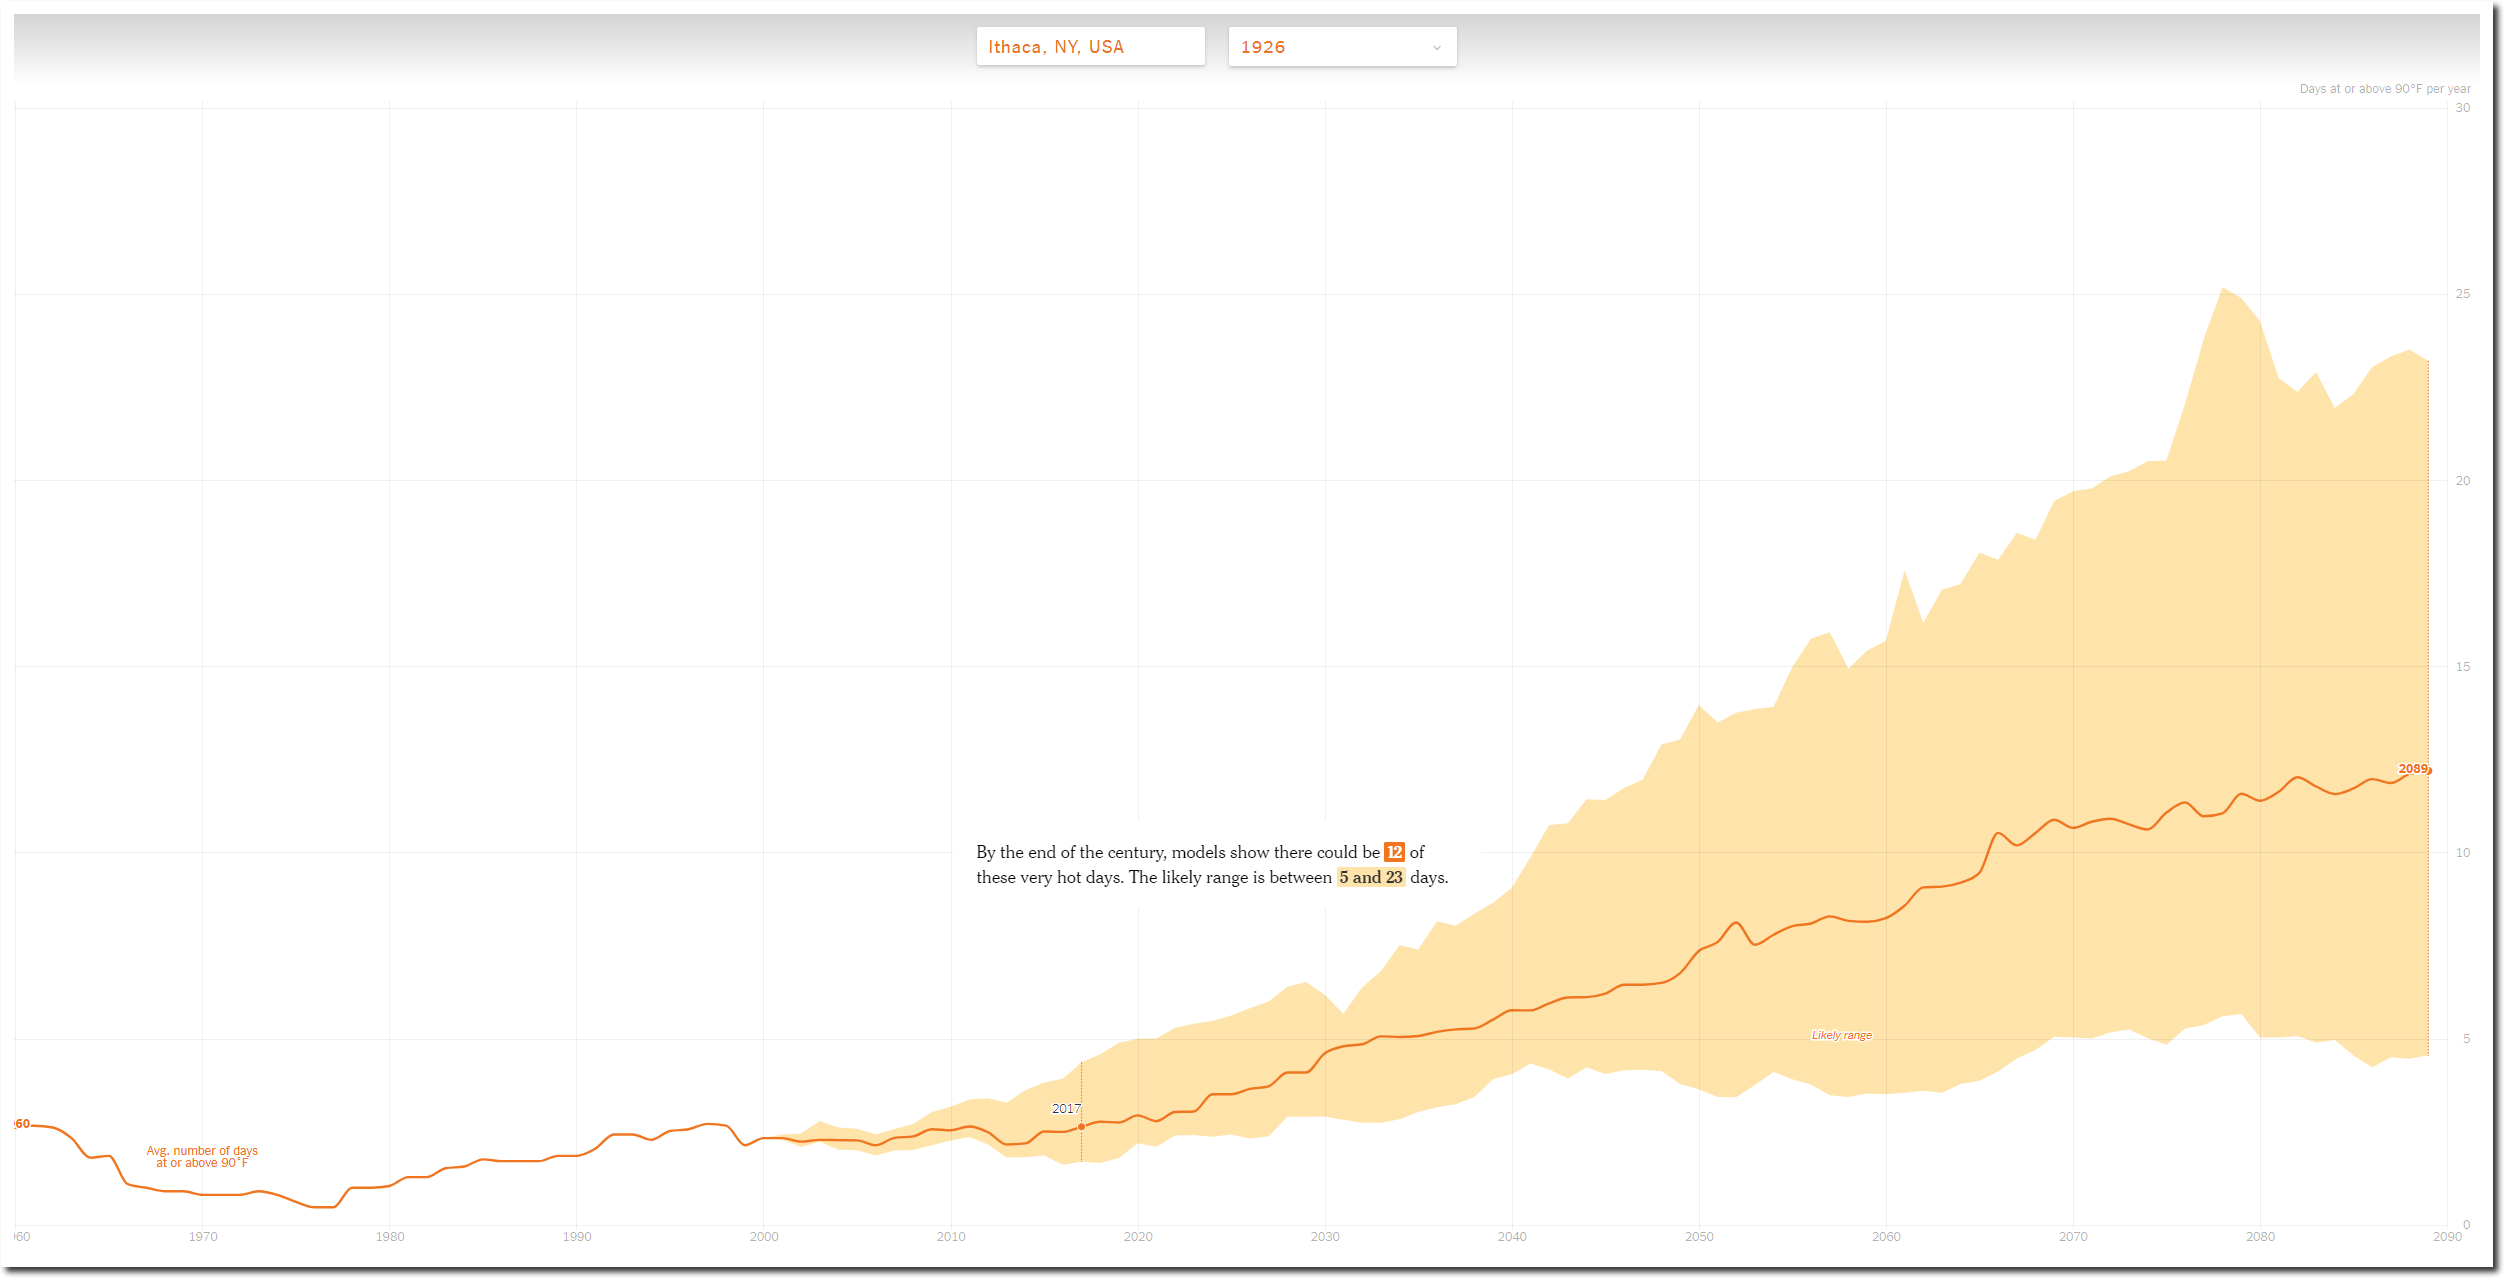
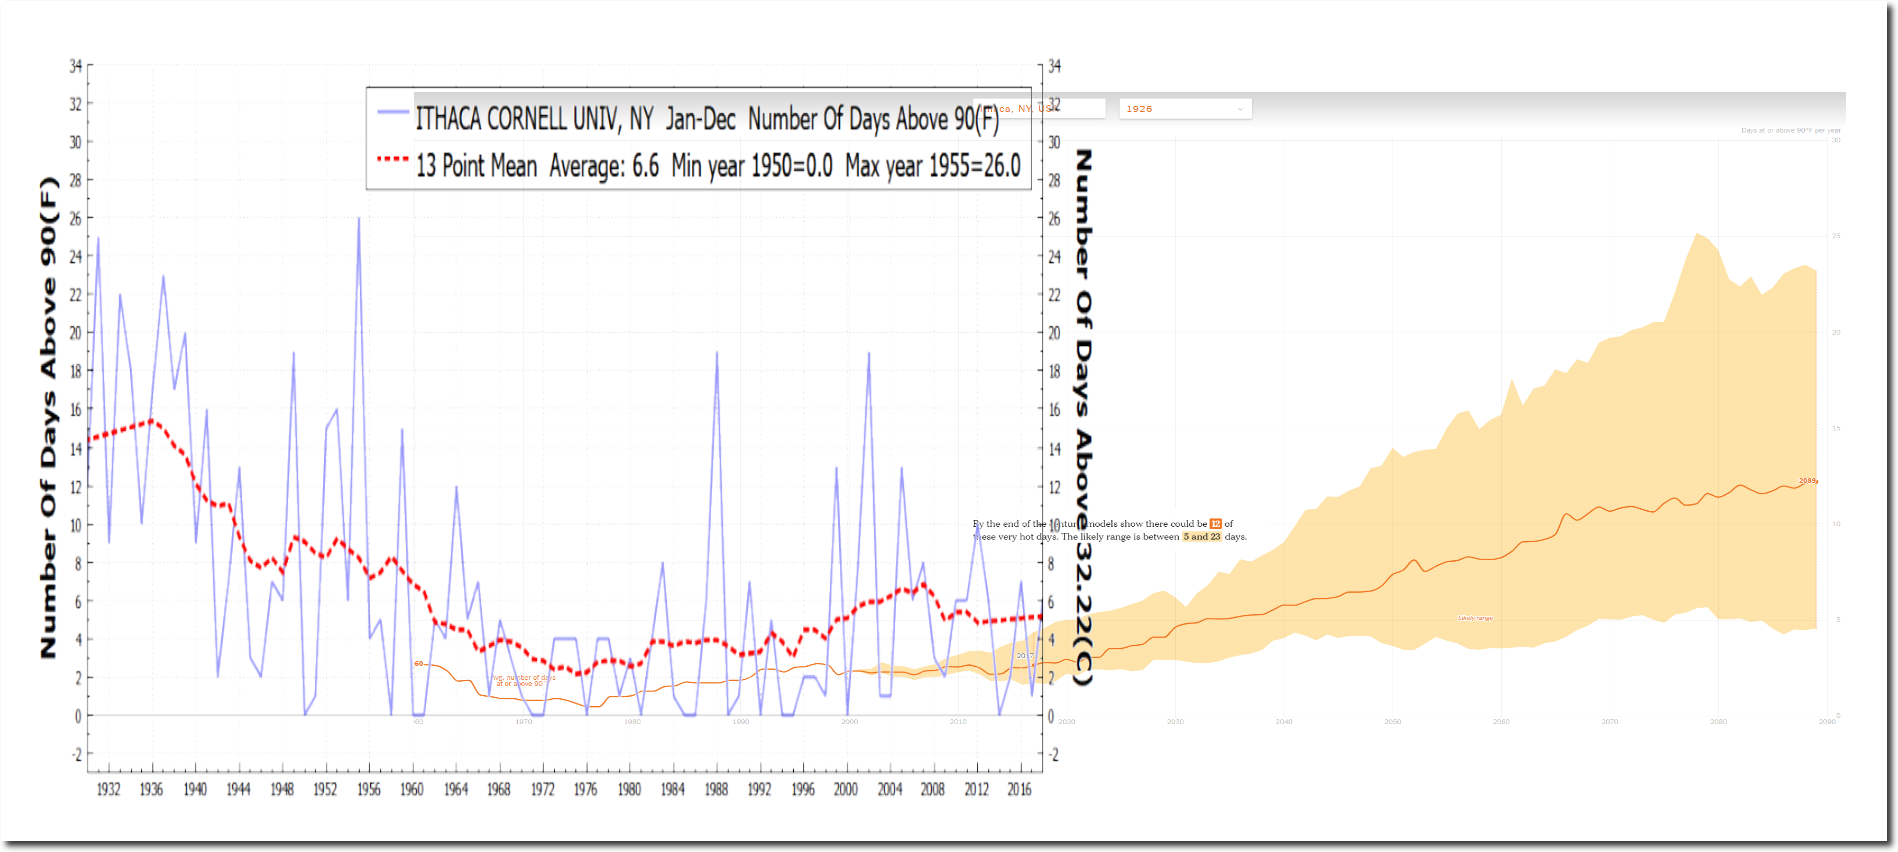
And they project there will be a large increase in the number of 90 degree days as CO2 increases. The actual data shows that there has been a sharp decline in 90 degree days as CO2 has increased.
The chart below overlays at the same scale, the actual NOAA data and the New York Times fake data and fake projections.
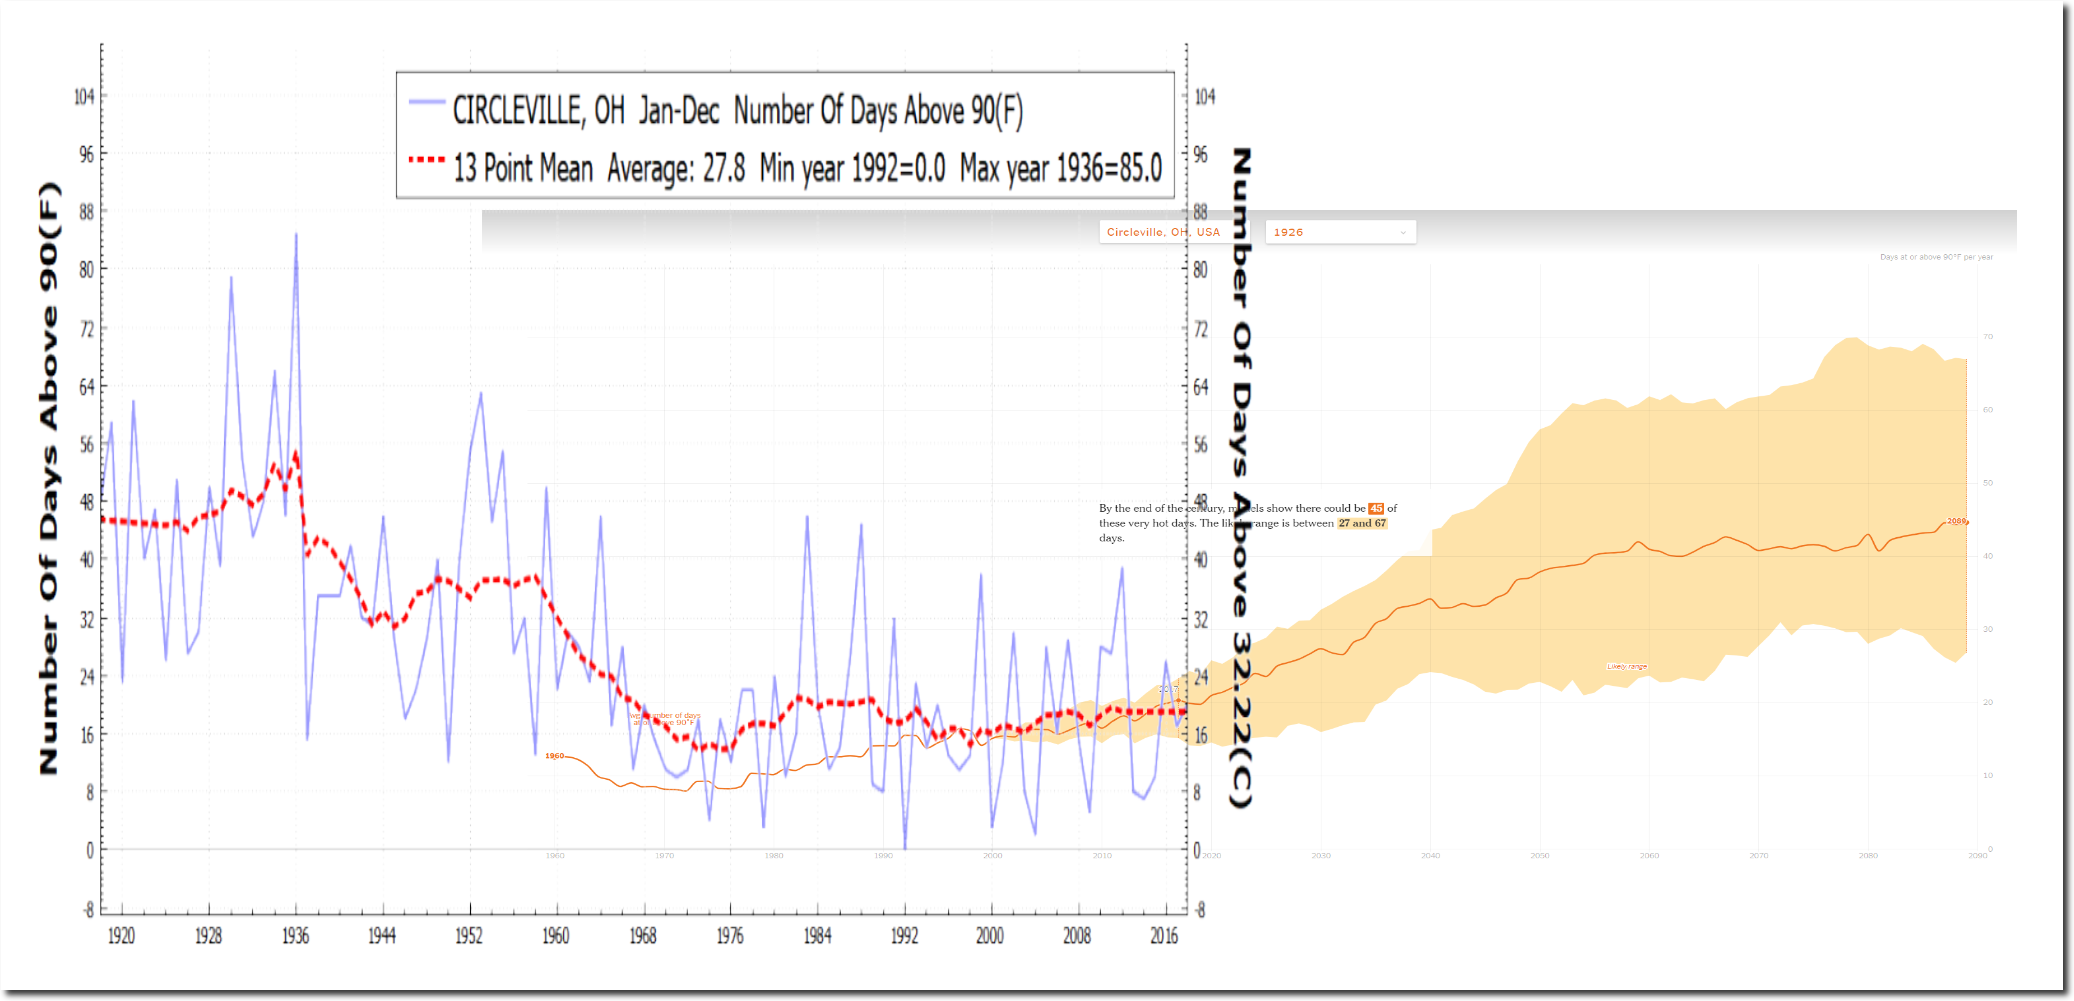
Their claims about the past and the trends are 100% fraudulent, and the exact opposite of reality. So basically typical New York Times reporting.
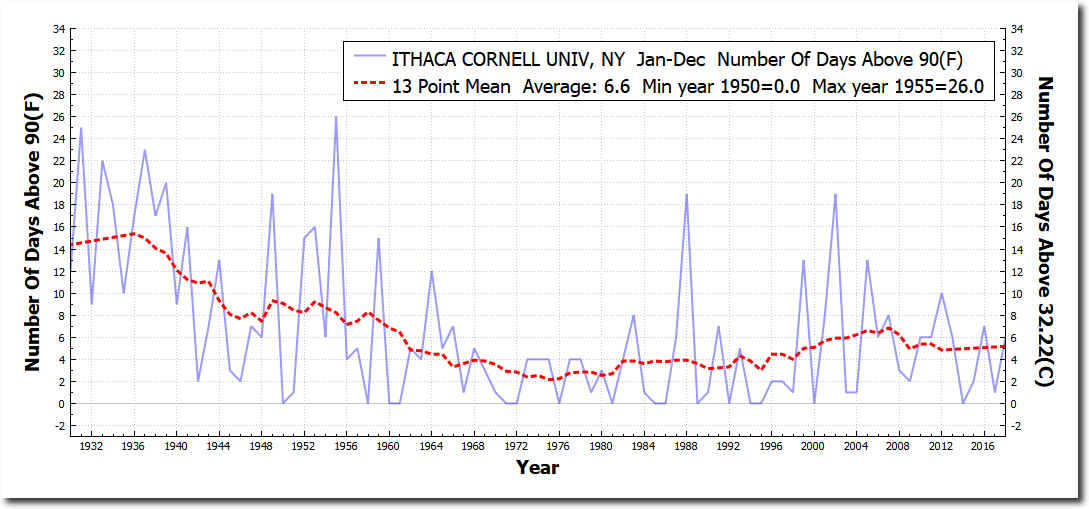
The New York Times claims that Ithaca, New York gets about three days per year over 90 degrees, when in fact they average almost double that.
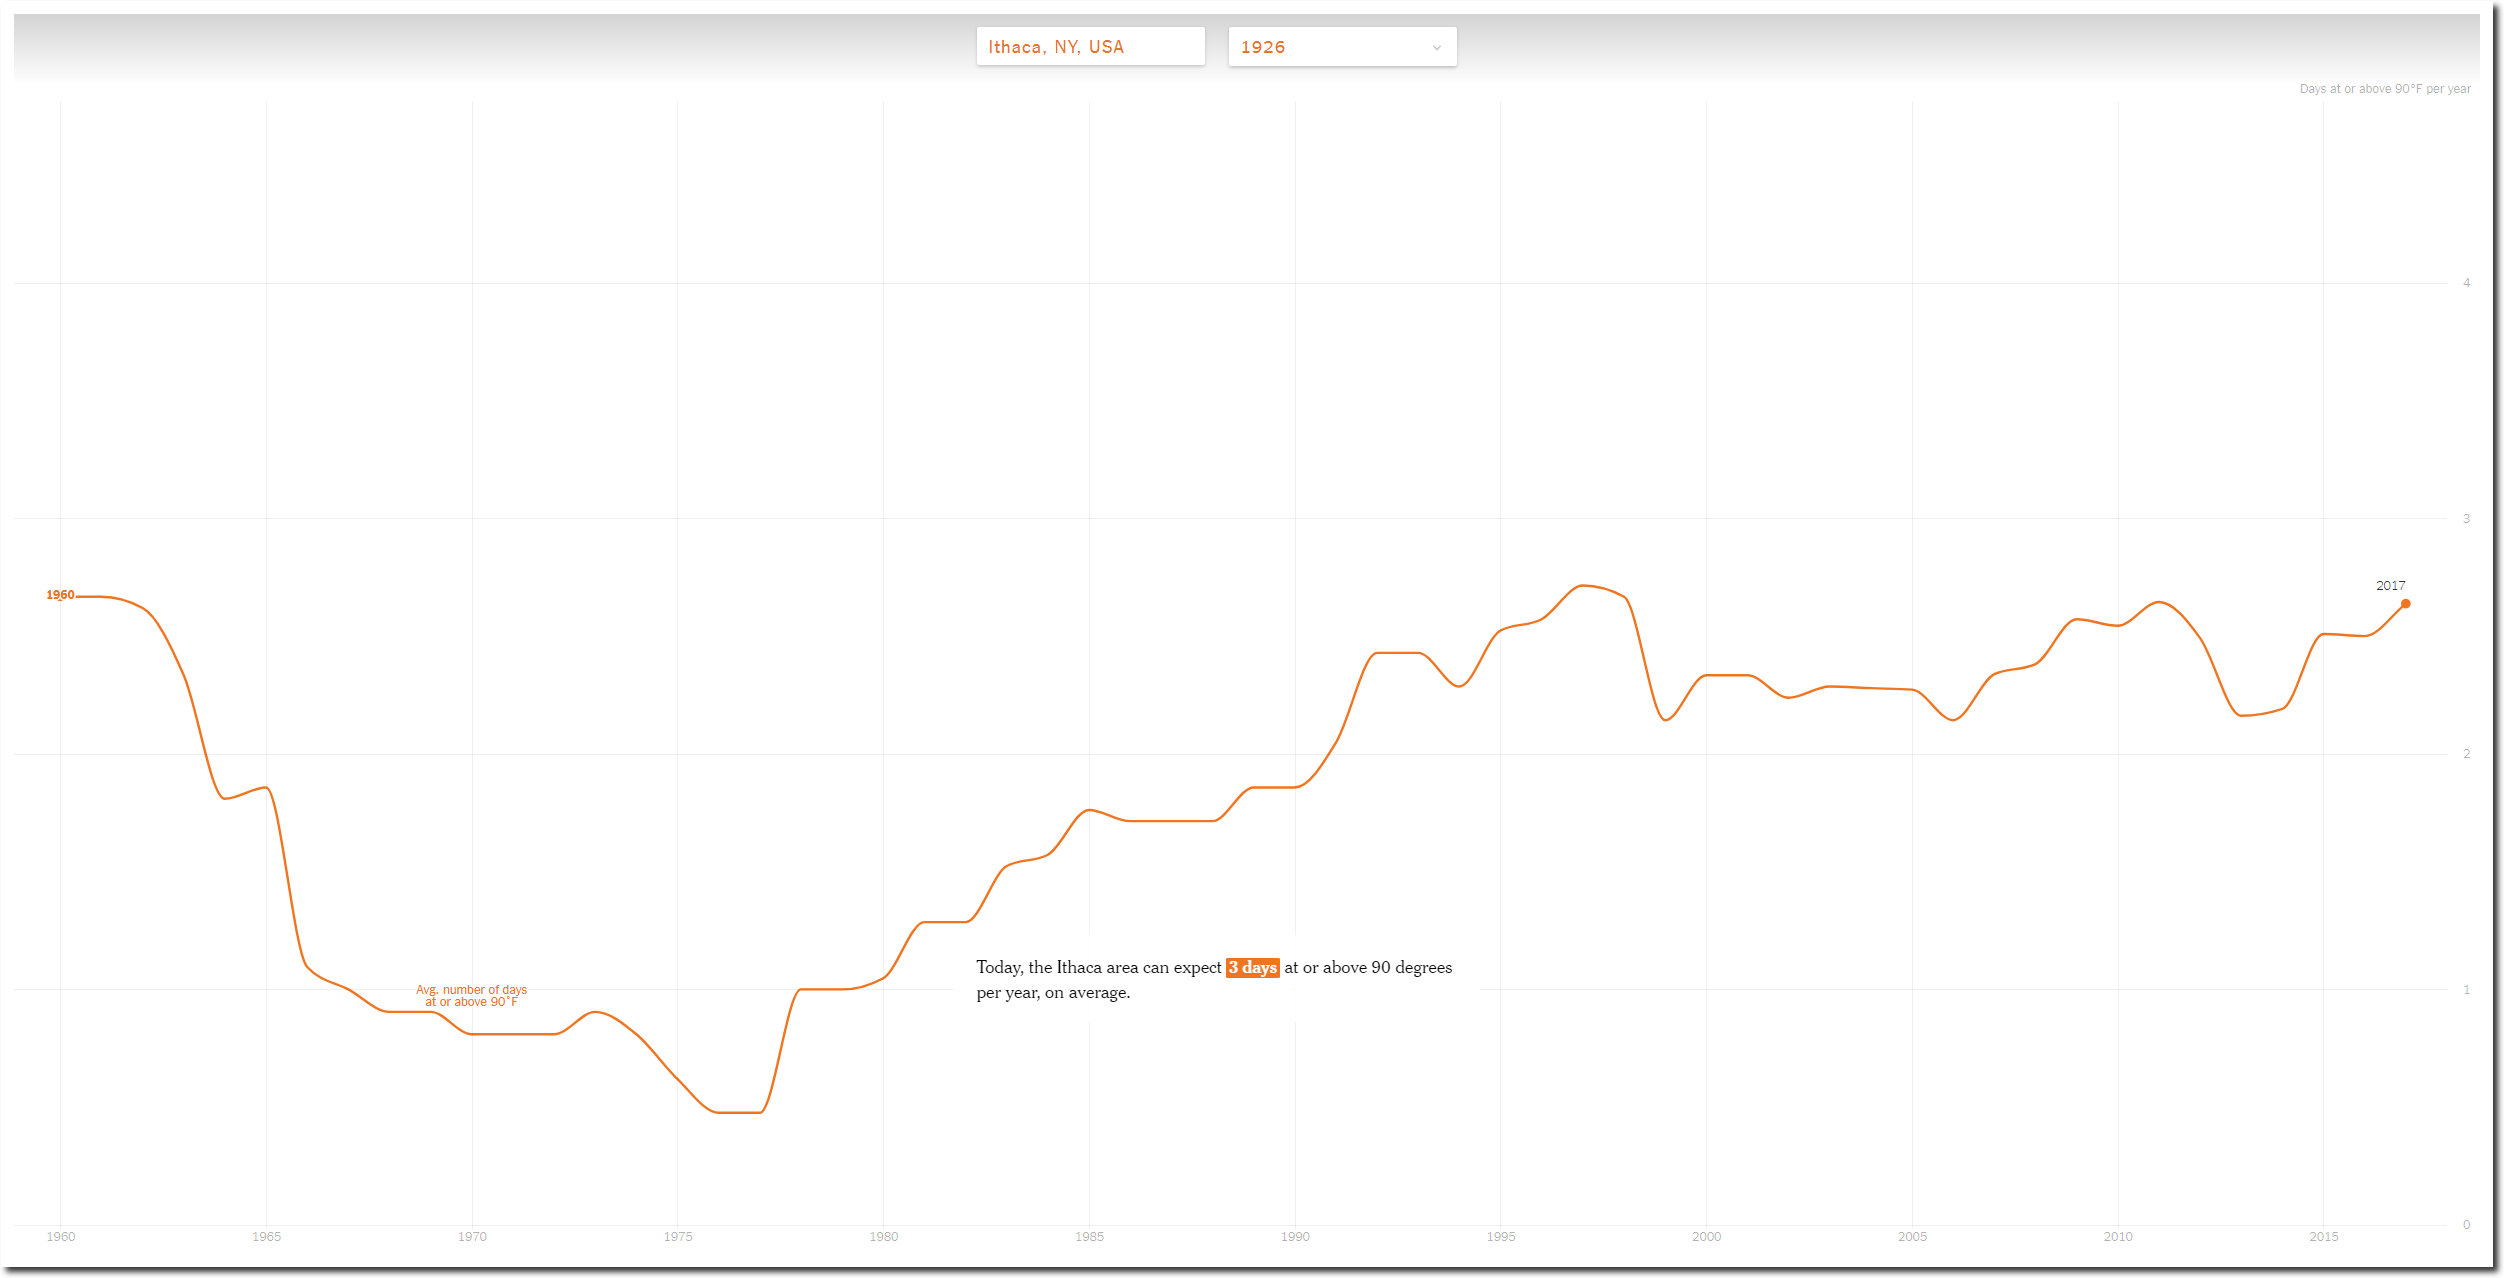
How Much Hotter Is Your Hometown Than When You Were Born? – The New York Times
The number of 90 degree days has declined by 50% over the last 90 years, as CO2 has increased.
The New York Times claims the opposite trend.
A large percentage of New York Times reporting is fraudulent, and sometimes it is trivial to prove. They are hiding readily available historical data, reporting incorrectly on historical and present data, and claiming trends which are the exact opposite of reality. Scientific and journalistic fraud at its worst.
Early in life I had noticed that no event is ever correctly reported in a newspaper.
George Orwell
Summer is over, and Greenland’s surface has gained 510 billion tons of ice over the past year – about 40% above normal. The surface mass budget is snow/ice accumulation minus melt. It does not include ice loss caused by glaciers flowing to the sea, which is very difficult to measure, and is driven by processes which have little to do with the current climate.
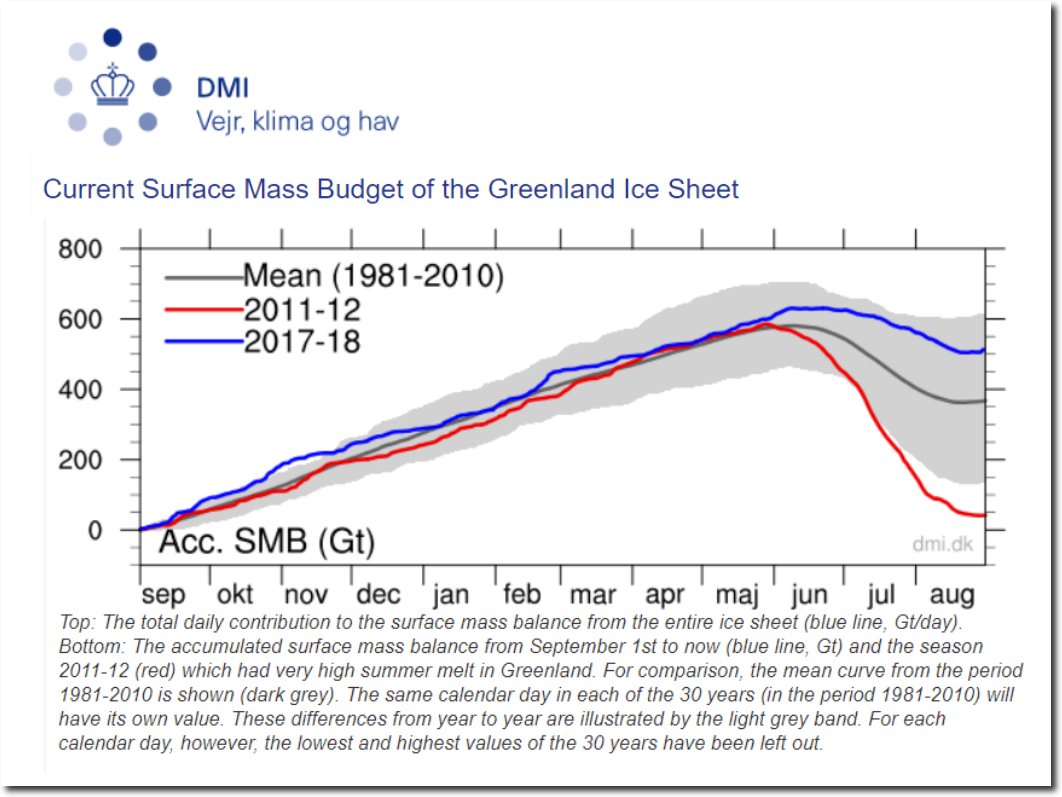
Greenland Ice Sheet Surface Mass Budget: DMI
Last year Greenland gained a little more ice, about 50% above normal.
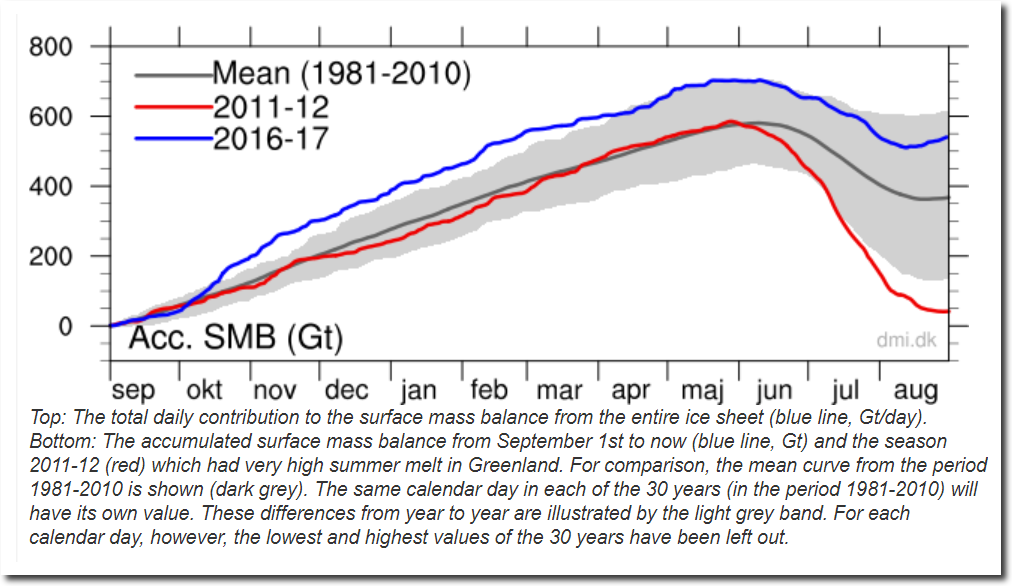
Greenland Ice Sheet Surface Mass Budget: DMI
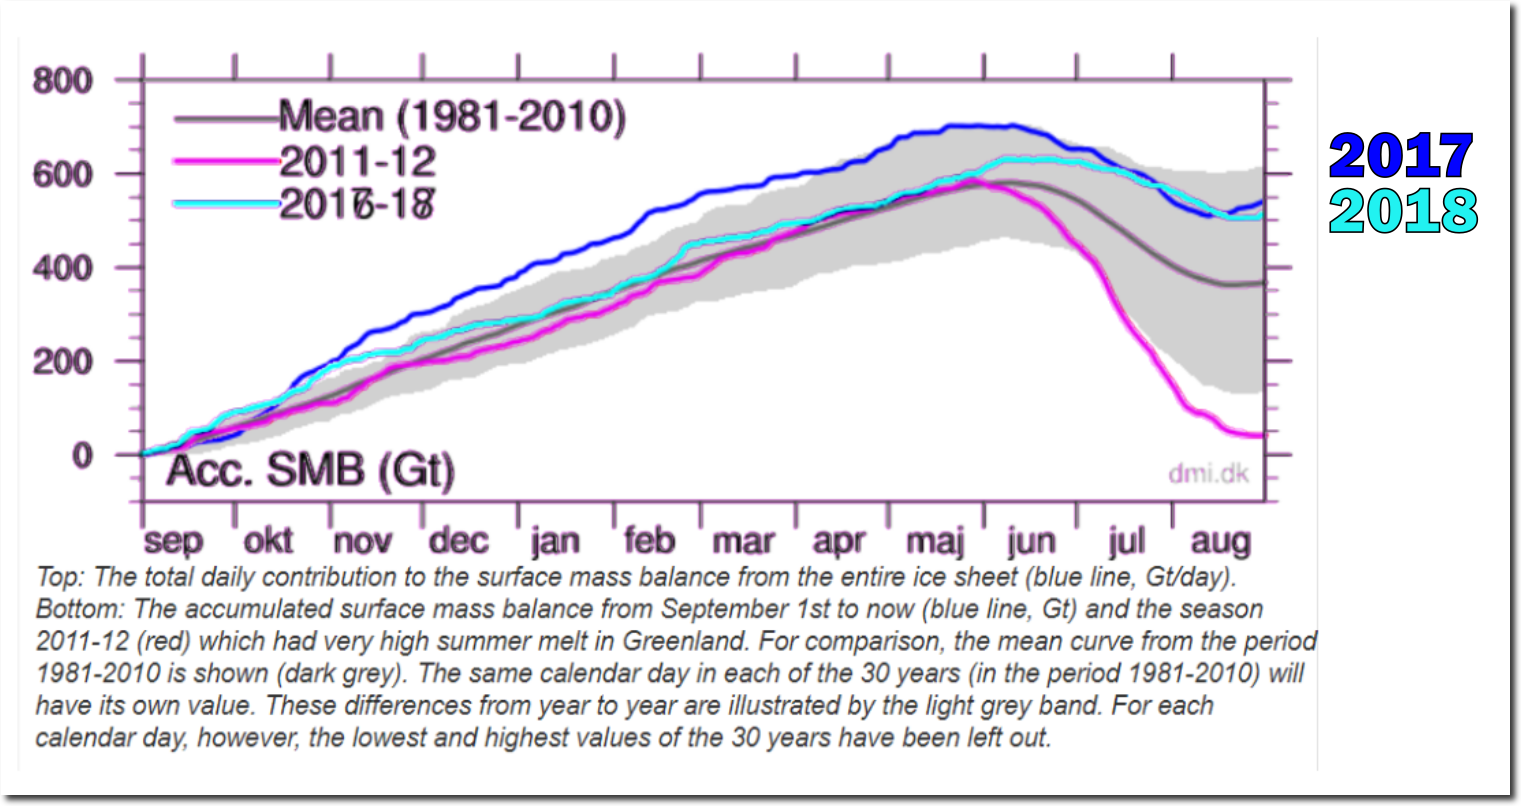
The trajectories were very different last year and this year, but the final result was about the same.
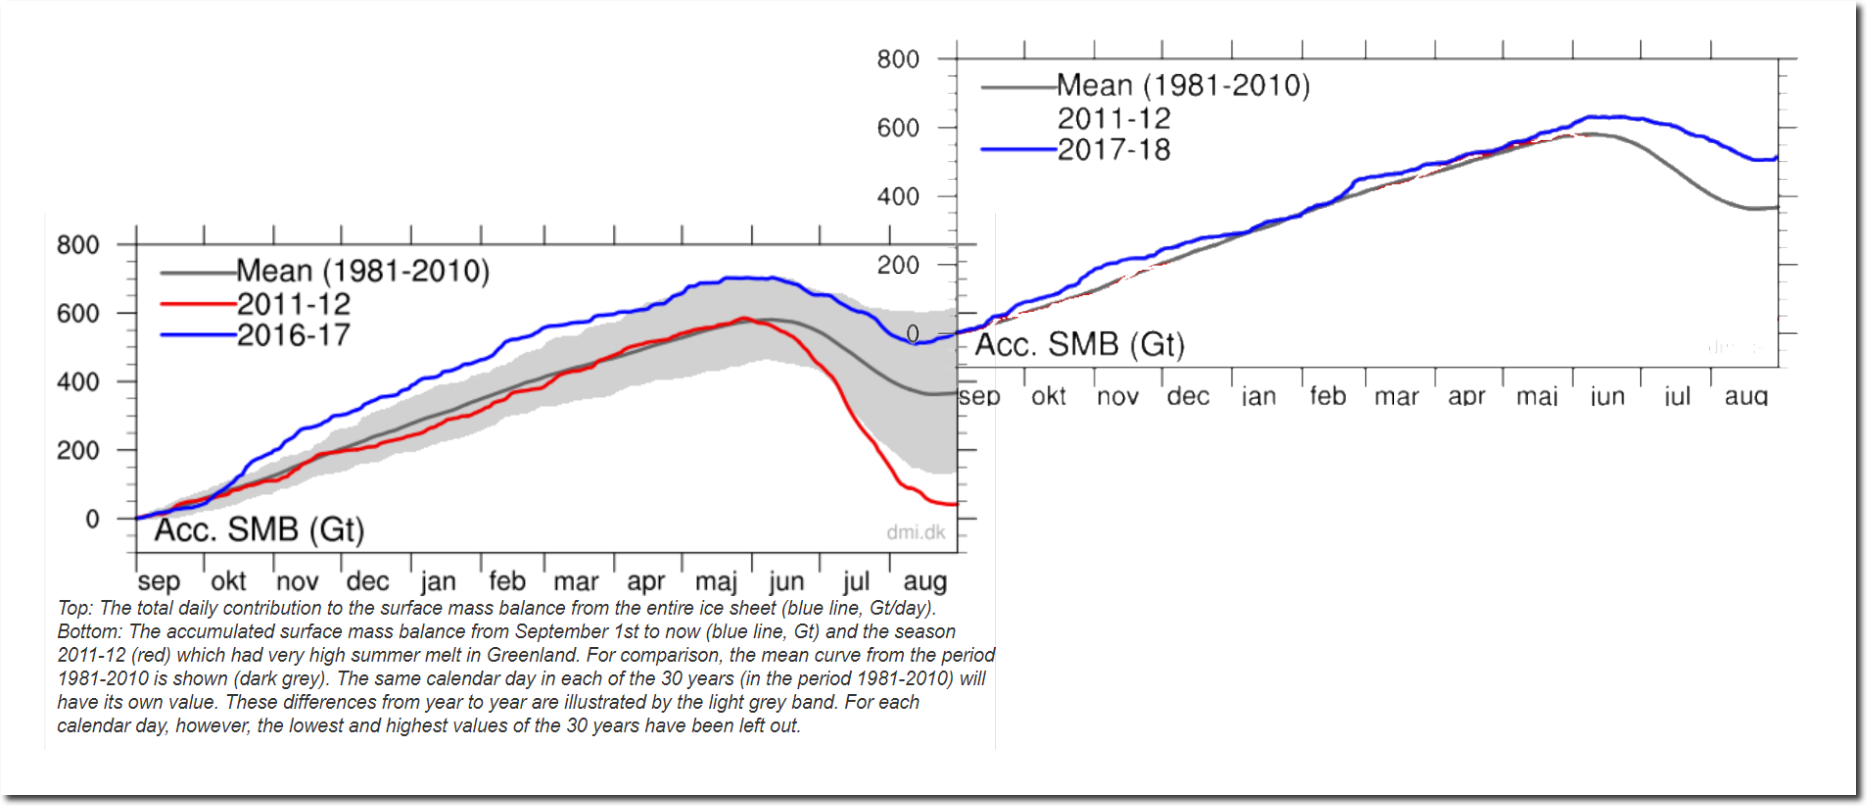
Lining the two graphs up side by side, you can see the more than one trillion tons of ice which Greenland’s surface has gained over the past two years.
Last year, the Danish Meteorological Institute reported on the gain in ice, and blamed it on Hurricane Nicole. I wonder what their excuse will be this year?
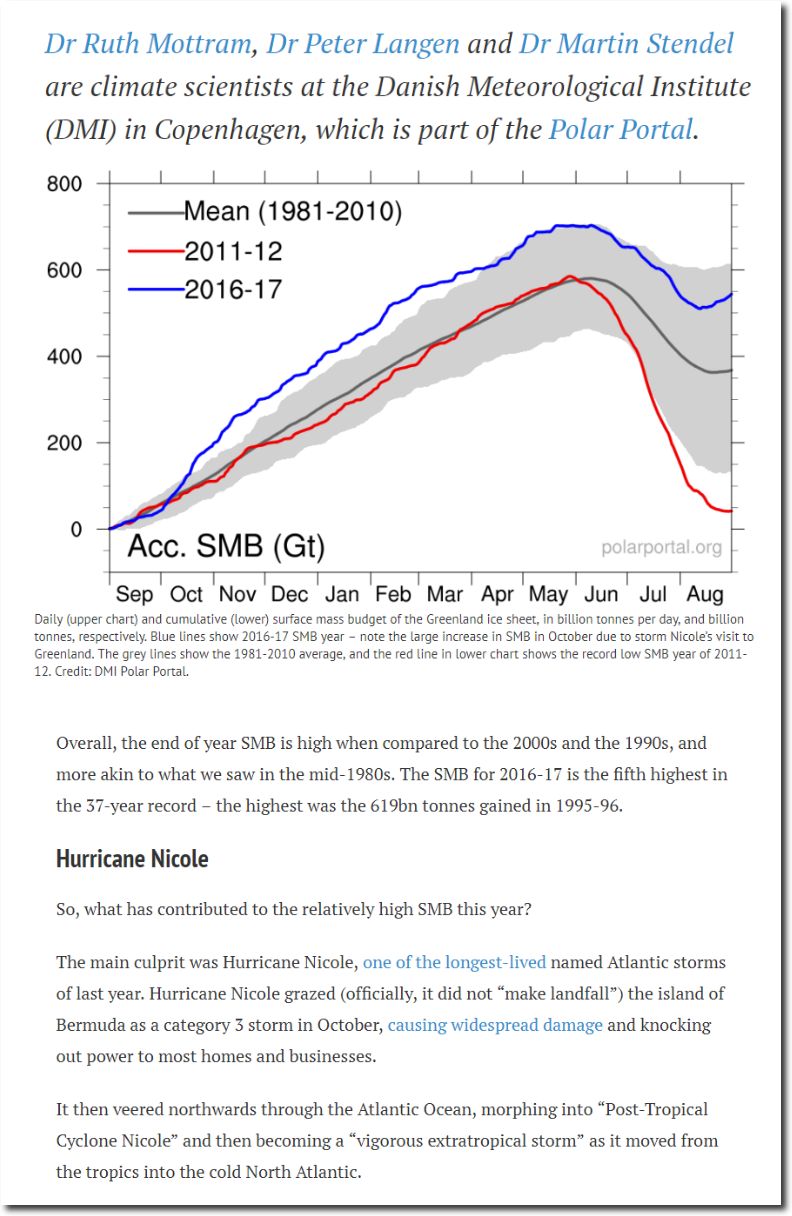
Guest post: How the Greenland ice sheet fared in 2017 | Carbon Brief
Even NOAA begrudgingly admitted that the huge ice gain was a “small increase.”
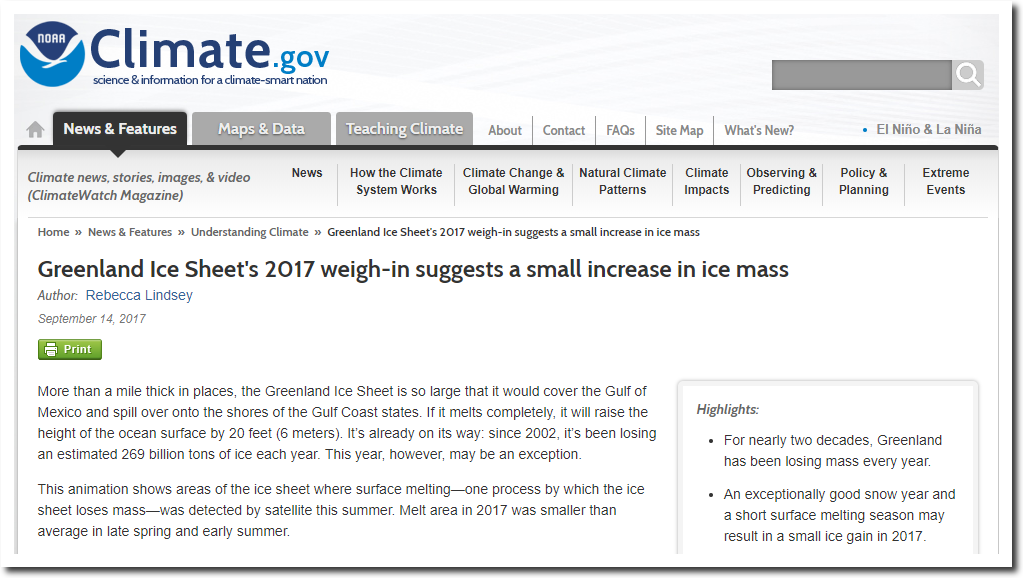
Greenland Ice Sheet’s 2017 weigh-in suggests a small increase in ice mass | NOAA Climate.gov
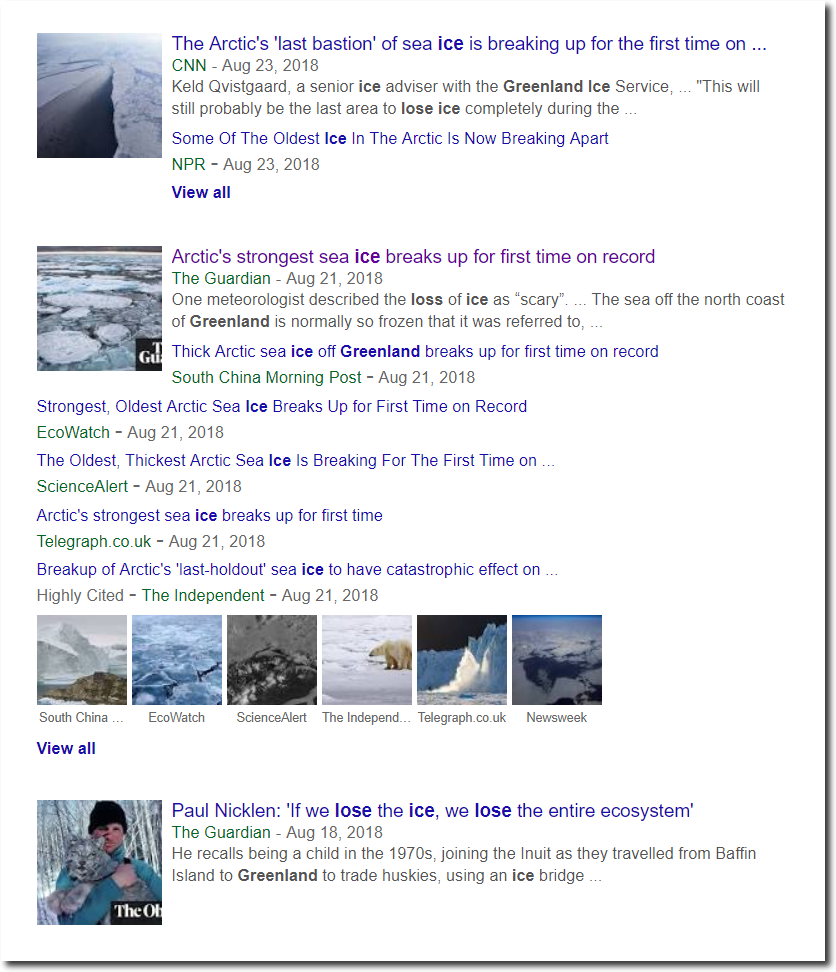
Meanwhile, the usual fraudsters in the press continue to report Greenland is melting and we are all about to die.
Insanity: doing the same thing over and over again and expecting different results.

In the movie Groundhog Day, every morning Bill Murray wakes up and lives exactly the same day as he did before. That is the life of climate alarmists. Thirty years ago they said unless you stopped buying fossil fuels, New York would drown, Phoenix would melt in 115 degree weather, Hurricanes would batter the Gulf Coast, the farm belt would dry up, and forest fires would blacken “thousands of acres.”
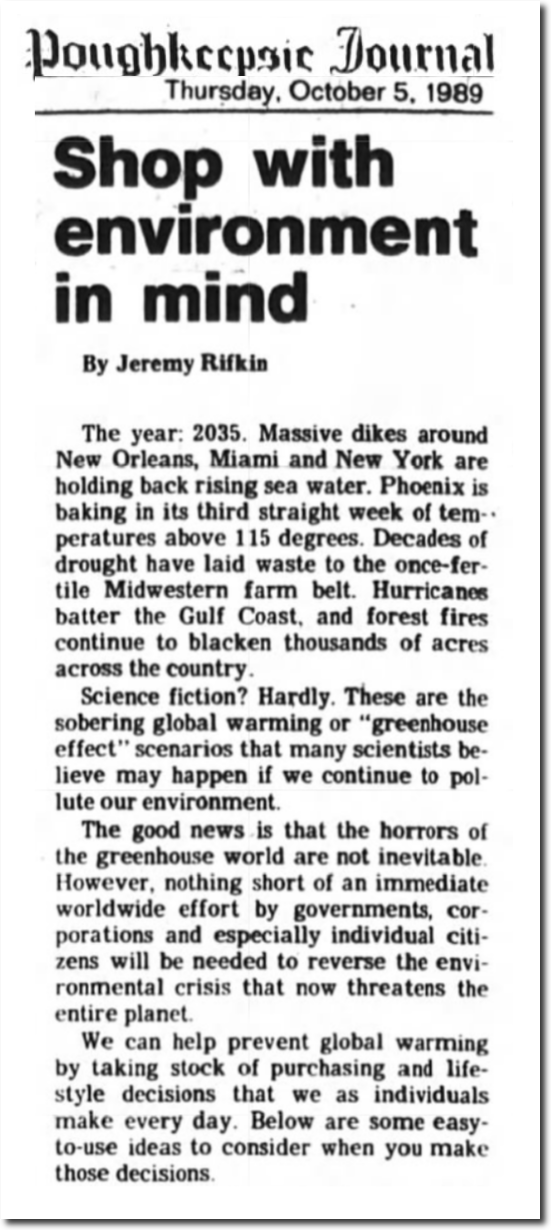
05 Oct 1989, Page 4A – Poughkeepsie Journal at Newspapers.com
Their evidence was based on blaming every bad weather event on on global warming.
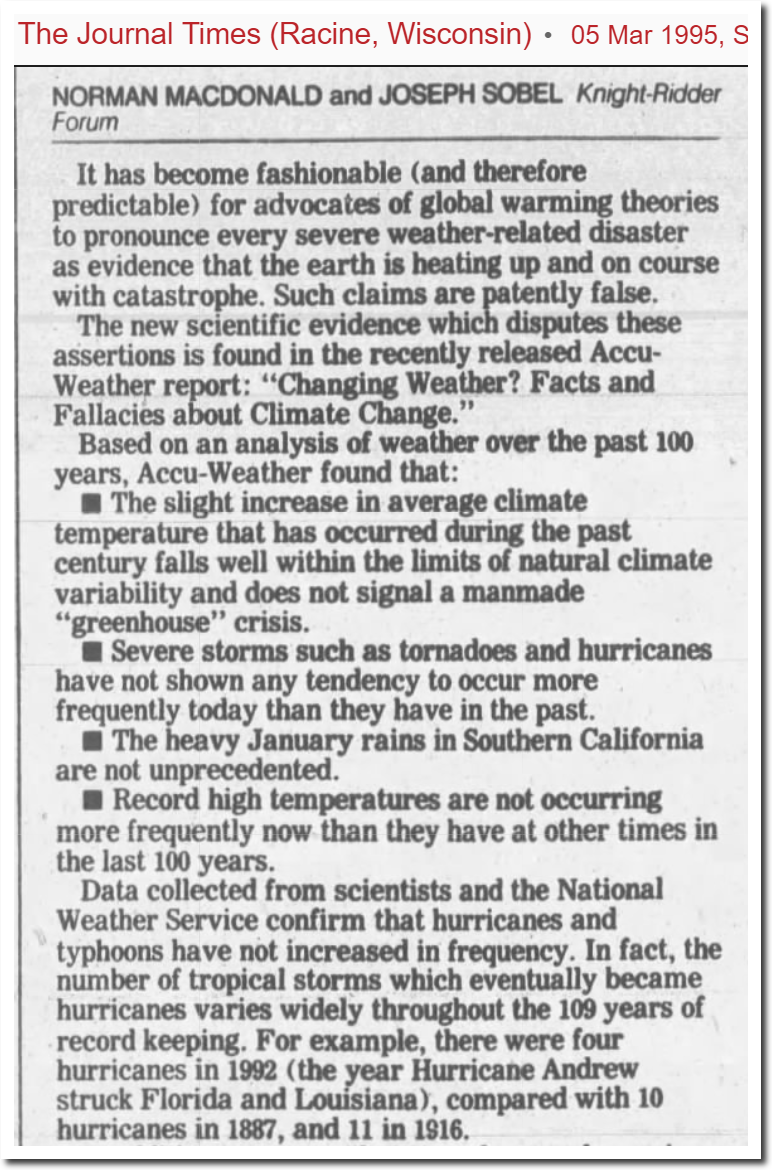
05 Mar 1995, 13 – The Journal Times at Newspapers.com
Nothing about their belief system has any basis in science, and they have been doing the same thing day after day for decades.
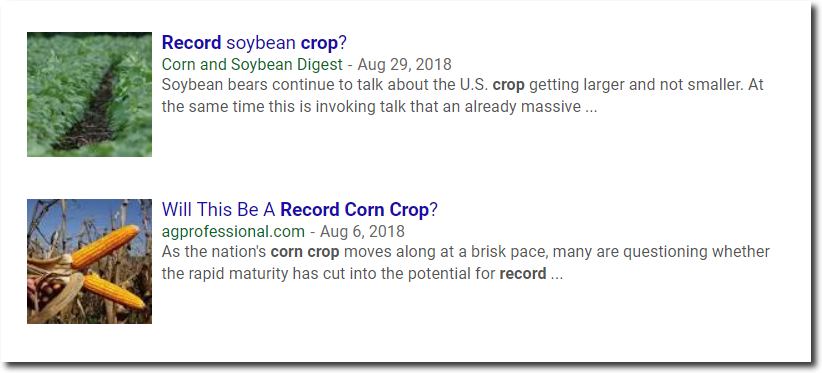
The corn belt is getting wetter, and year after year is seeing record crops.
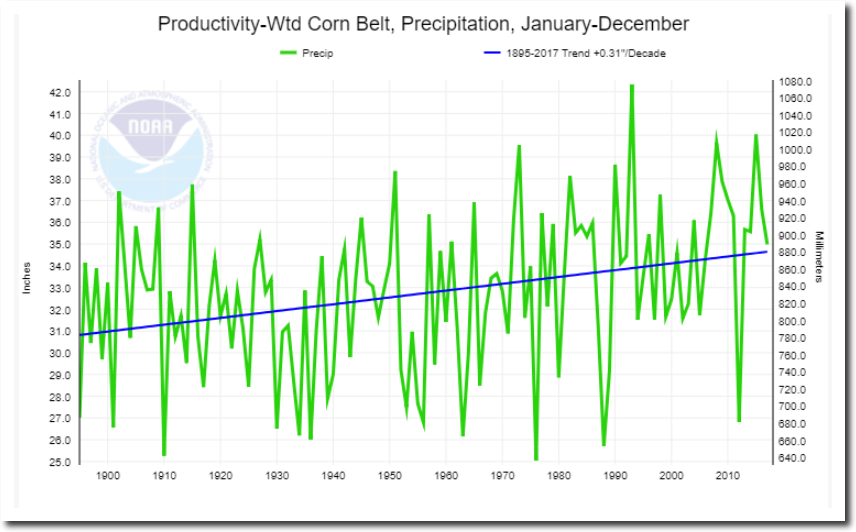
Climate at a Glance | National Centers for Environmental Information (NCEI)
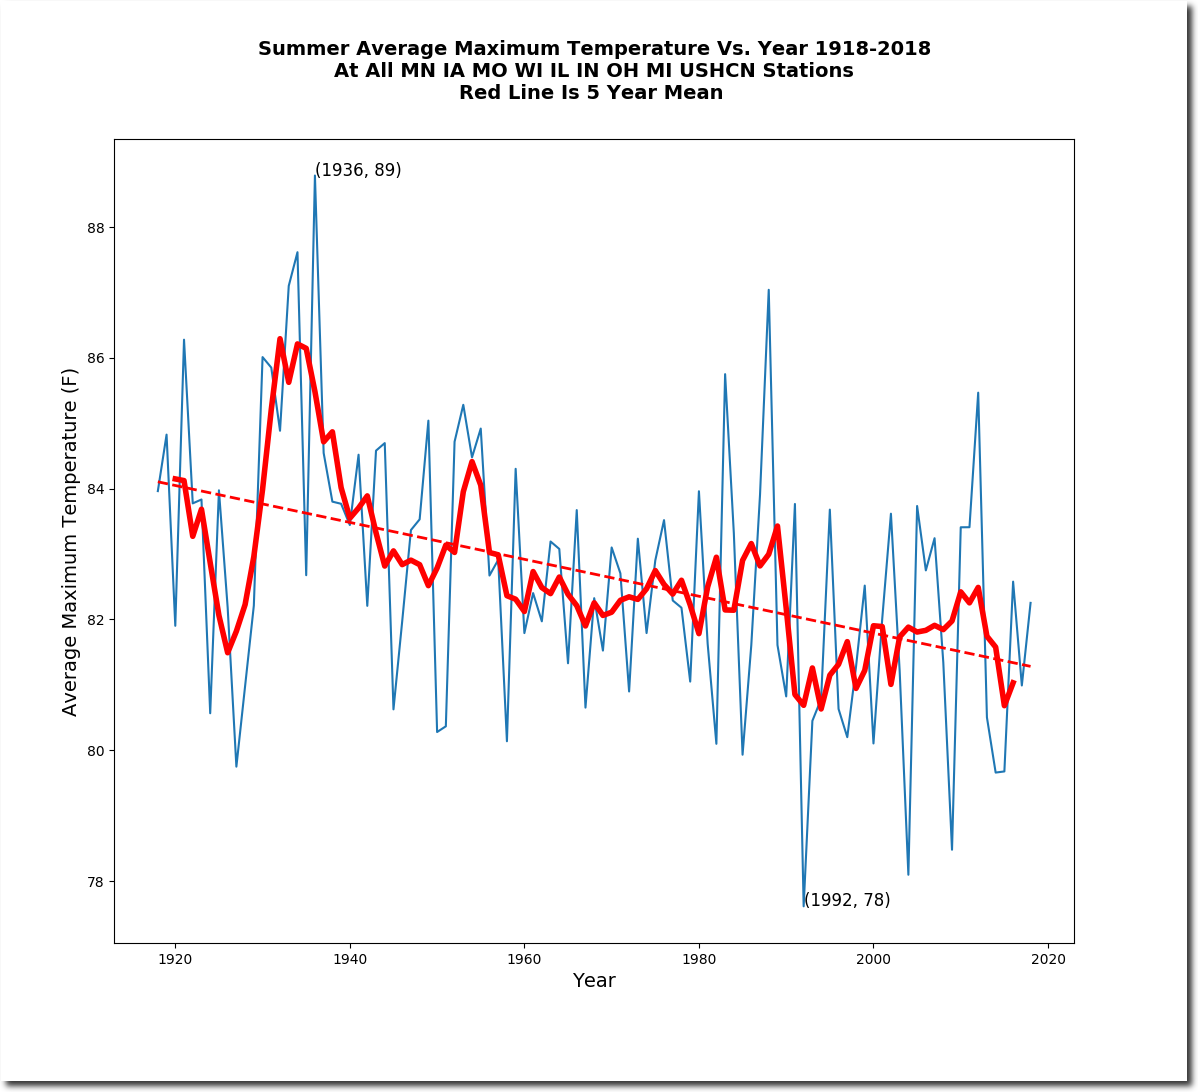
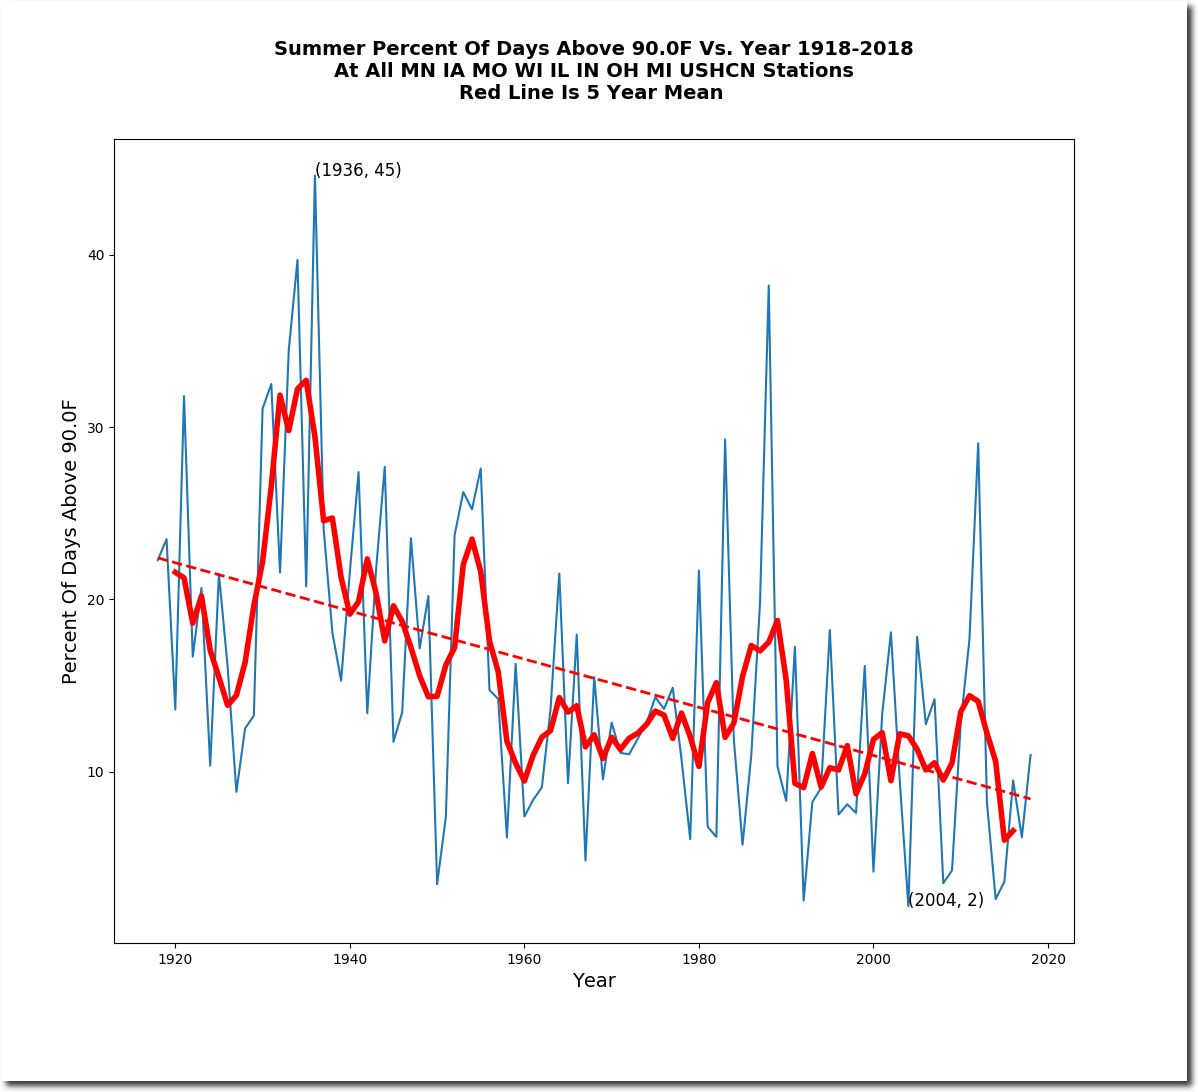
Midwest summer afternoons are getting cooler, and the frequency of hot days is declining.
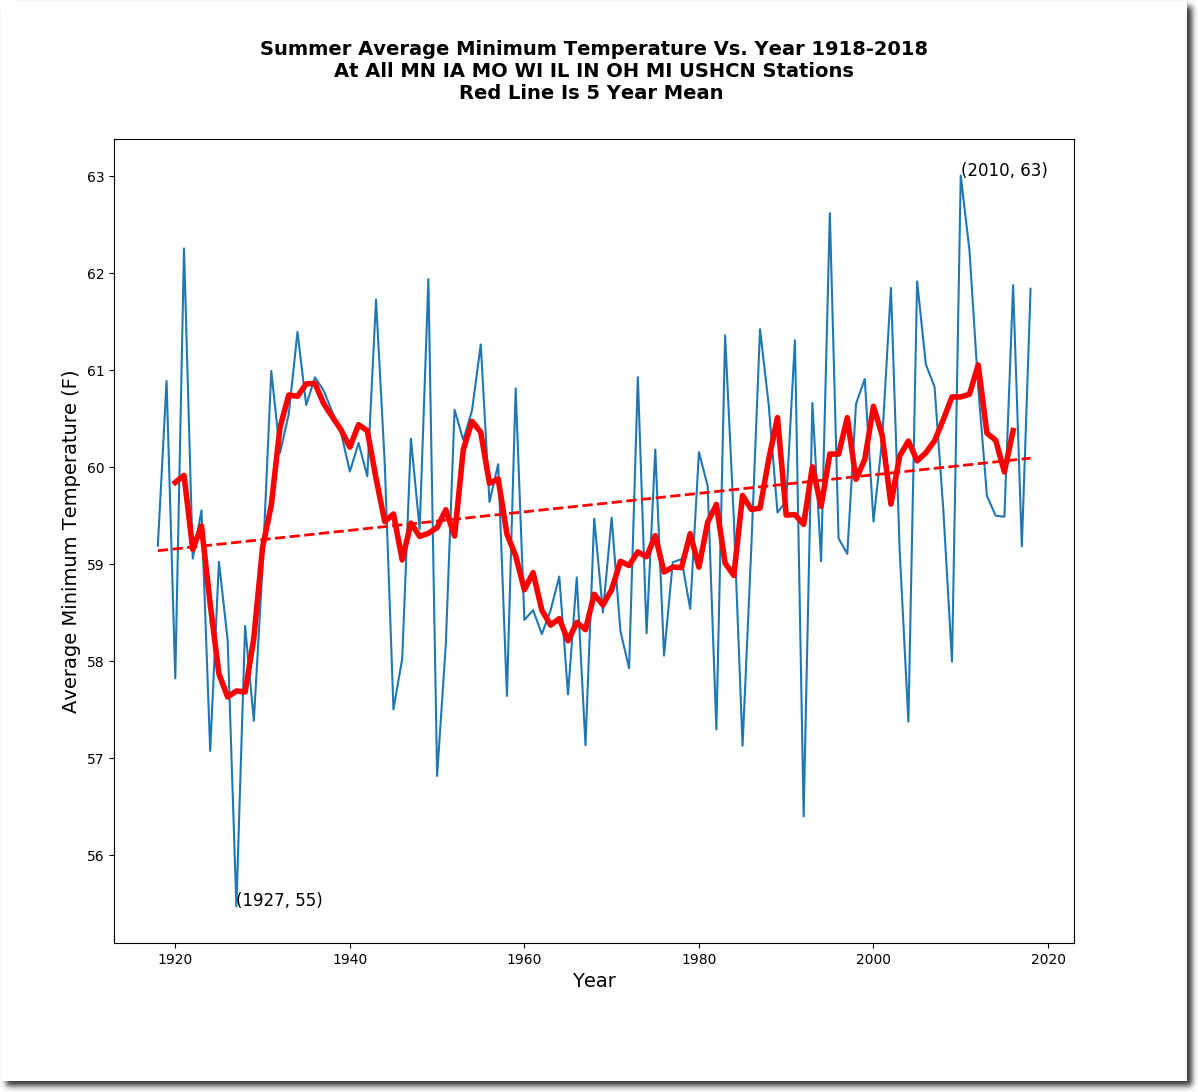
Midwest summer nights are about the same as they were 80 years ago. Corn likes warm nights.
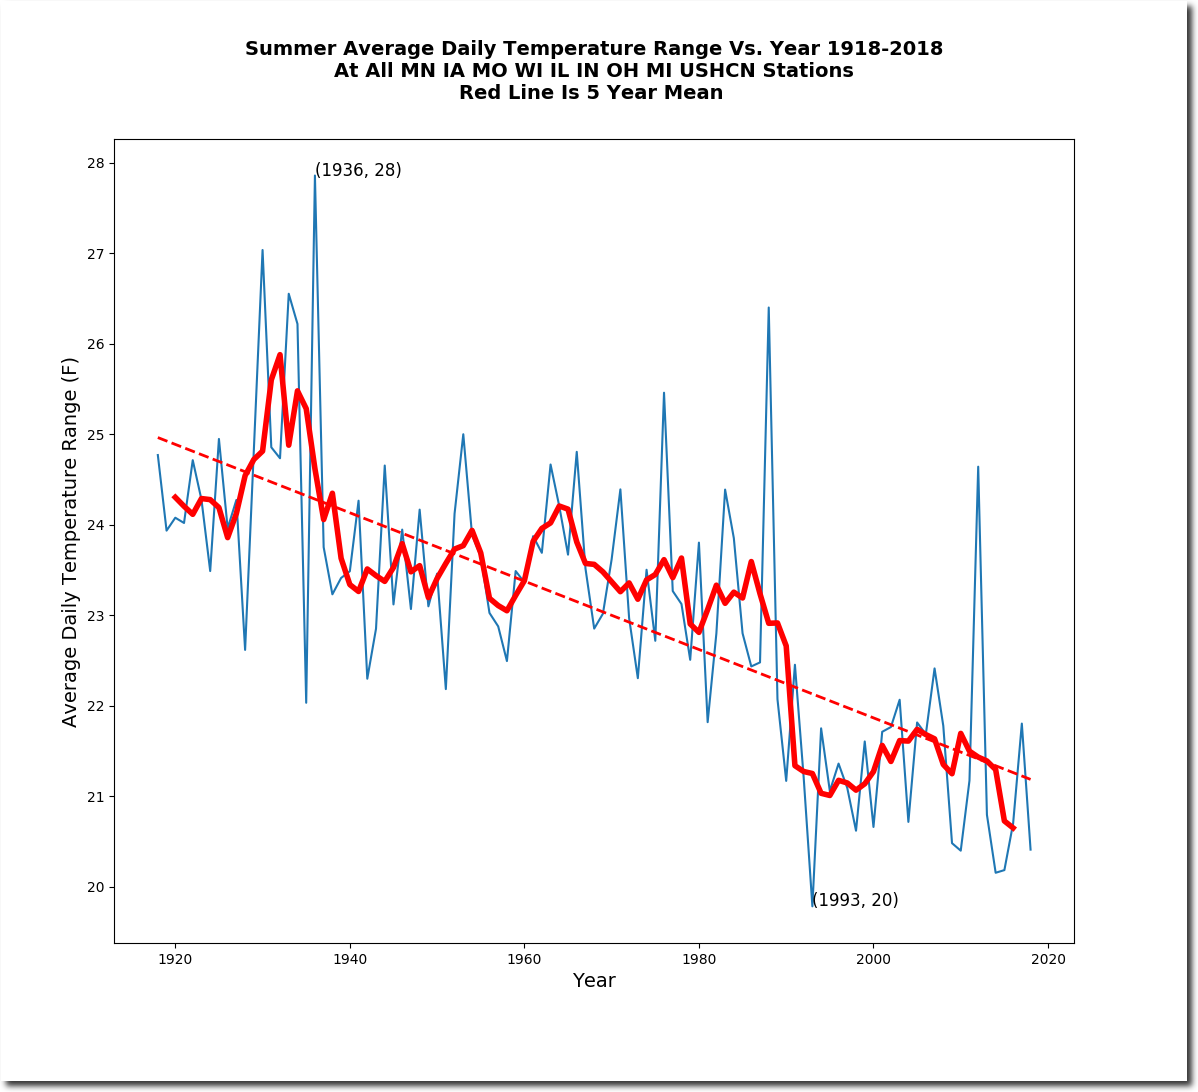
The average Midwest summer daily temperature range has dropped about four degrees, indicating a milder climate.
Coney Island, NY looks about the same as the first time I went there 60 years ago.


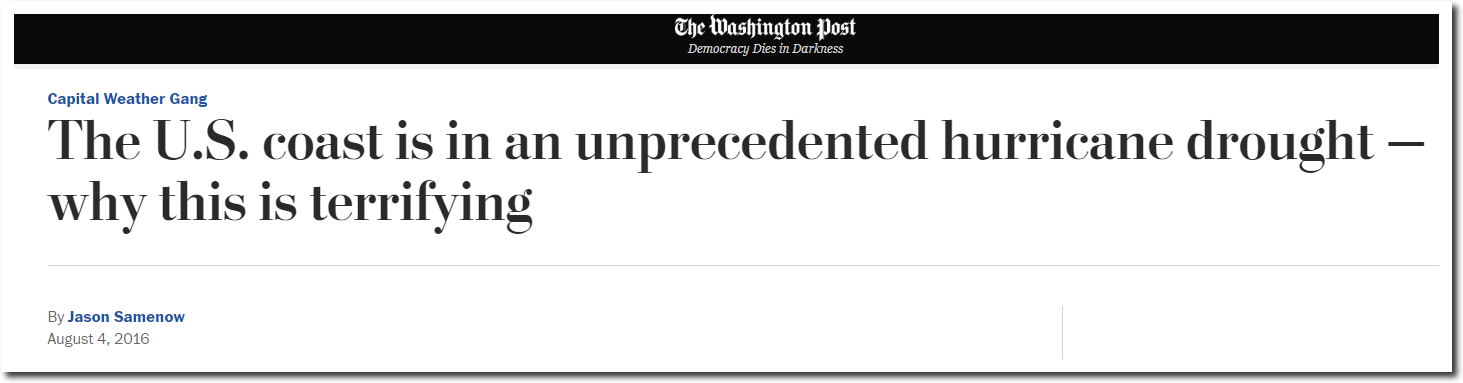
The press is now terrified by the lack of hurricanes, the exact opposite of what they were terrified about 30 years ago.
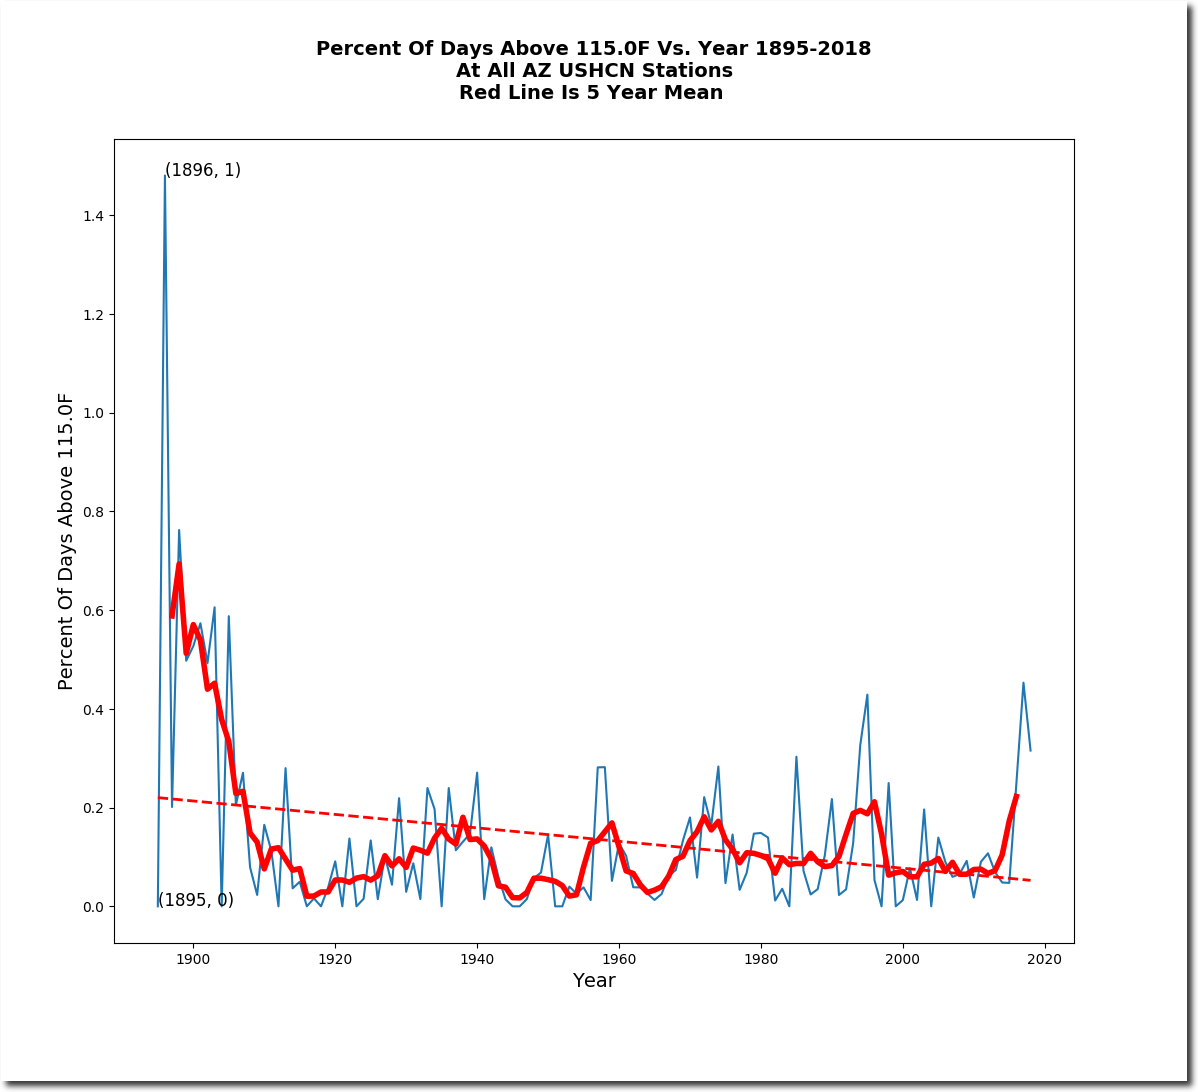
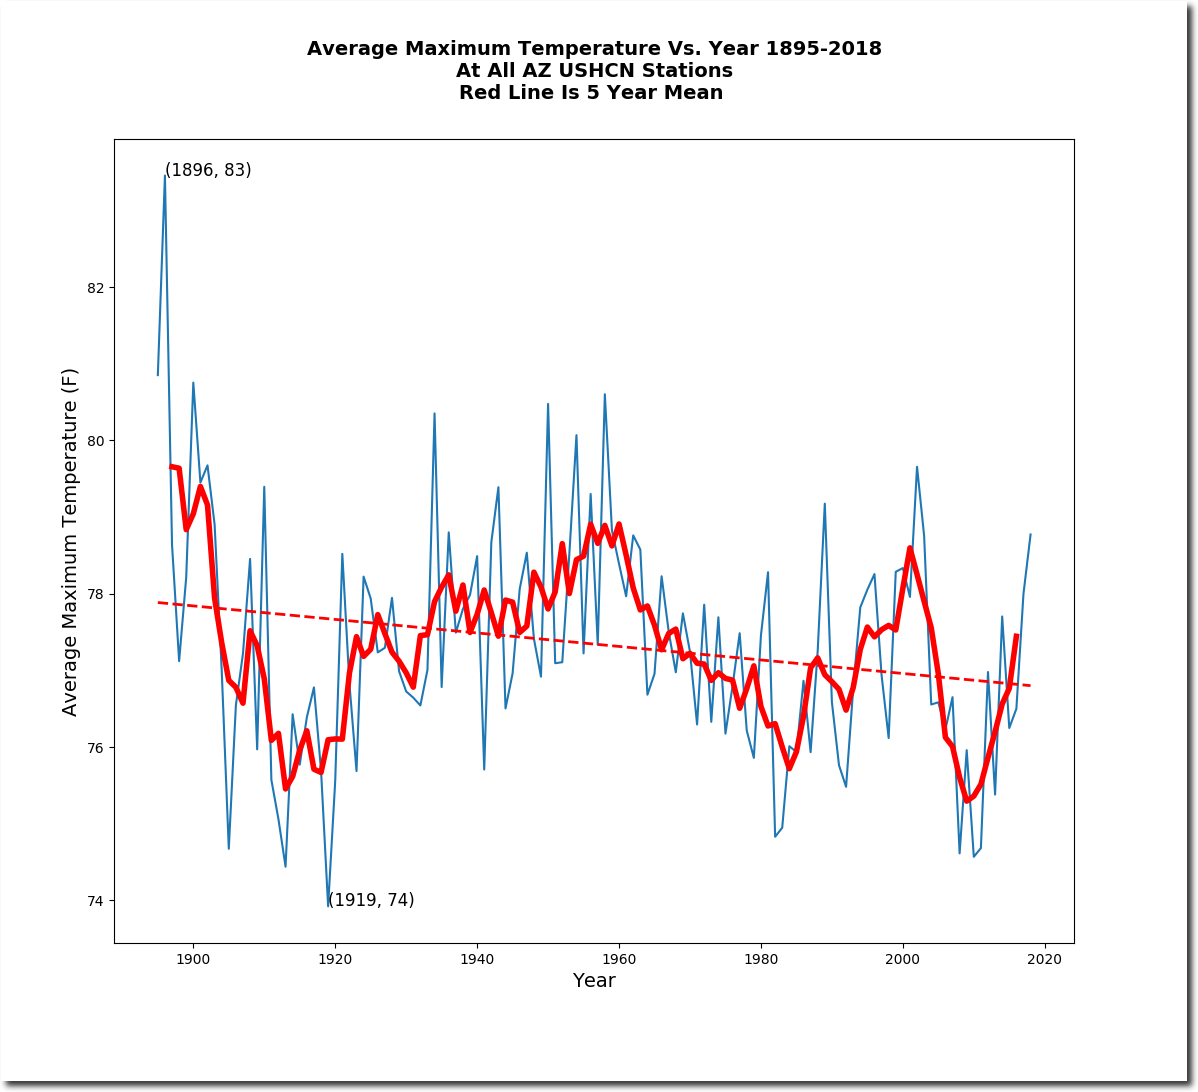
Arizona maximum temperatures and the frequency of summer days peaked in 1896, and have been declining ever since. I started school at ASU in 1974, at the peak of the ice age scare. That summer Phoenix set their record of eighteen consecutive days over 110 degrees.
And forest fire burn acreage is down 80% over the past eighty years.
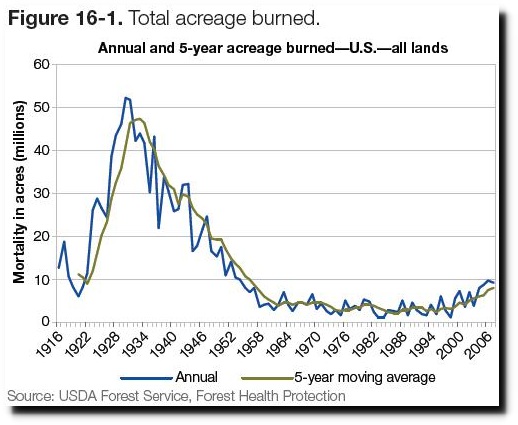
Indicator 3.16: Area and percent of forest affected by abiotic agents
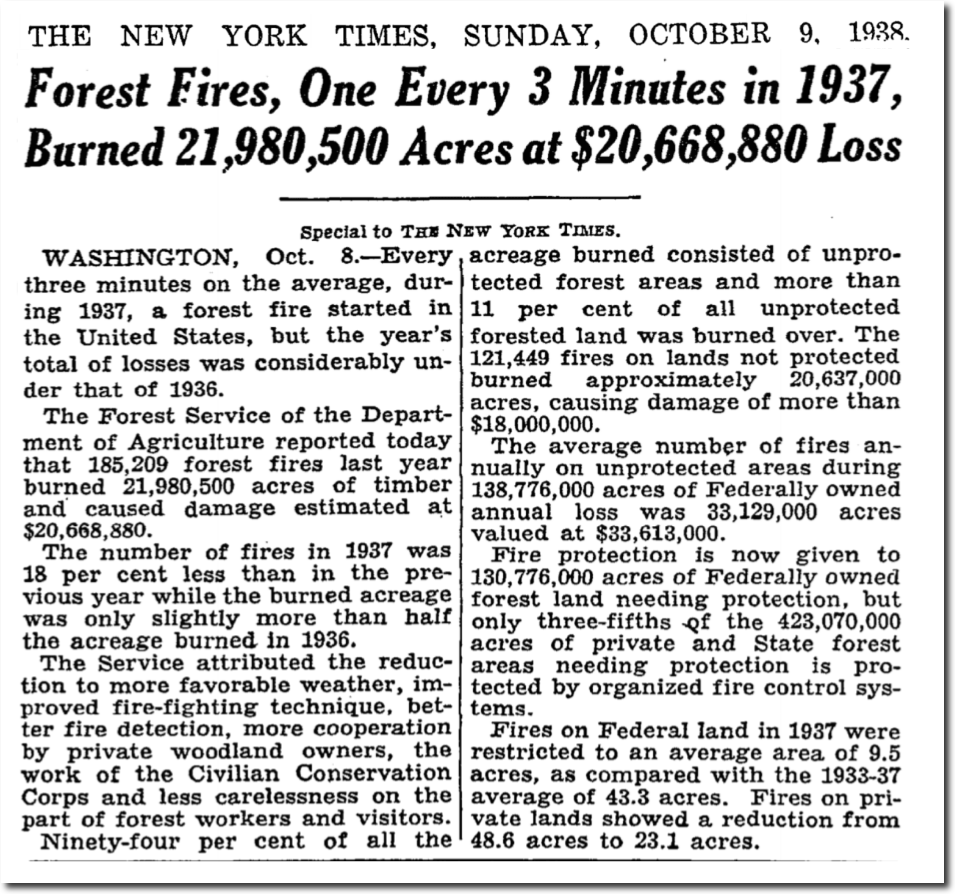
There were 185,209 fires in 1937, and more than 200,000 in 1936.
Nothing which climate alarmists believe has any basis in reality, but they continue pushing the same nightmare day after day, year after year, and decade after decade. Global warming belief is mental illness, not science.
The New York Times has become completely shameless with their climate fraud. They have a new web page which claims to show the increase in the number of 90 degree days “Than When You Were Born.”
The first place I tried it our was Martinsburg, West Virginia, which NOAA has data for back to 1926. I entered 1926 into the New York Times web page, and a disclaimer popped up saying they don’t have any data before the 1960’s.
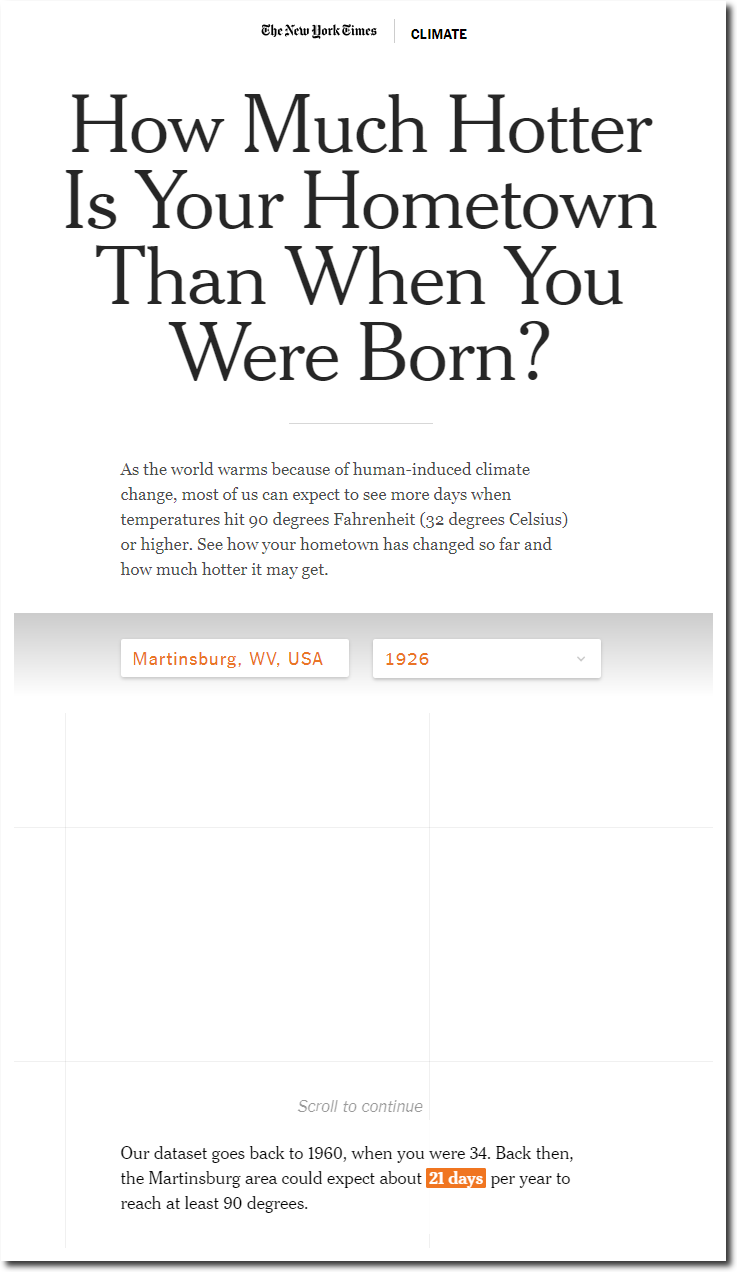
How Much Hotter Is Your Hometown Than When You Were Born? – The New York Times
Then they claim the number of 90 degree days has increased since 1960 from 21 to 27.
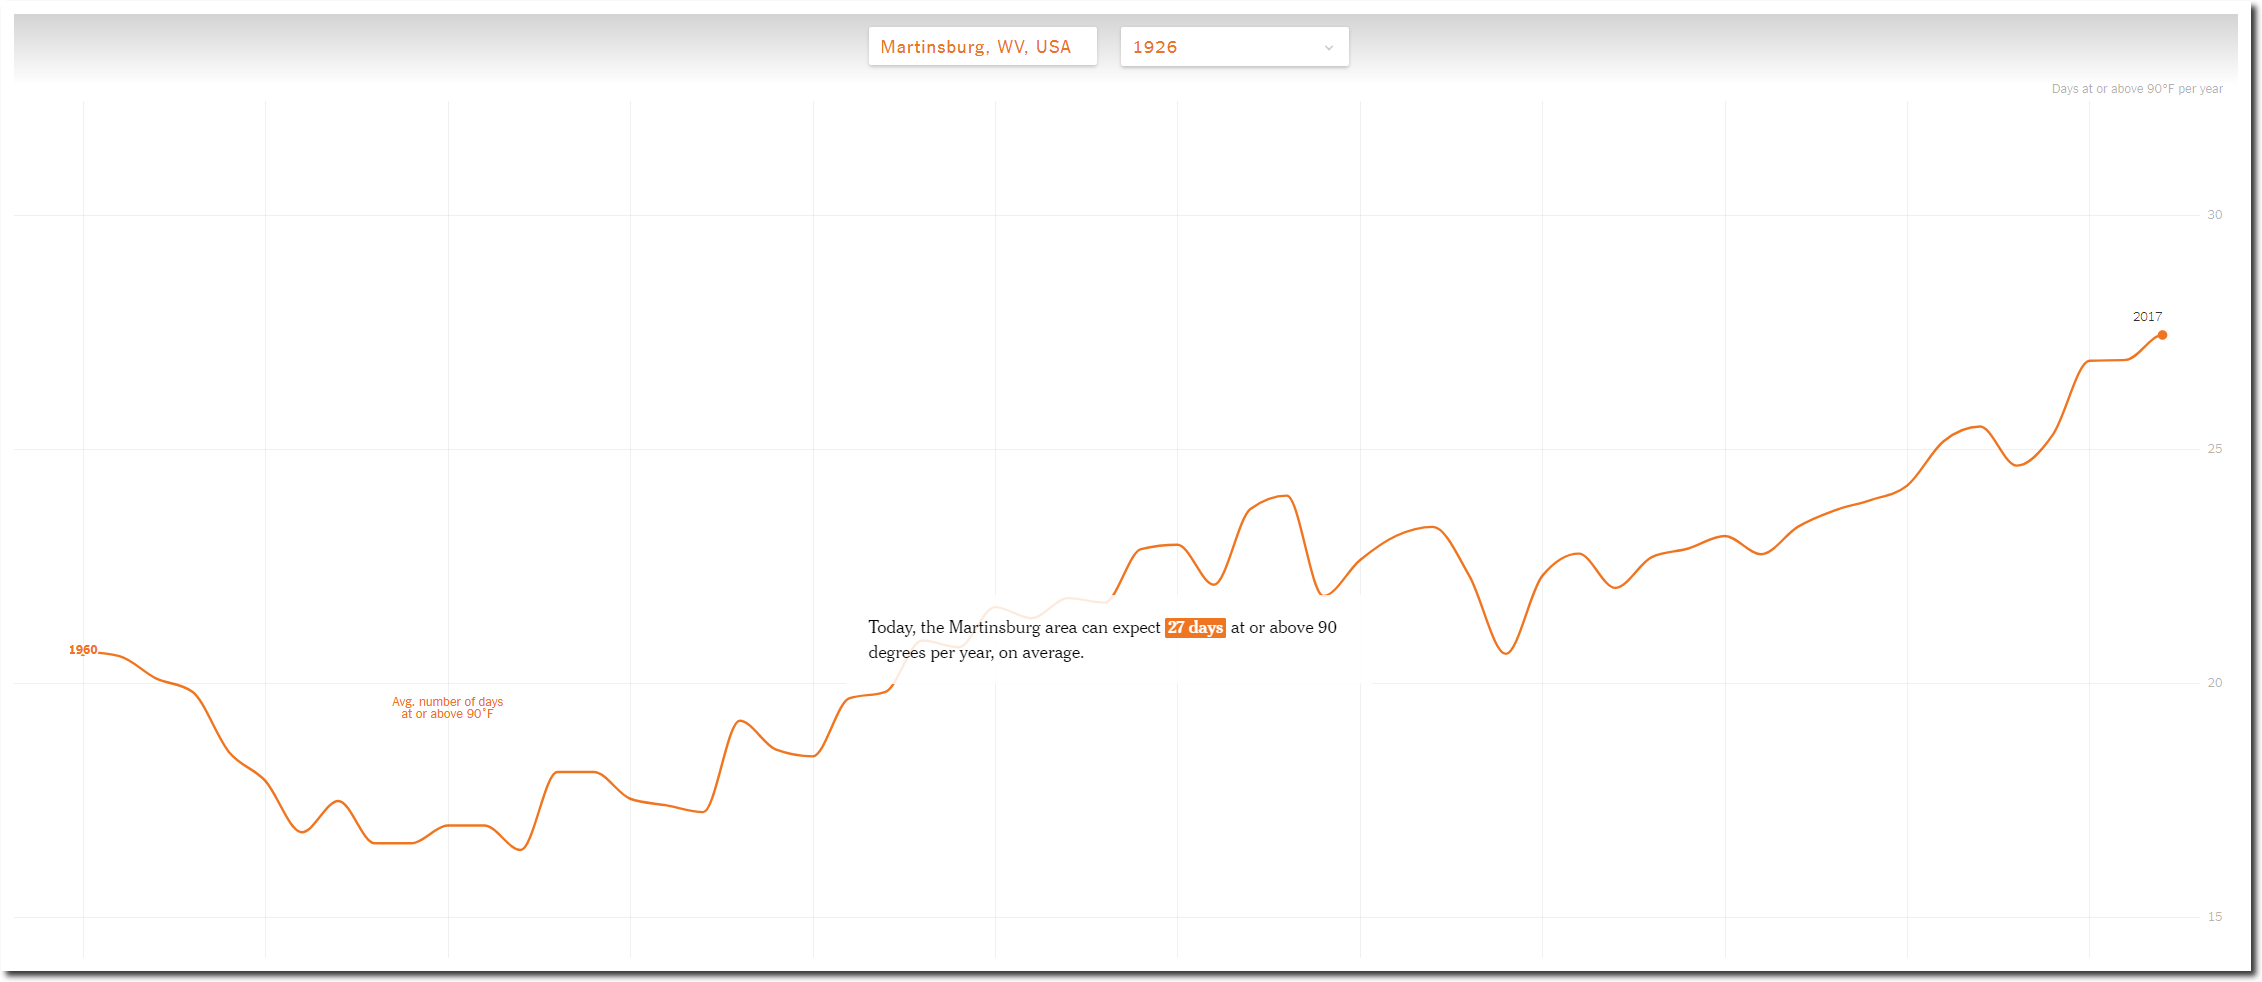
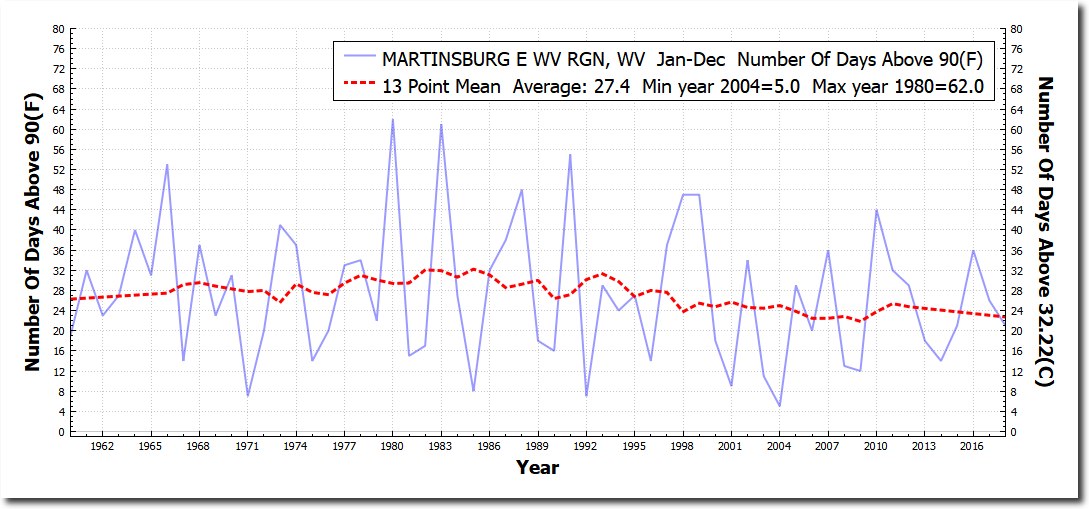
This is completely fraudulent. According to the official NOAA temperature record, the number of 90 degree days at Martinsburg has decreased from 25 to 23 days per year since 1960. The New York Times graph bears no resemblance to the actual data.
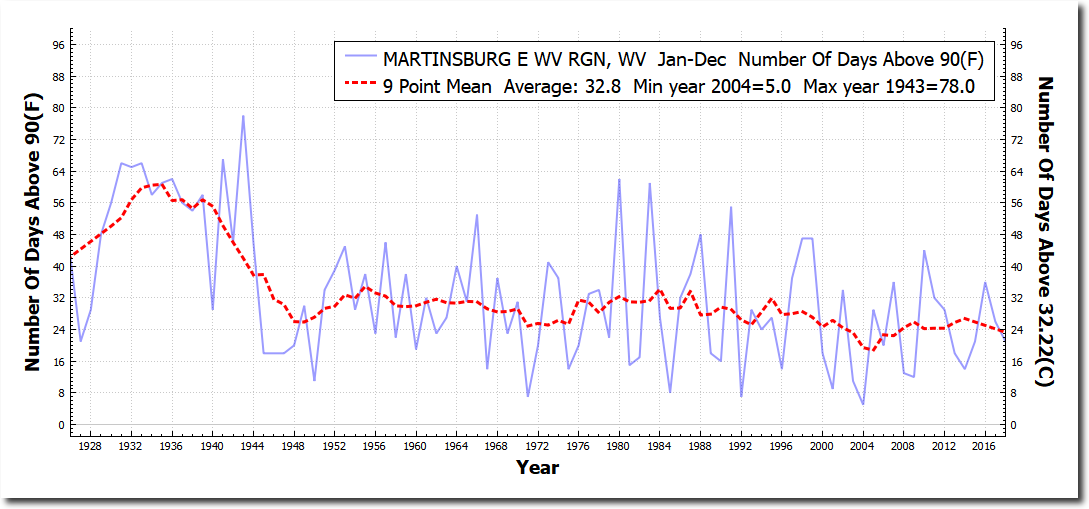
But the New York Times fraud gets much worse. Since the 1930’s, the frequency of 90 degree days is down by more than 60%. No wonder they cut out the pre-1960’s data, which is readily available from the NOAA web site.
Instead of showing the actual large decline in the frequency of 90 degree days, they show an imaginary projected increase based on computer models – which don’t understand the past, much less the future.
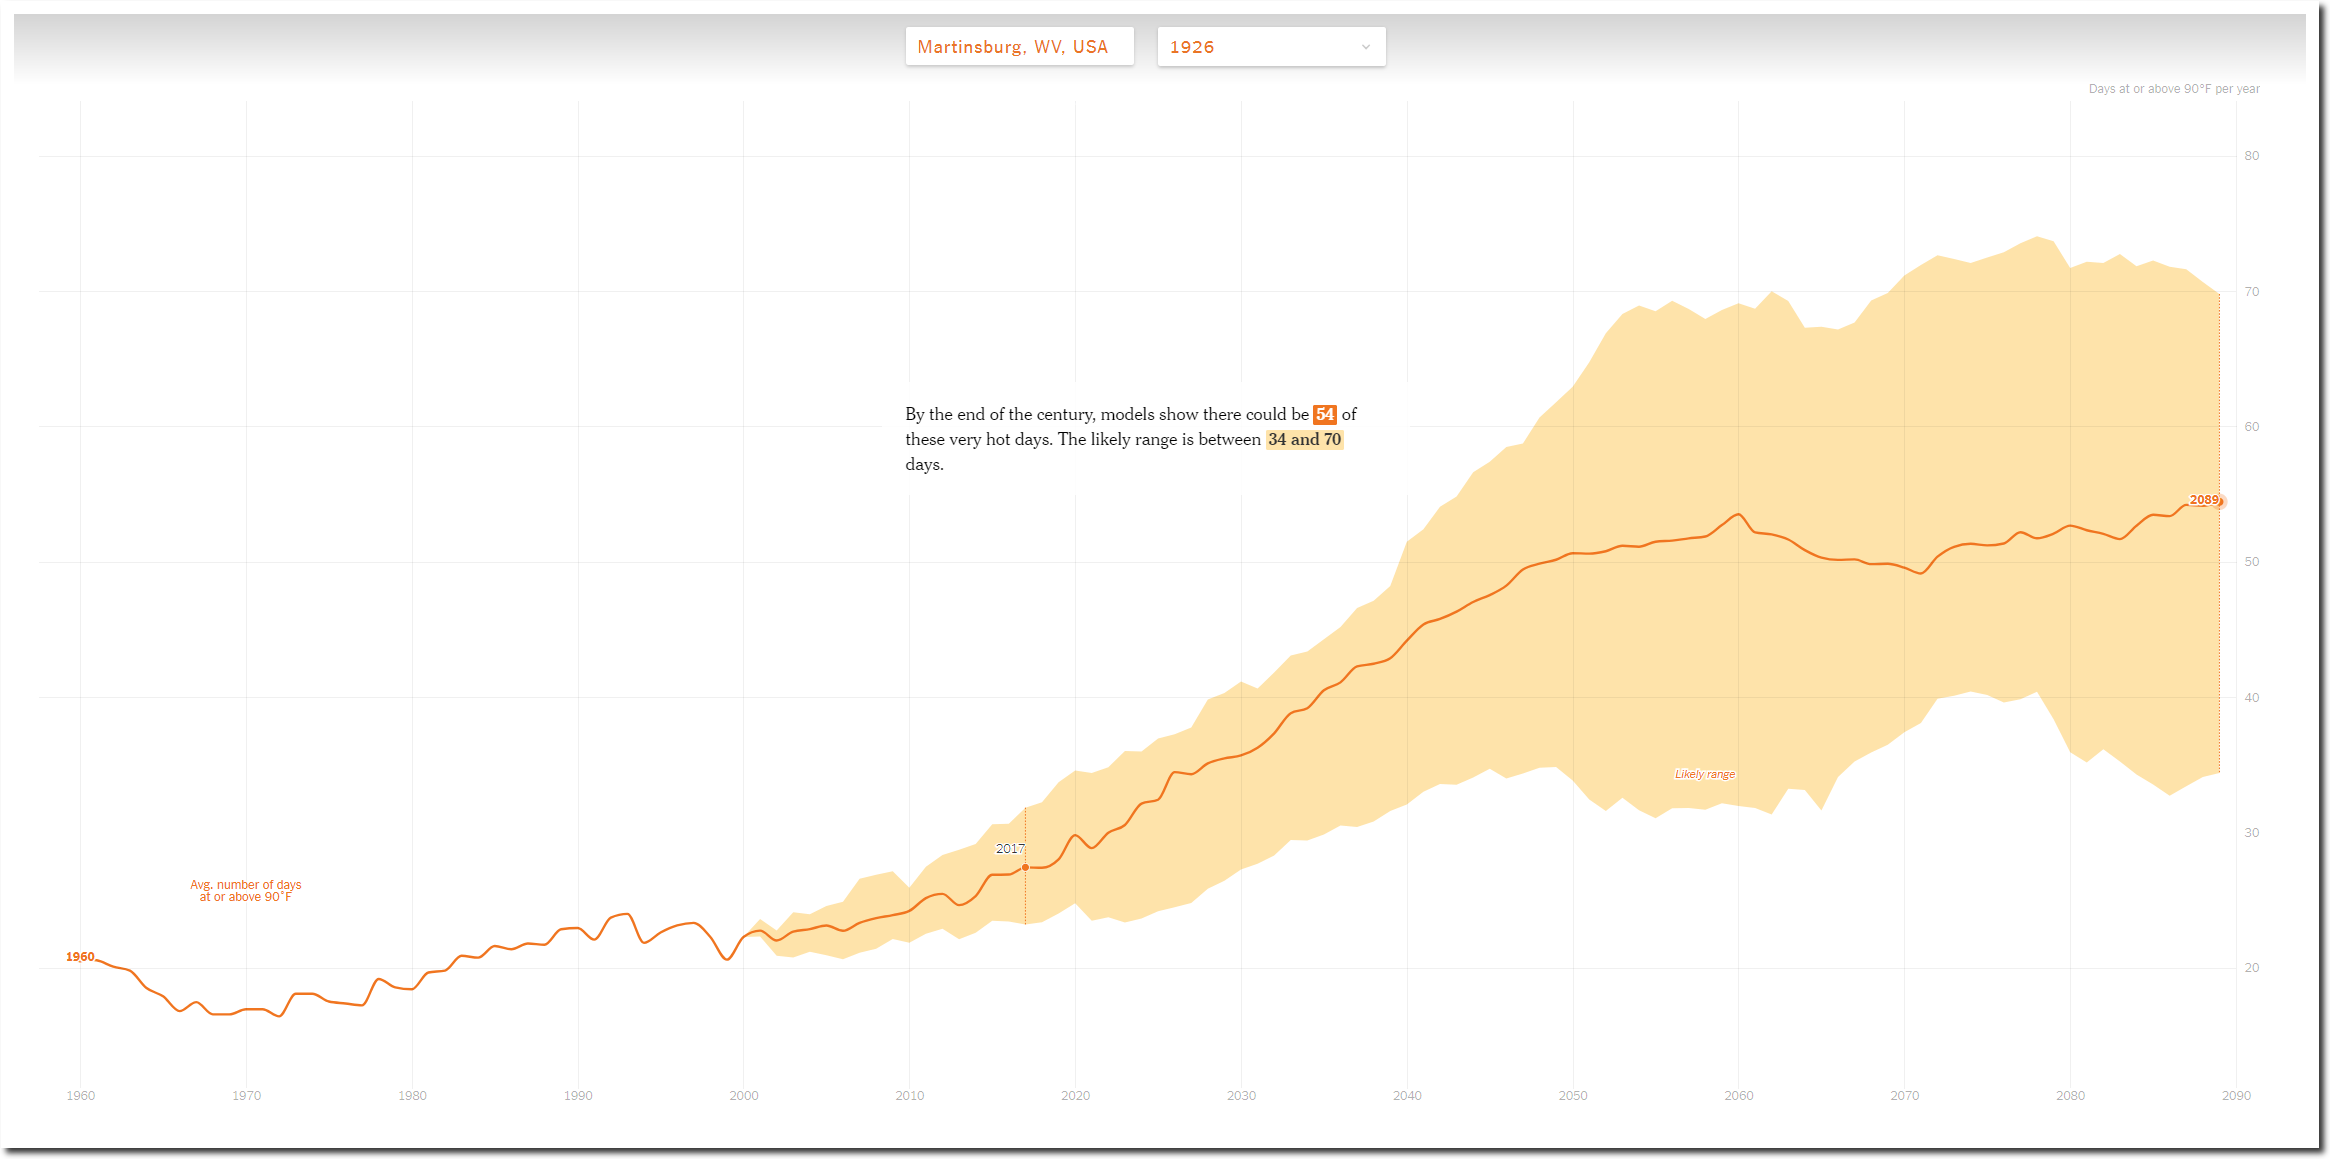
So why did the New York Times cut out all data before 1960? Because 1960 was the low point since 1895. Journalistic fraud doesn’t get much worse than that.
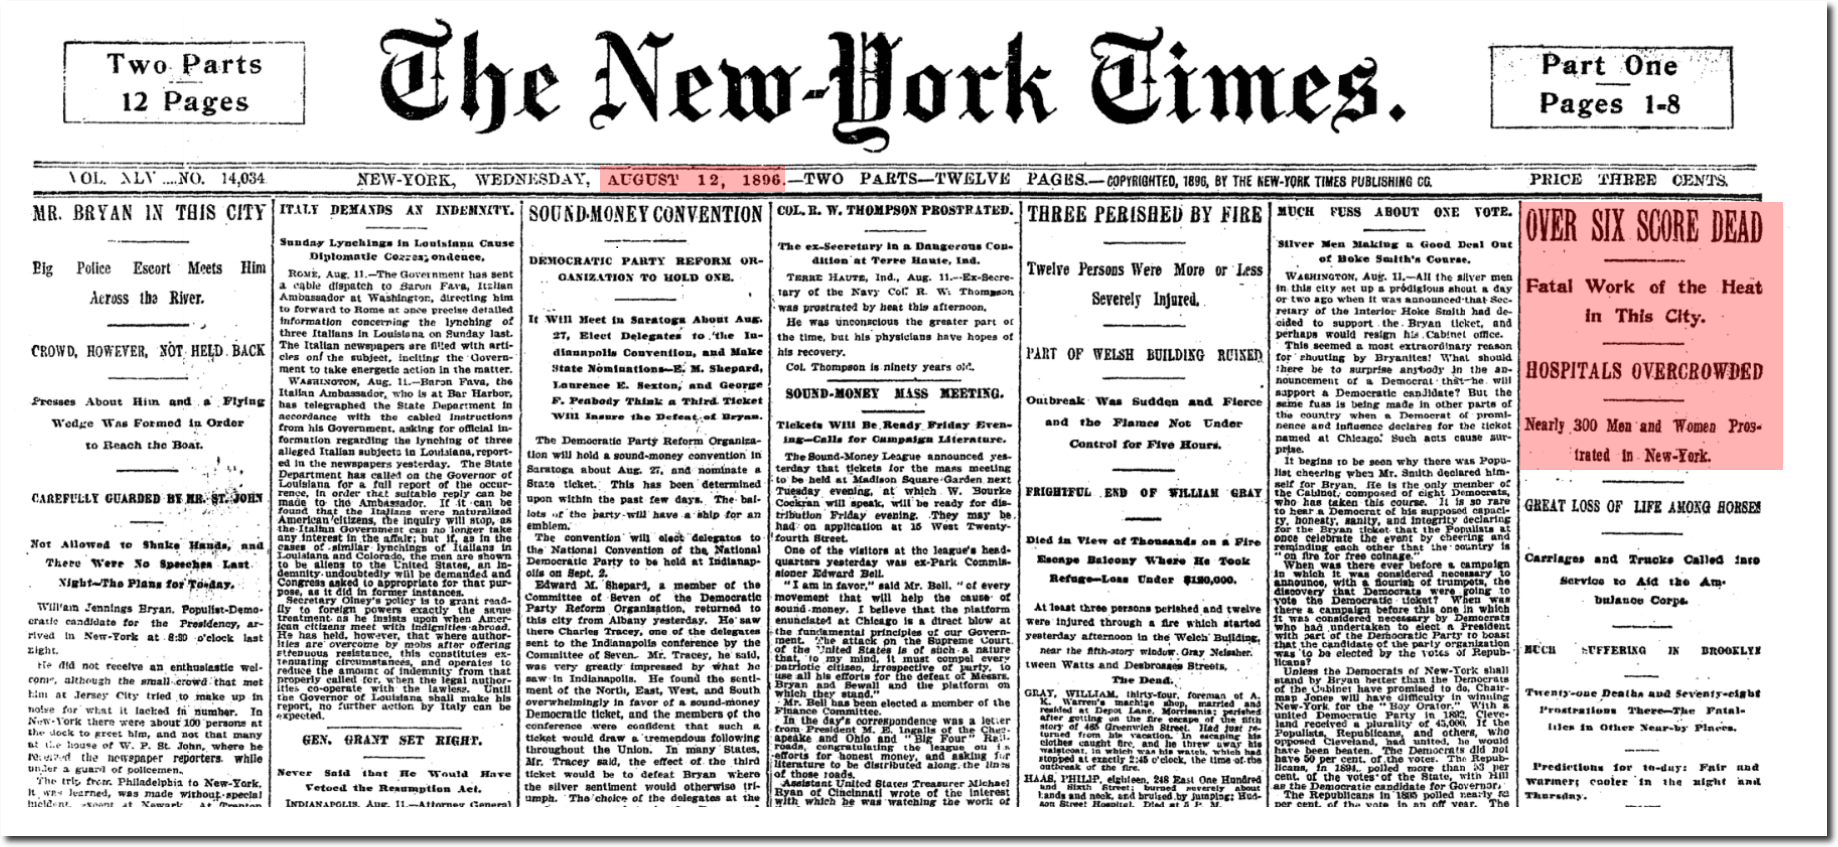
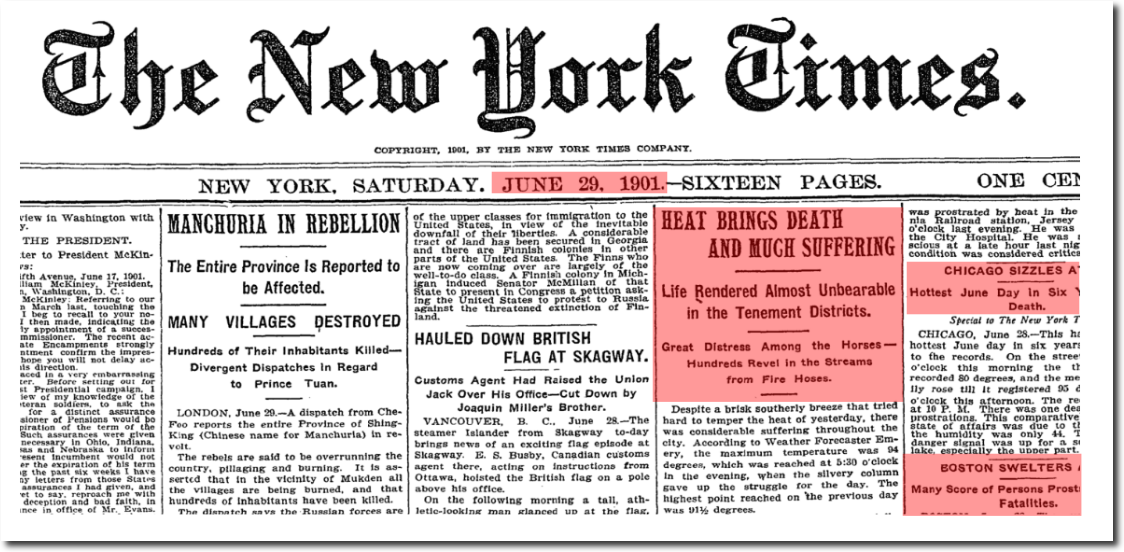
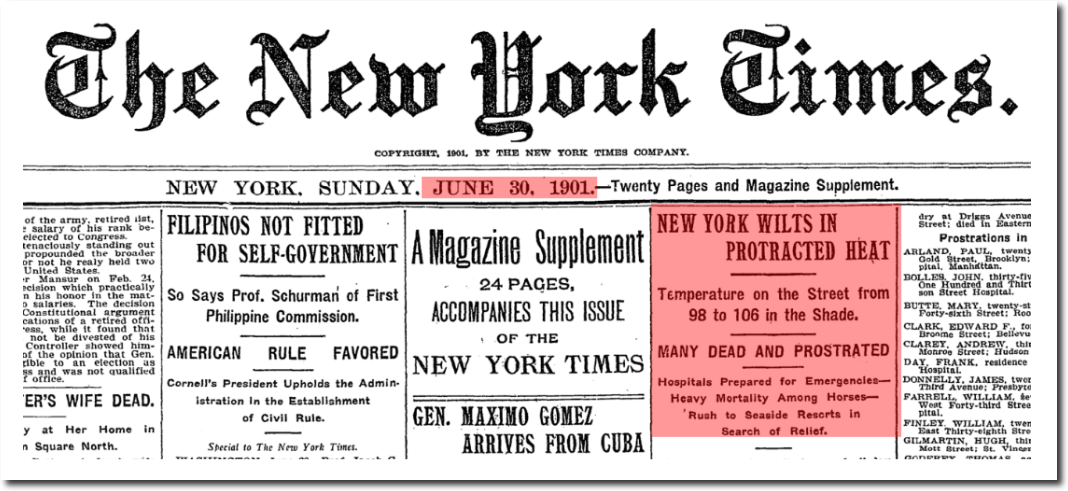
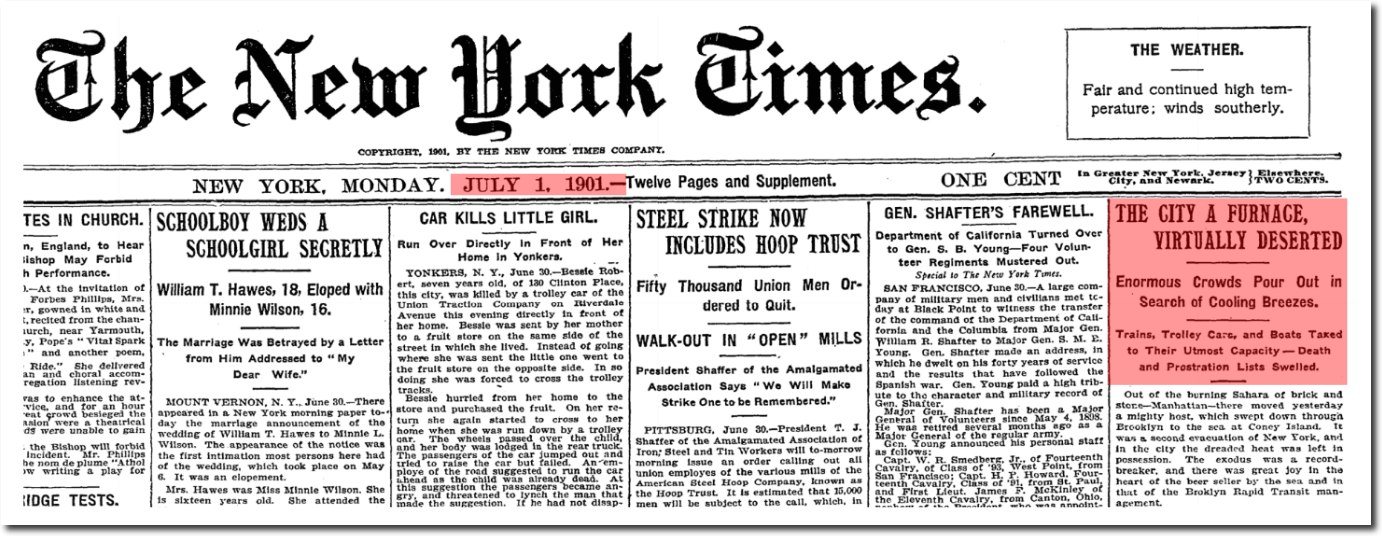
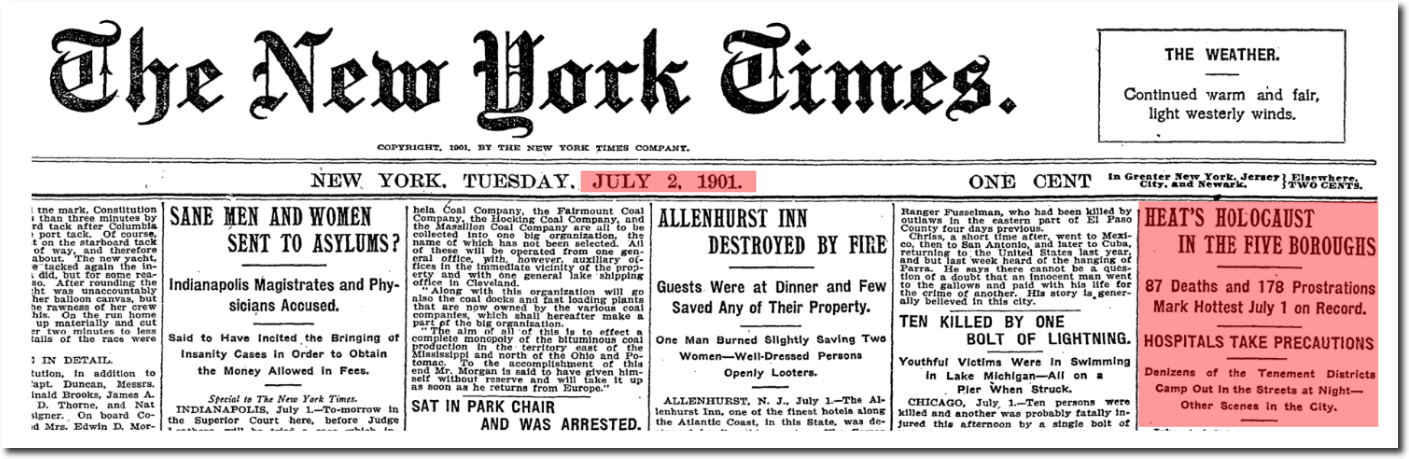
Temperatures were very hot before 1960, as reported in the New York Times.
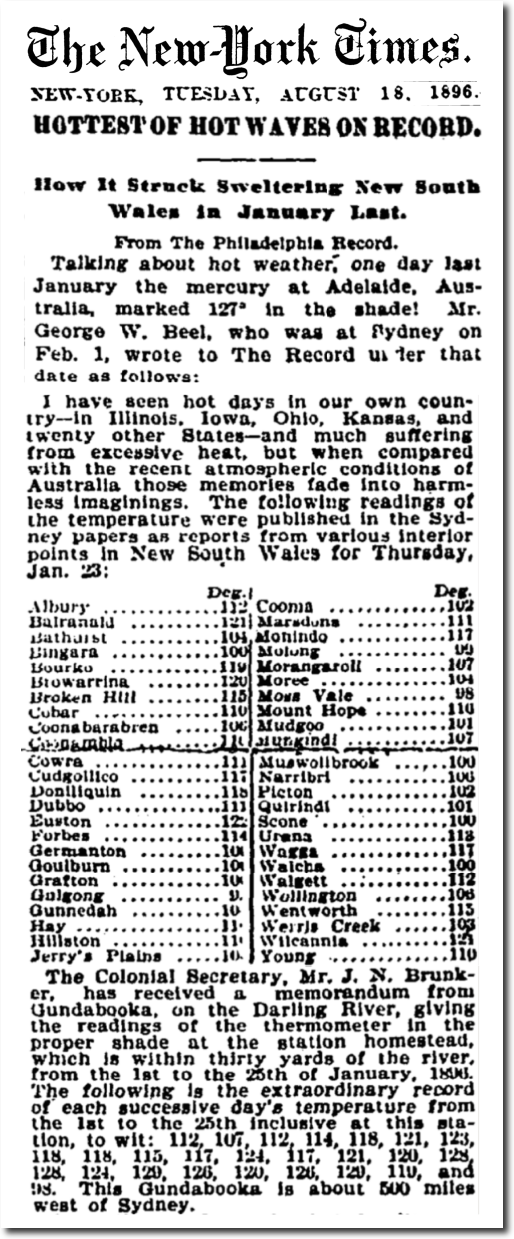
Australia also had their worst heatwave on record during January of 1896.
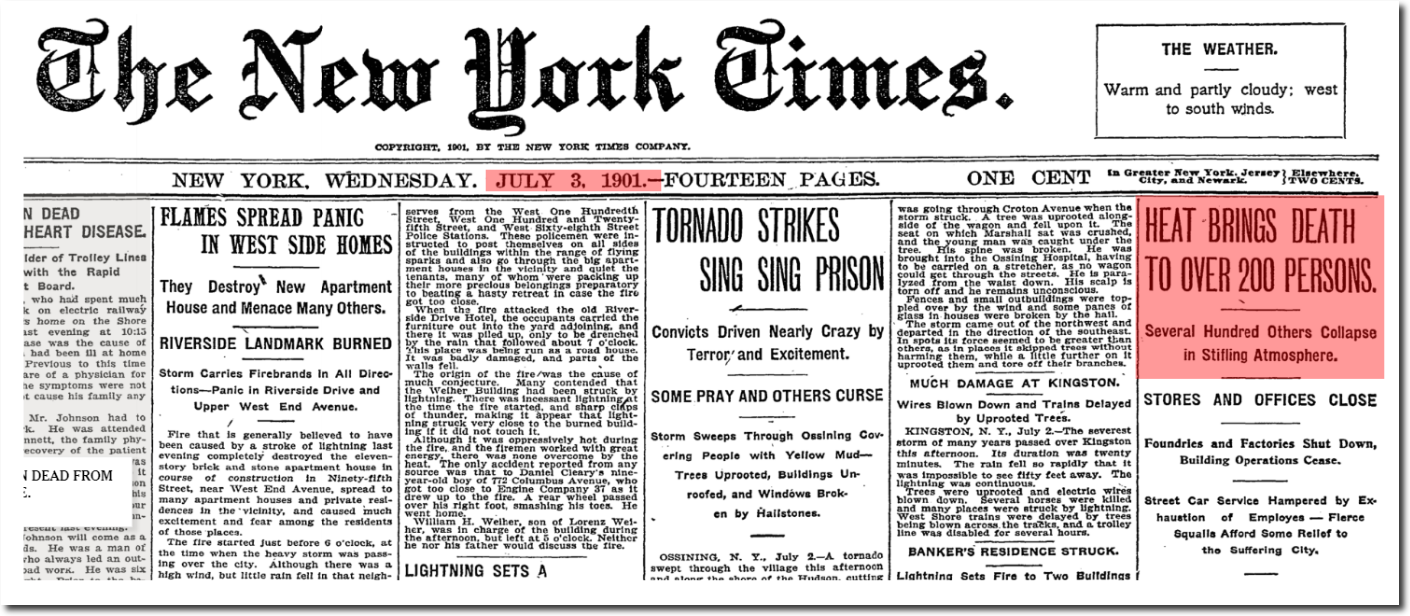
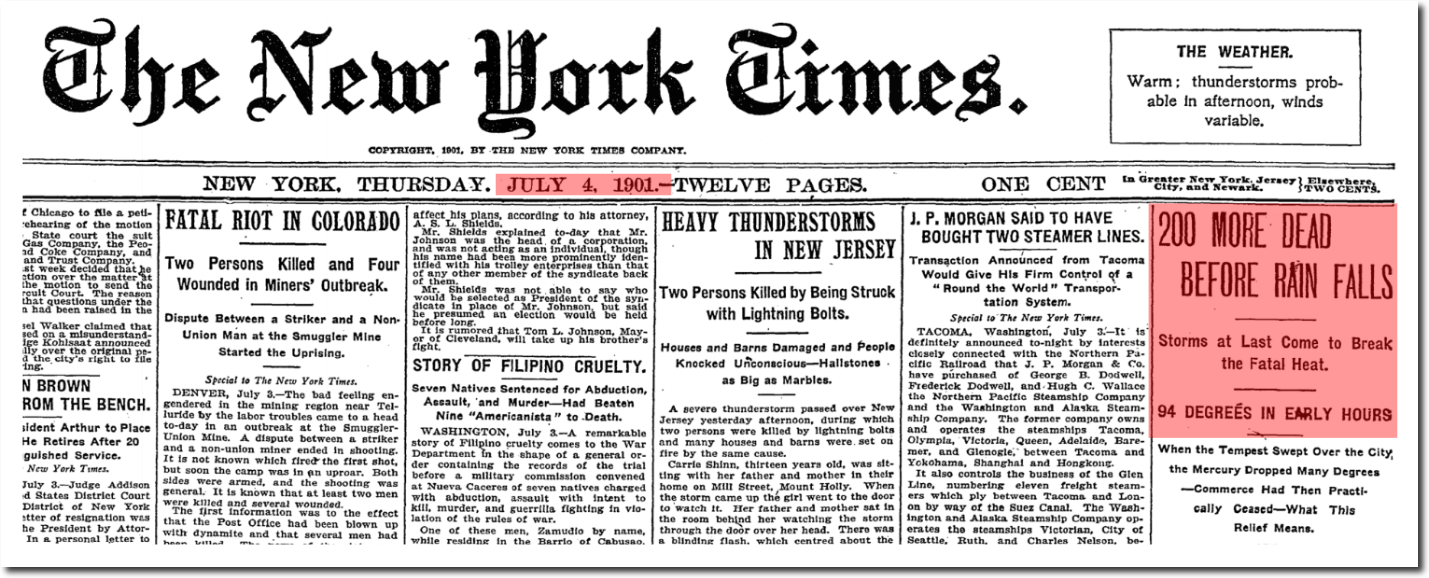
The 1901 heatwave killed thousands of people.
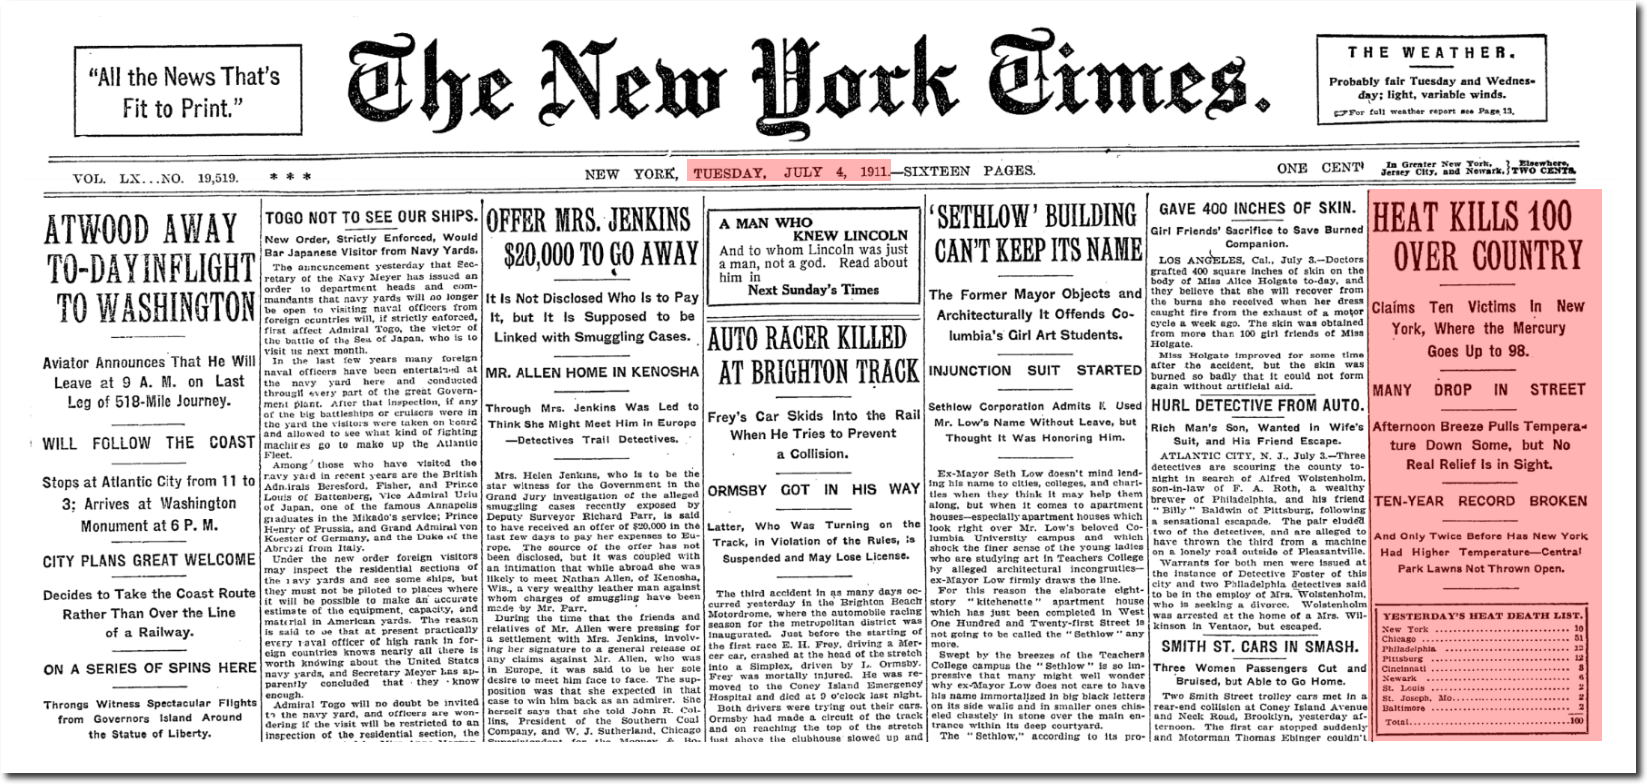
The 1911 heatwave killed thousands of people in New England and across the country.
Soviet Pravda had an 80% rule. Eighty percent of their propaganda had to be credible. The New York Times is operating far below the old Soviet standard.
“Who controls the past controls the future. Who controls the present controls the past.”
? George Orwell, 1984
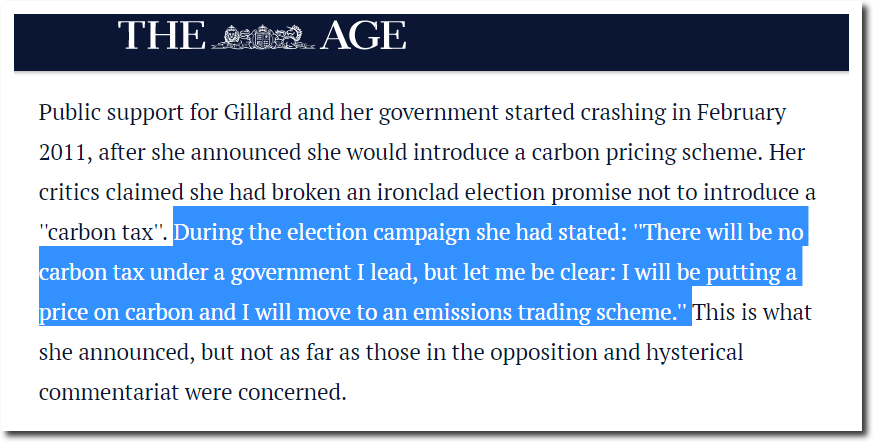
Usually I focus on how the climate mafia rewrites historical climate data, but they are just as willing to rewrite people’s words. On the eve of the election August 16, 2010, Julia Gillard said “There will be no carbon tax under the government I lead.”
Six months later she introduced a carbon tax.

Gillard unveils carbon price details – ABC News (Australian Broadcasting Corporation)
She wasn’t quite as good at lying as her boyfriend Barry.


So the press simply rewrote what she said, adding “but let me be clear: I will be putting a price on carbon and I will move to an emissions trading scheme.”
In his sights: Covert Kevin’s mission to get Julia
The “but let me be clear” phrase was actually an Obama favorite. Gillard never said anything like that. Here is the actual conversation.
There seems to be no limits on how corrupt and dishonest the left and their propagandists in the press are willing to be.