Early in life I had noticed that no event is ever correctly reported in a newspaper.
George Orwell
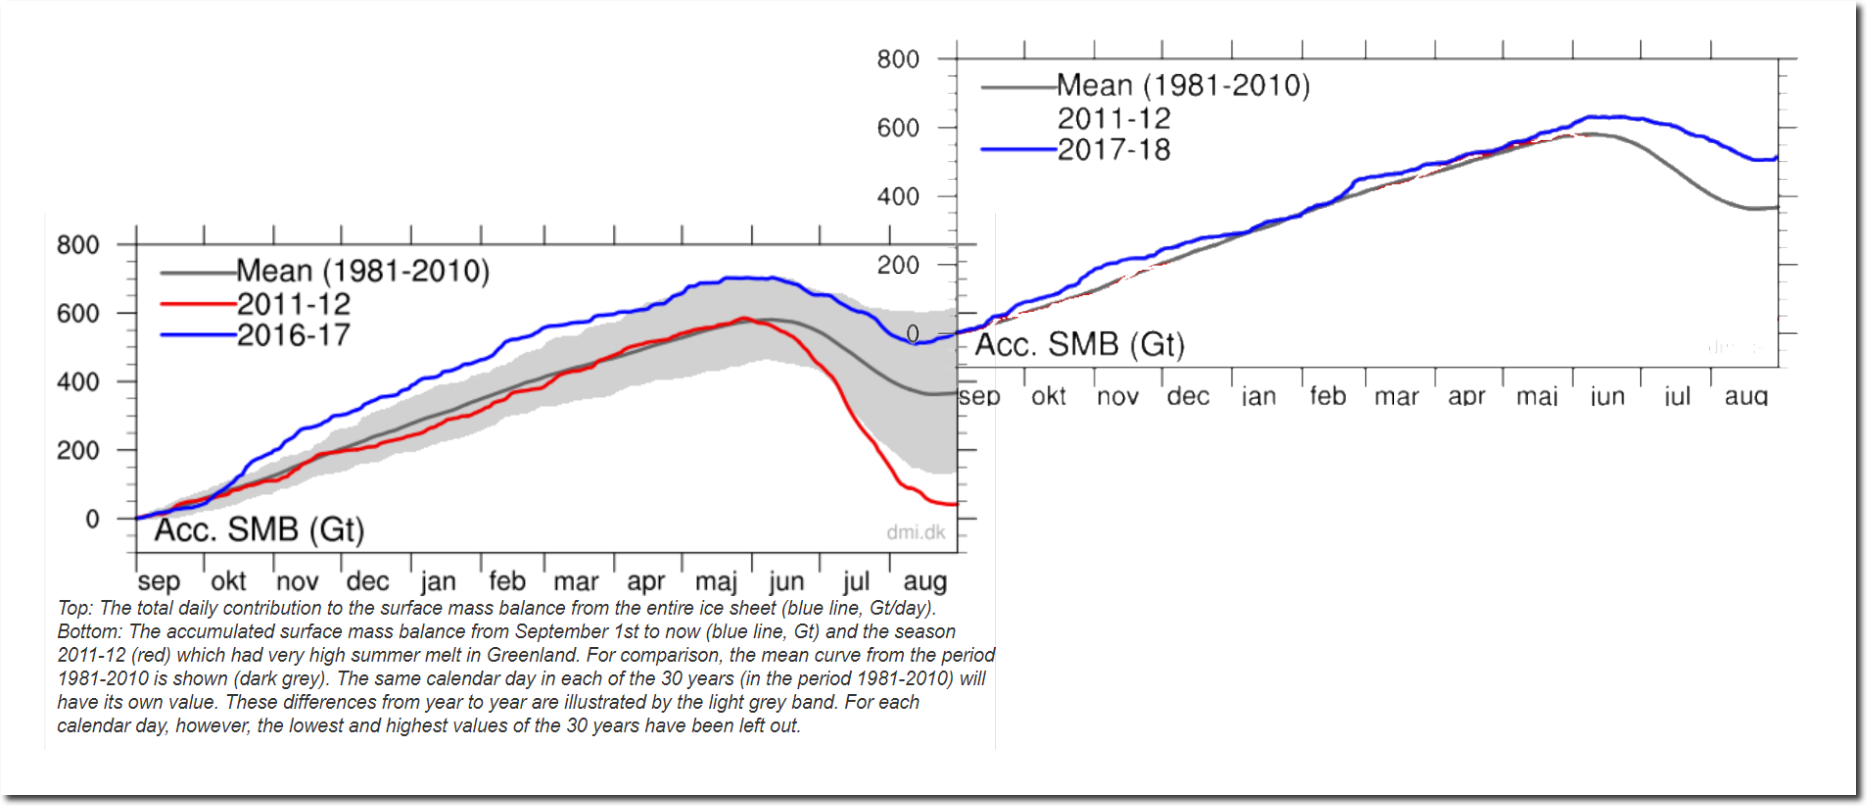
Summer is over, and Greenland’s surface has gained 510 billion tons of ice over the past year – about 40% above normal. The surface mass budget is snow/ice accumulation minus melt. It does not include ice loss caused by glaciers flowing to the sea, which is very difficult to measure, and is driven by processes which have little to do with the current climate.
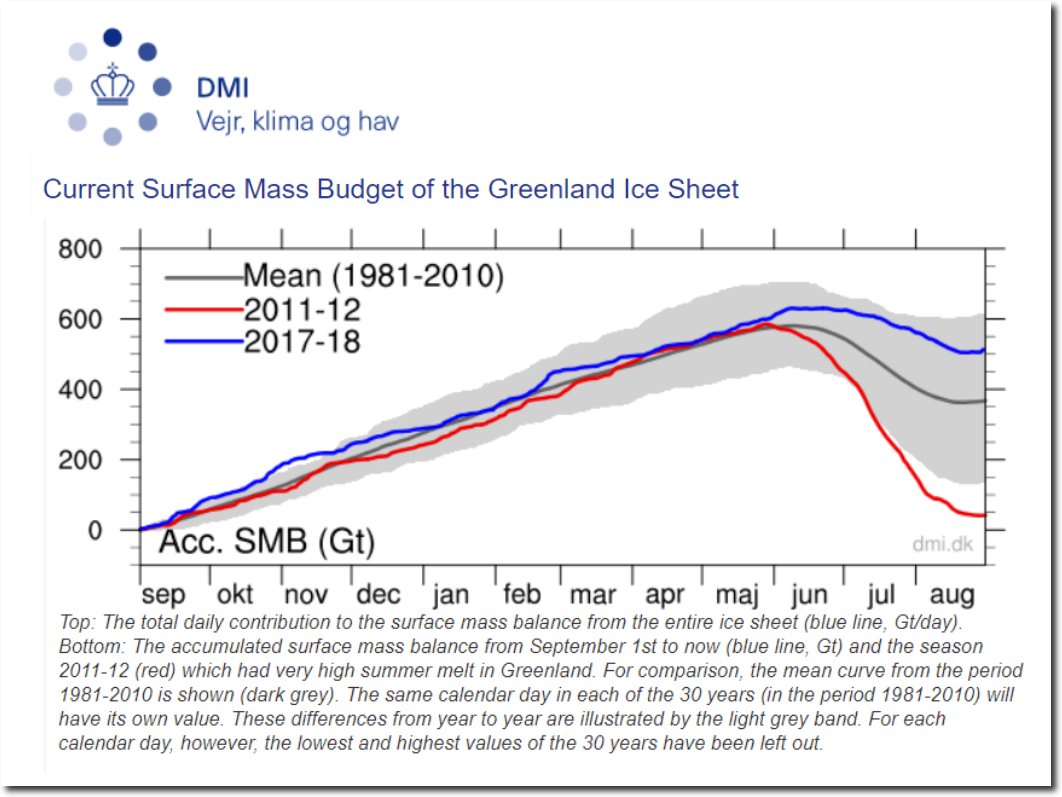
Greenland Ice Sheet Surface Mass Budget: DMI
Last year Greenland gained a little more ice, about 50% above normal.
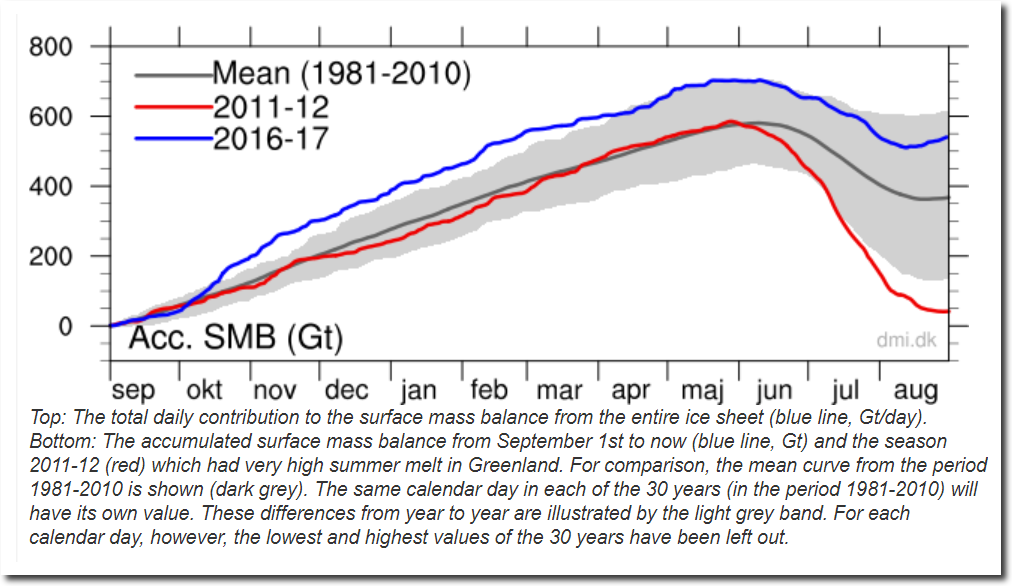
Greenland Ice Sheet Surface Mass Budget: DMI
The trajectories were very different last year and this year, but the final result was about the same.
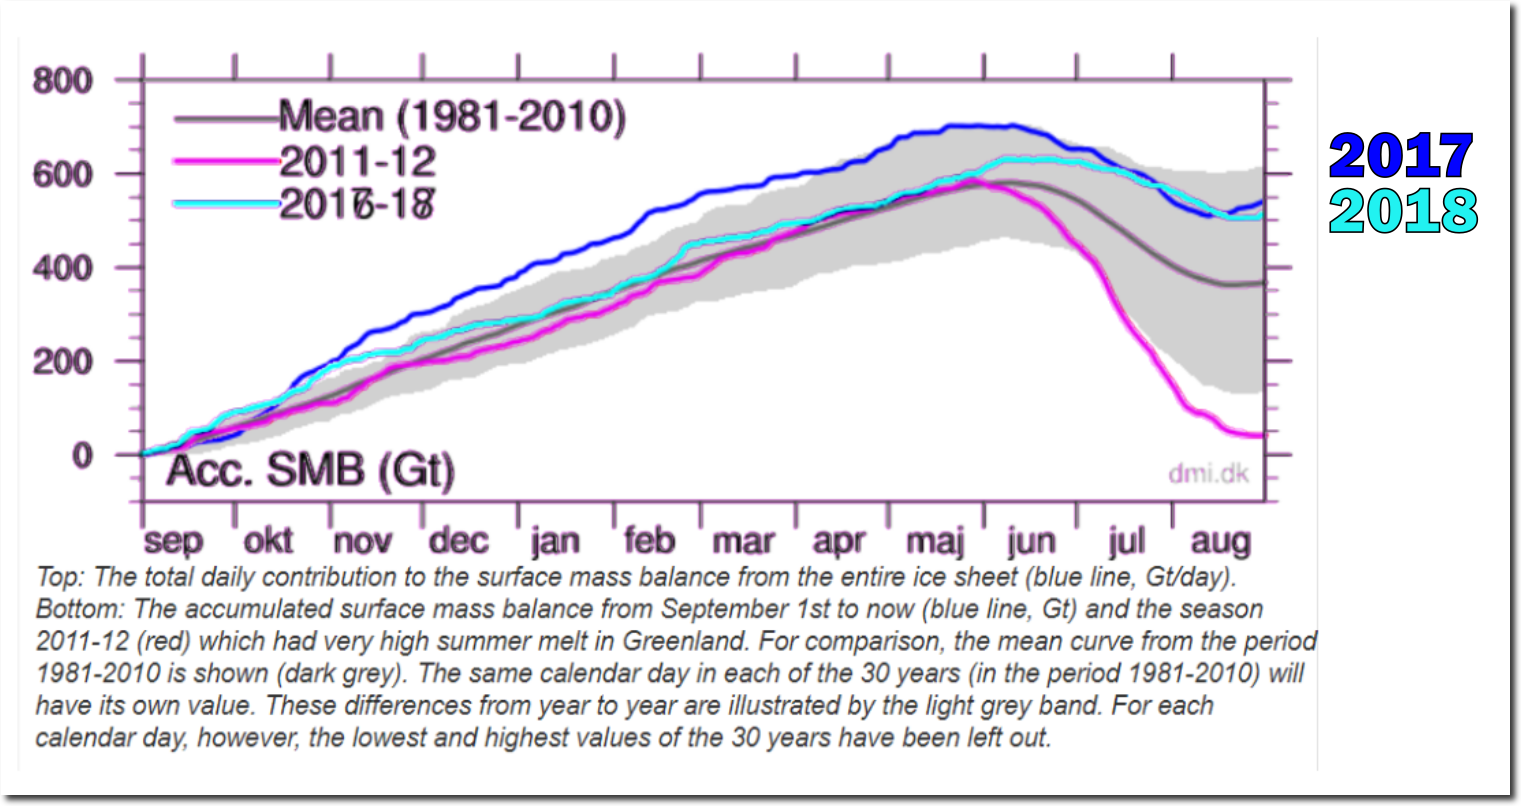
Lining the two graphs up side by side, you can see the more than one trillion tons of ice which Greenland’s surface has gained over the past two years.
Last year, the Danish Meteorological Institute reported on the gain in ice, and blamed it on Hurricane Nicole. I wonder what their excuse will be this year?
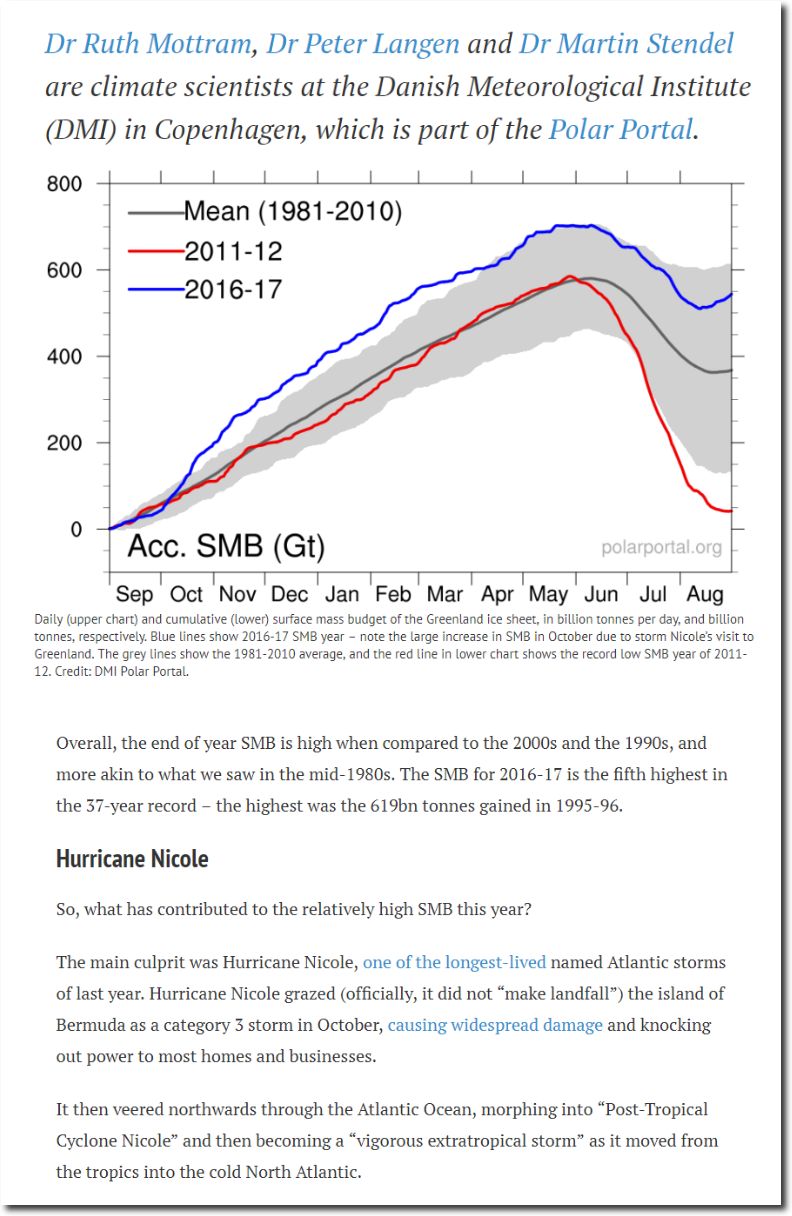
Guest post: How the Greenland ice sheet fared in 2017 | Carbon Brief
Even NOAA begrudgingly admitted that the huge ice gain was a “small increase.”
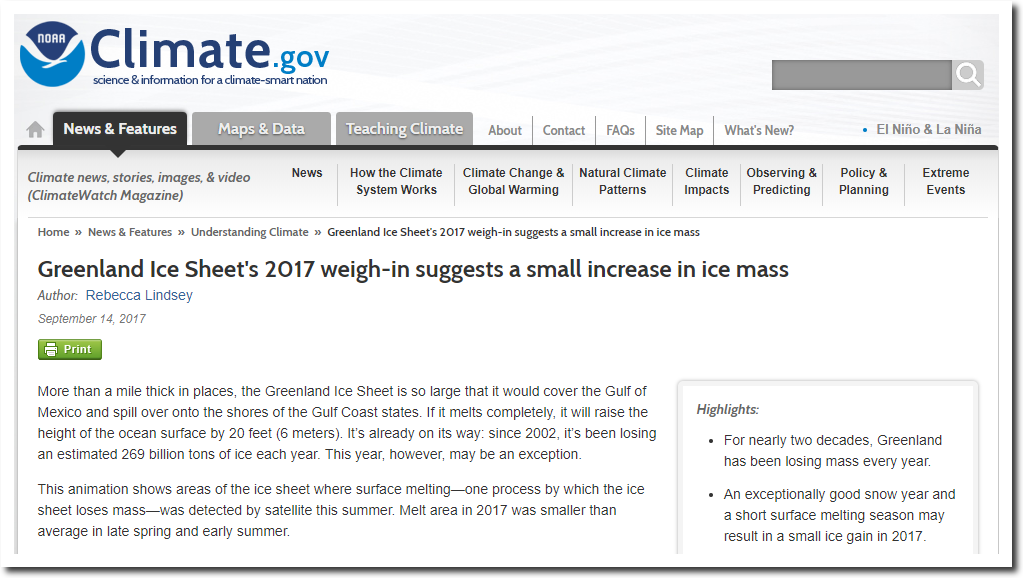
Greenland Ice Sheet’s 2017 weigh-in suggests a small increase in ice mass | NOAA Climate.gov
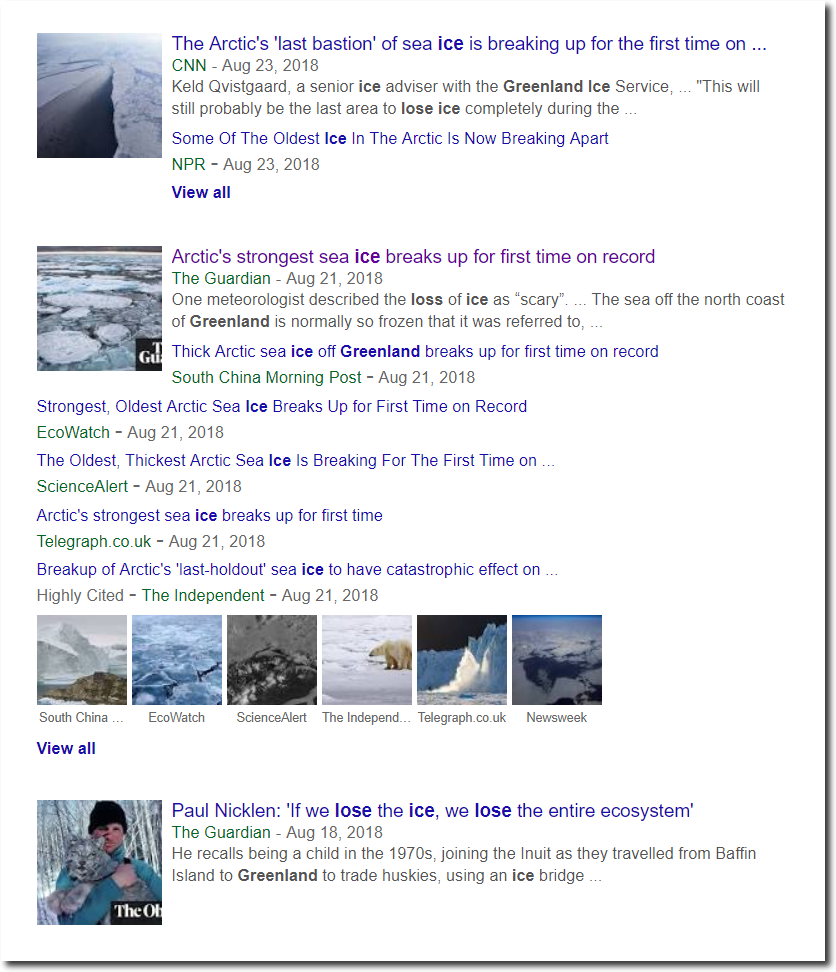
Meanwhile, the usual fraudsters in the press continue to report Greenland is melting and we are all about to die.