
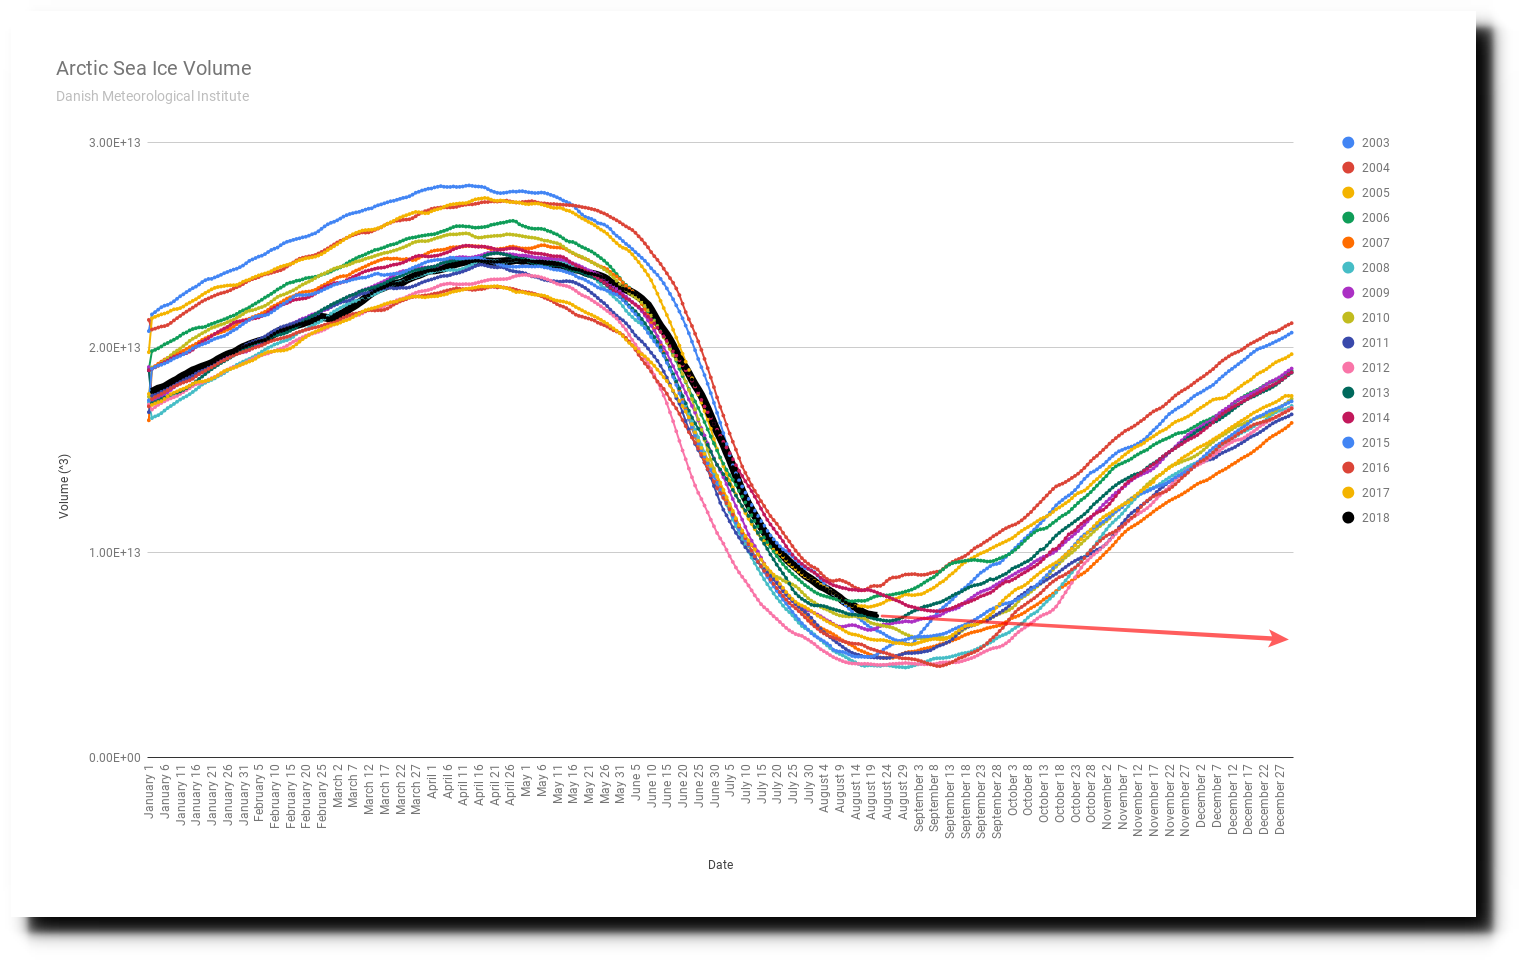
Arctic sea ice volume melt rates have slowed to close to zero, so I am pushing my ice-free Arctic date out to December 23, 2019 at exactly twelve noon.
Arctic sea ice volume melt rates have slowed to close to zero, so I am pushing my ice-free Arctic date out to December 23, 2019 at exactly twelve noon.
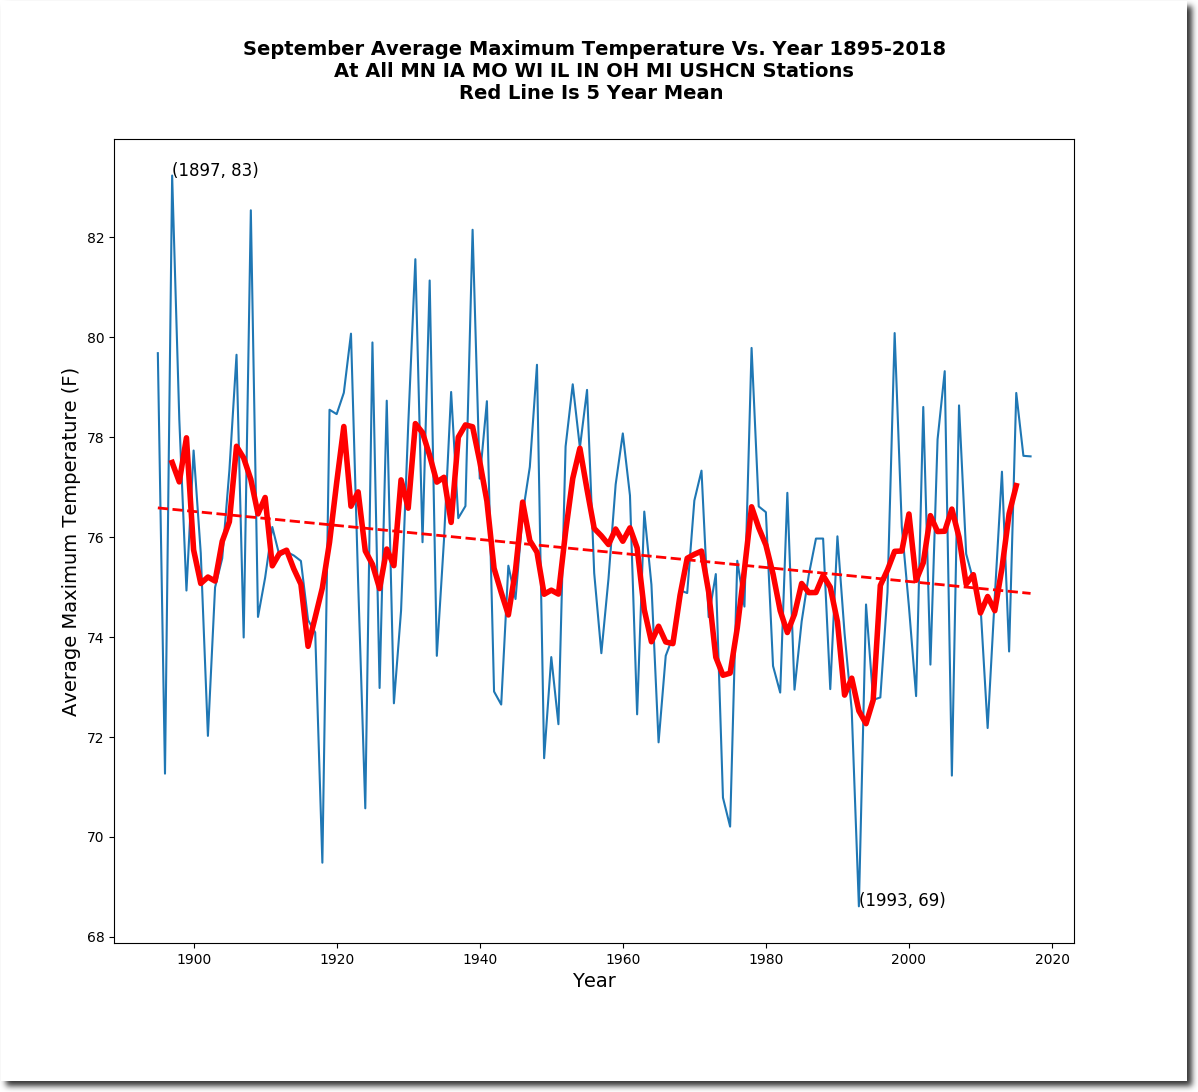
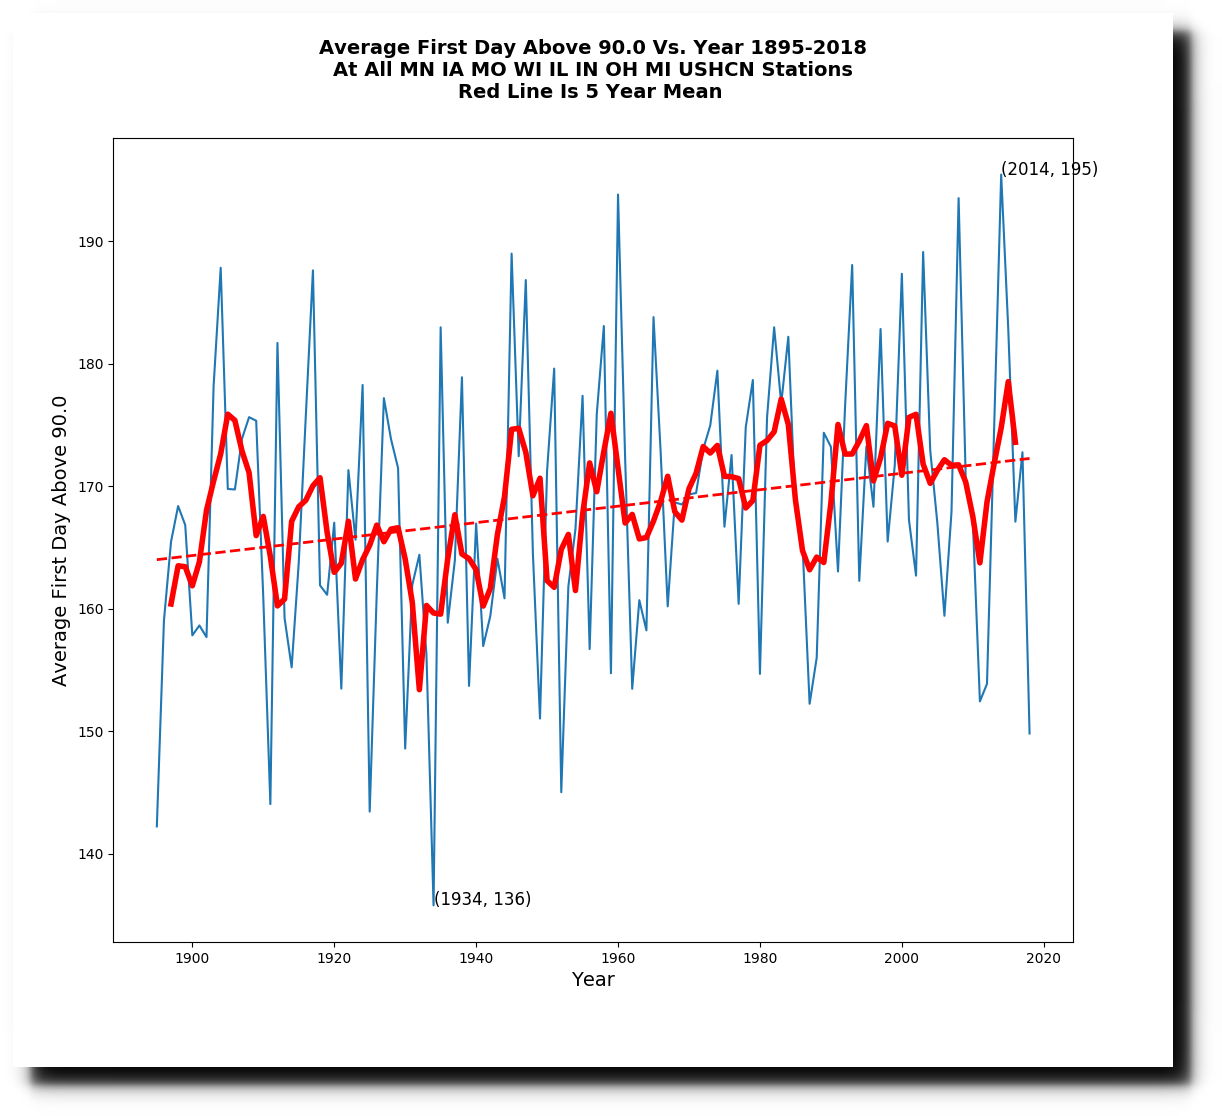
Summers are getting much shorter in the Midwest, and September is getting much cooler.
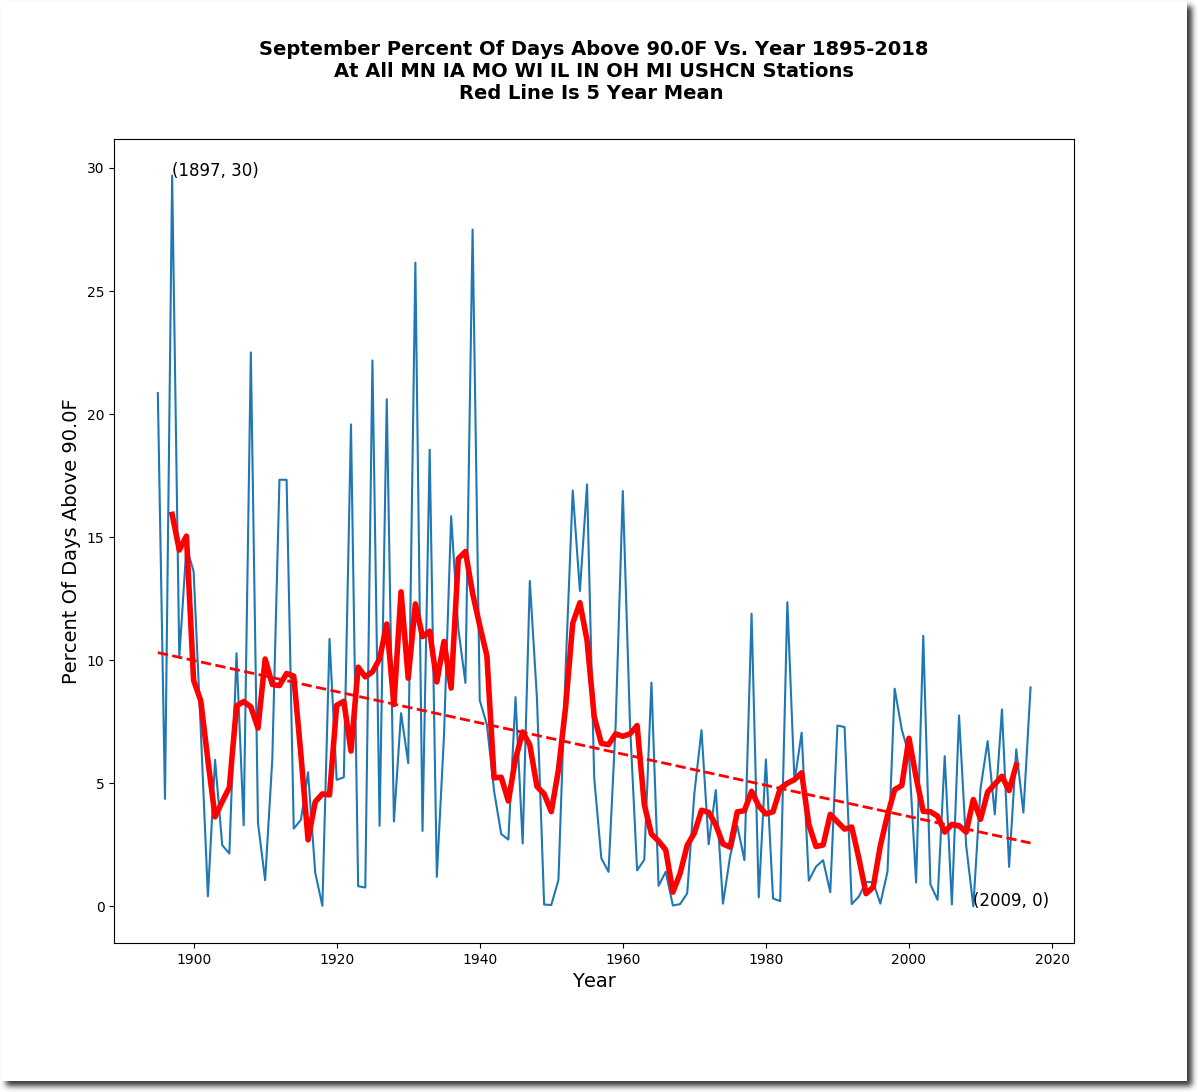
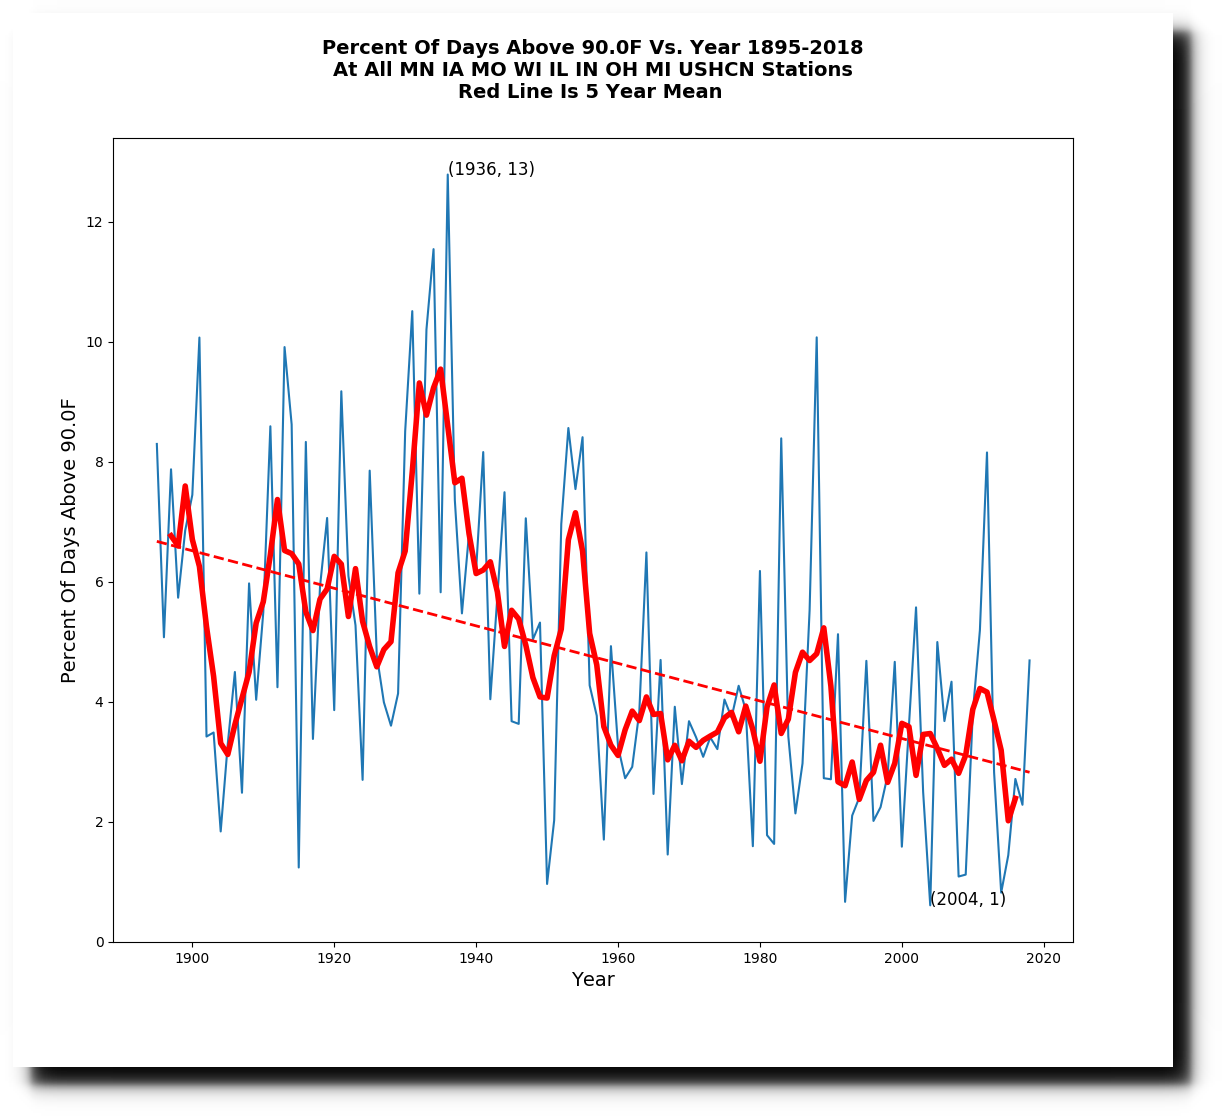
In 1897, thirty percent of Midwest summer days were over 90 degrees, but in 2009 there were no 90 degrees readings.
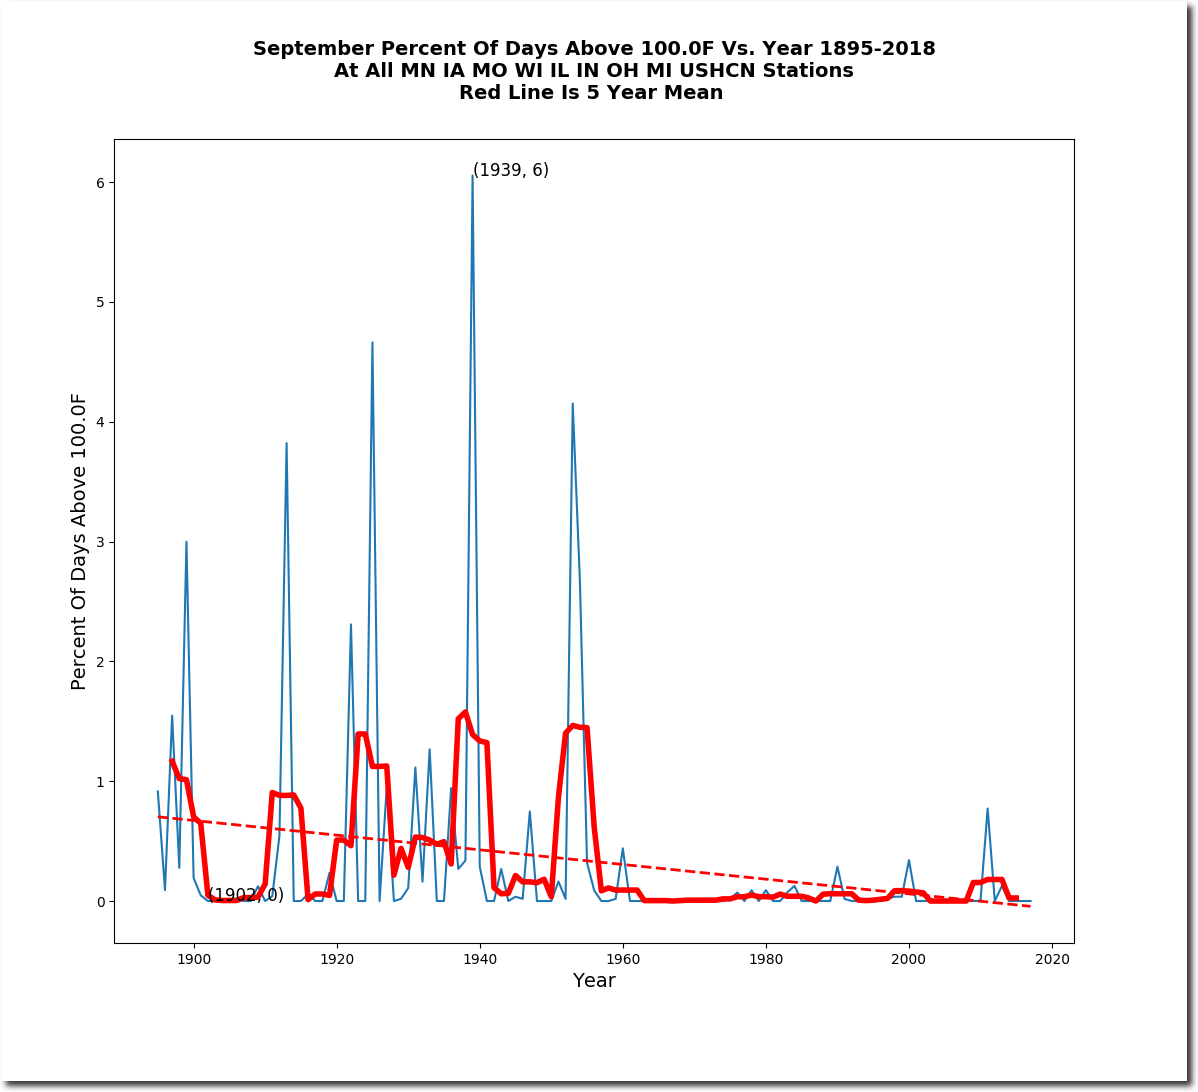
One hundred weather was common during September prior to 60 years ago, but almost never happens now in the Midwest.
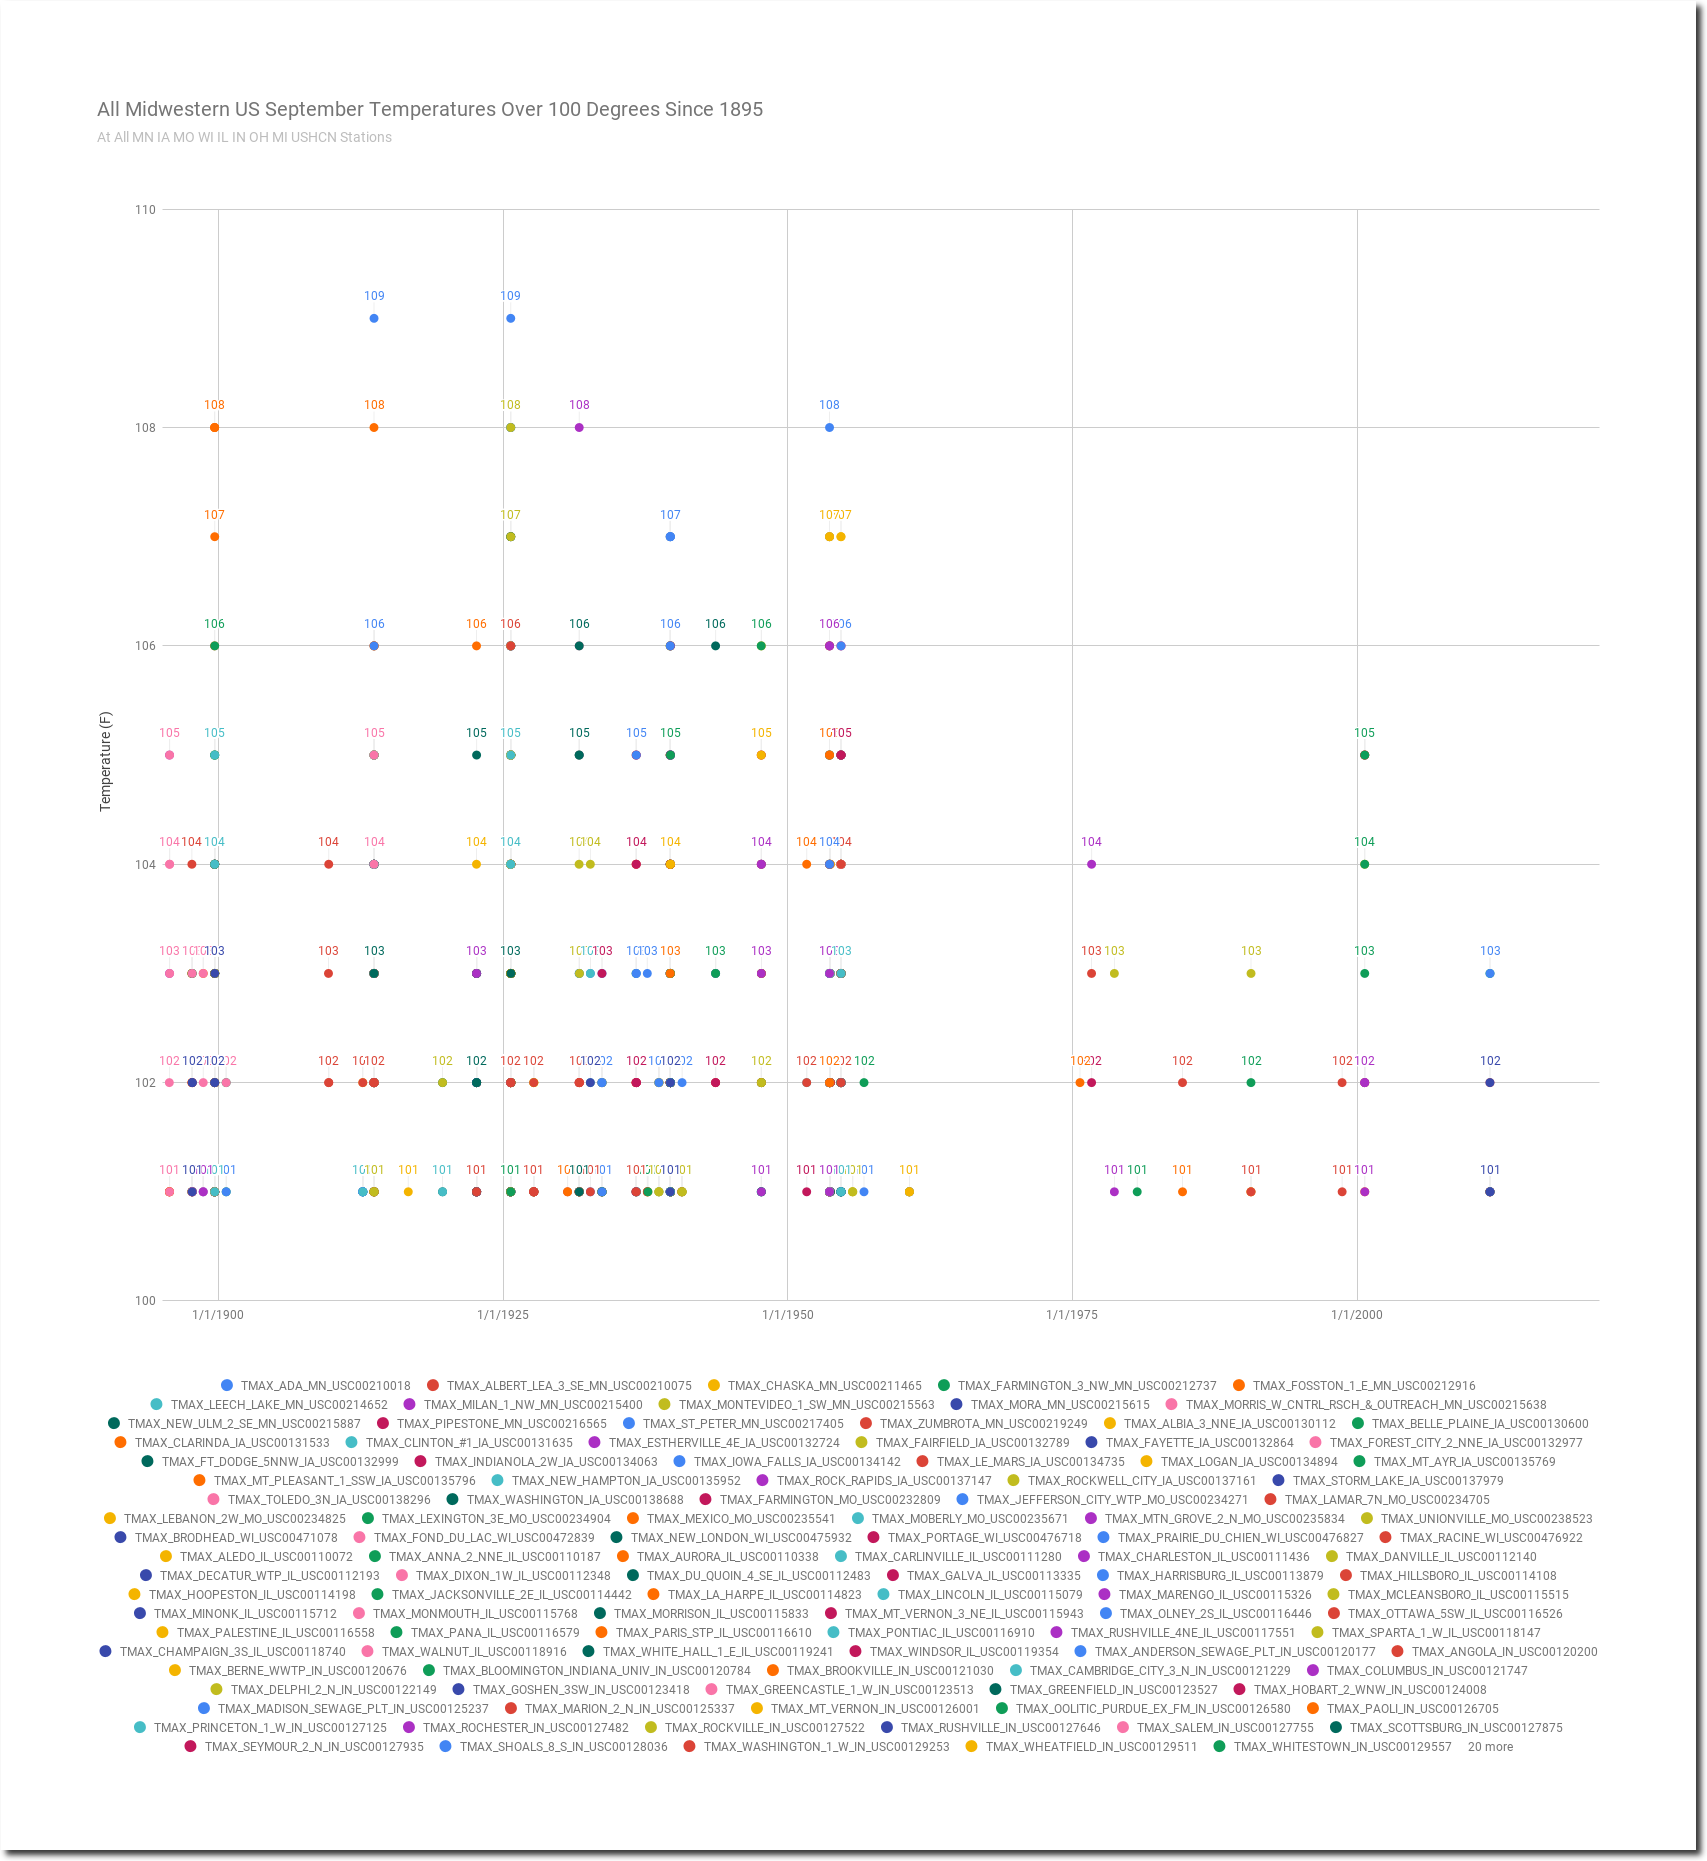
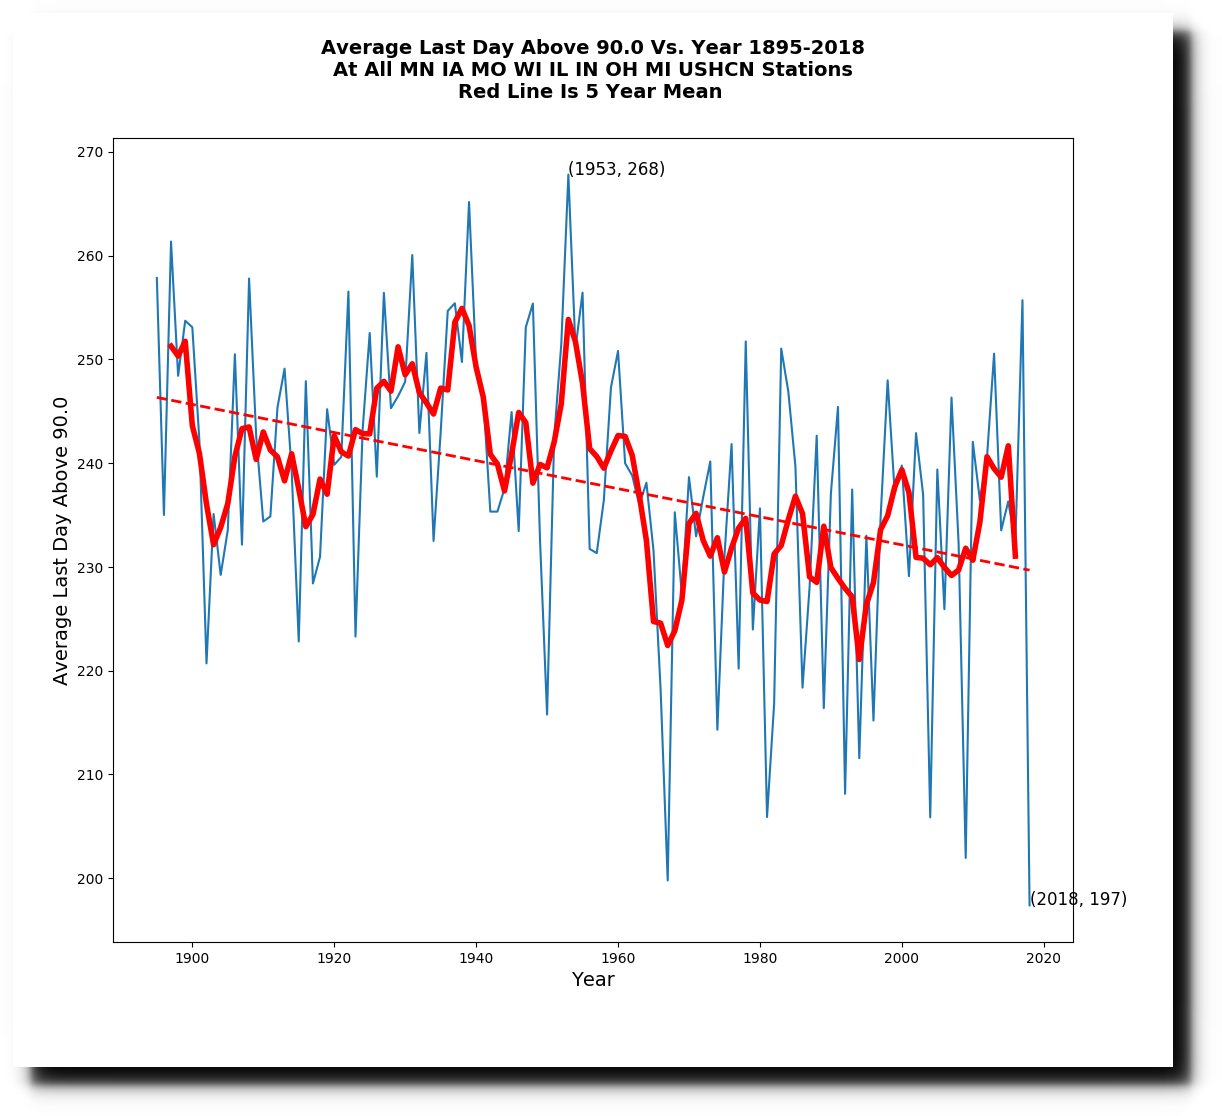
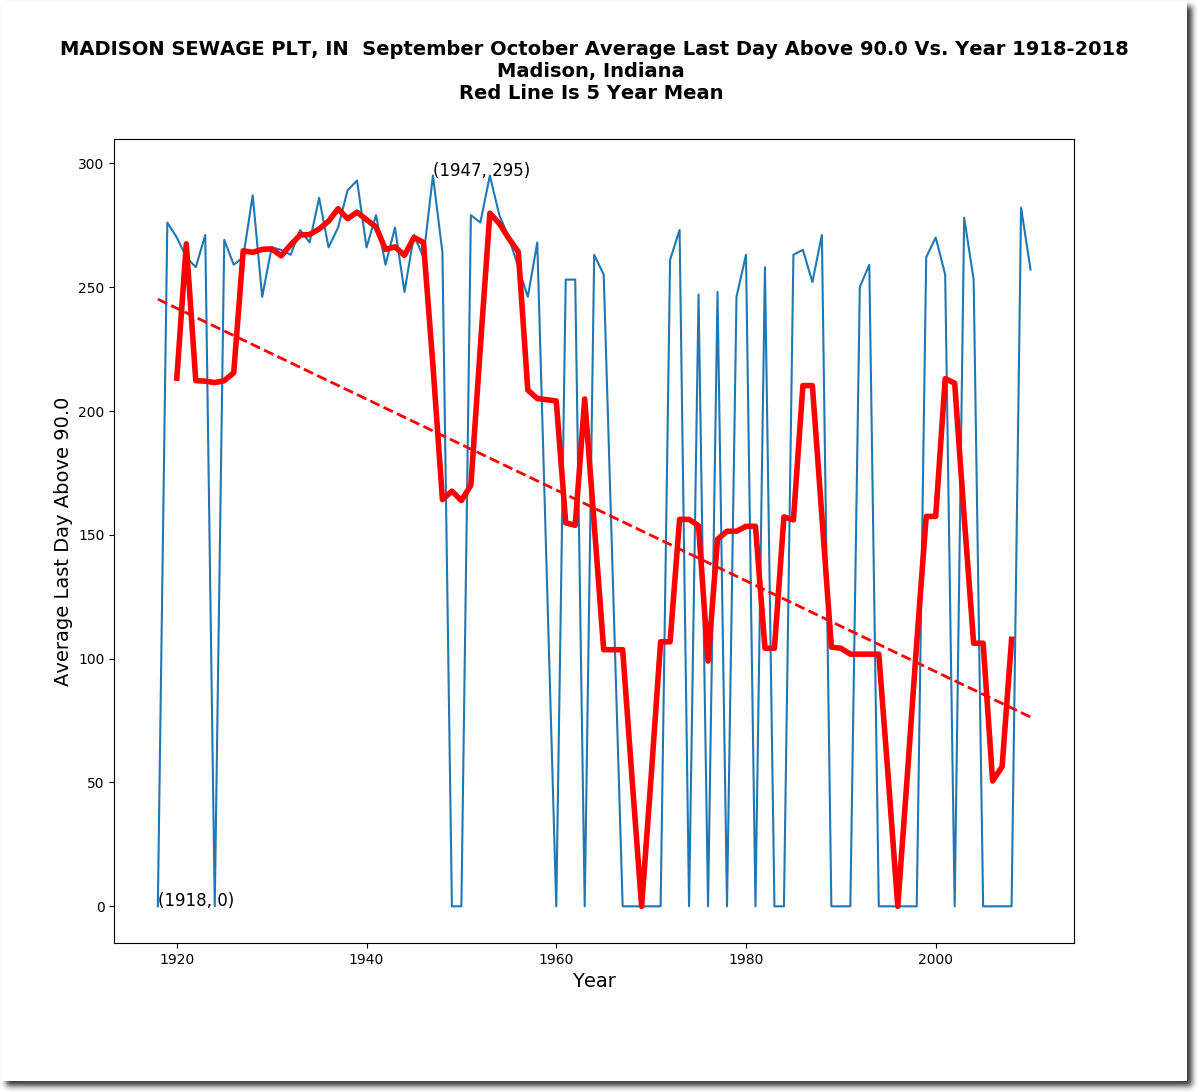
Summers in the Midwest end ten days earlier than they did a century ago.
But facts don’t matter to climate alarmists, who lie about essentially everything as their standard operating procedure.
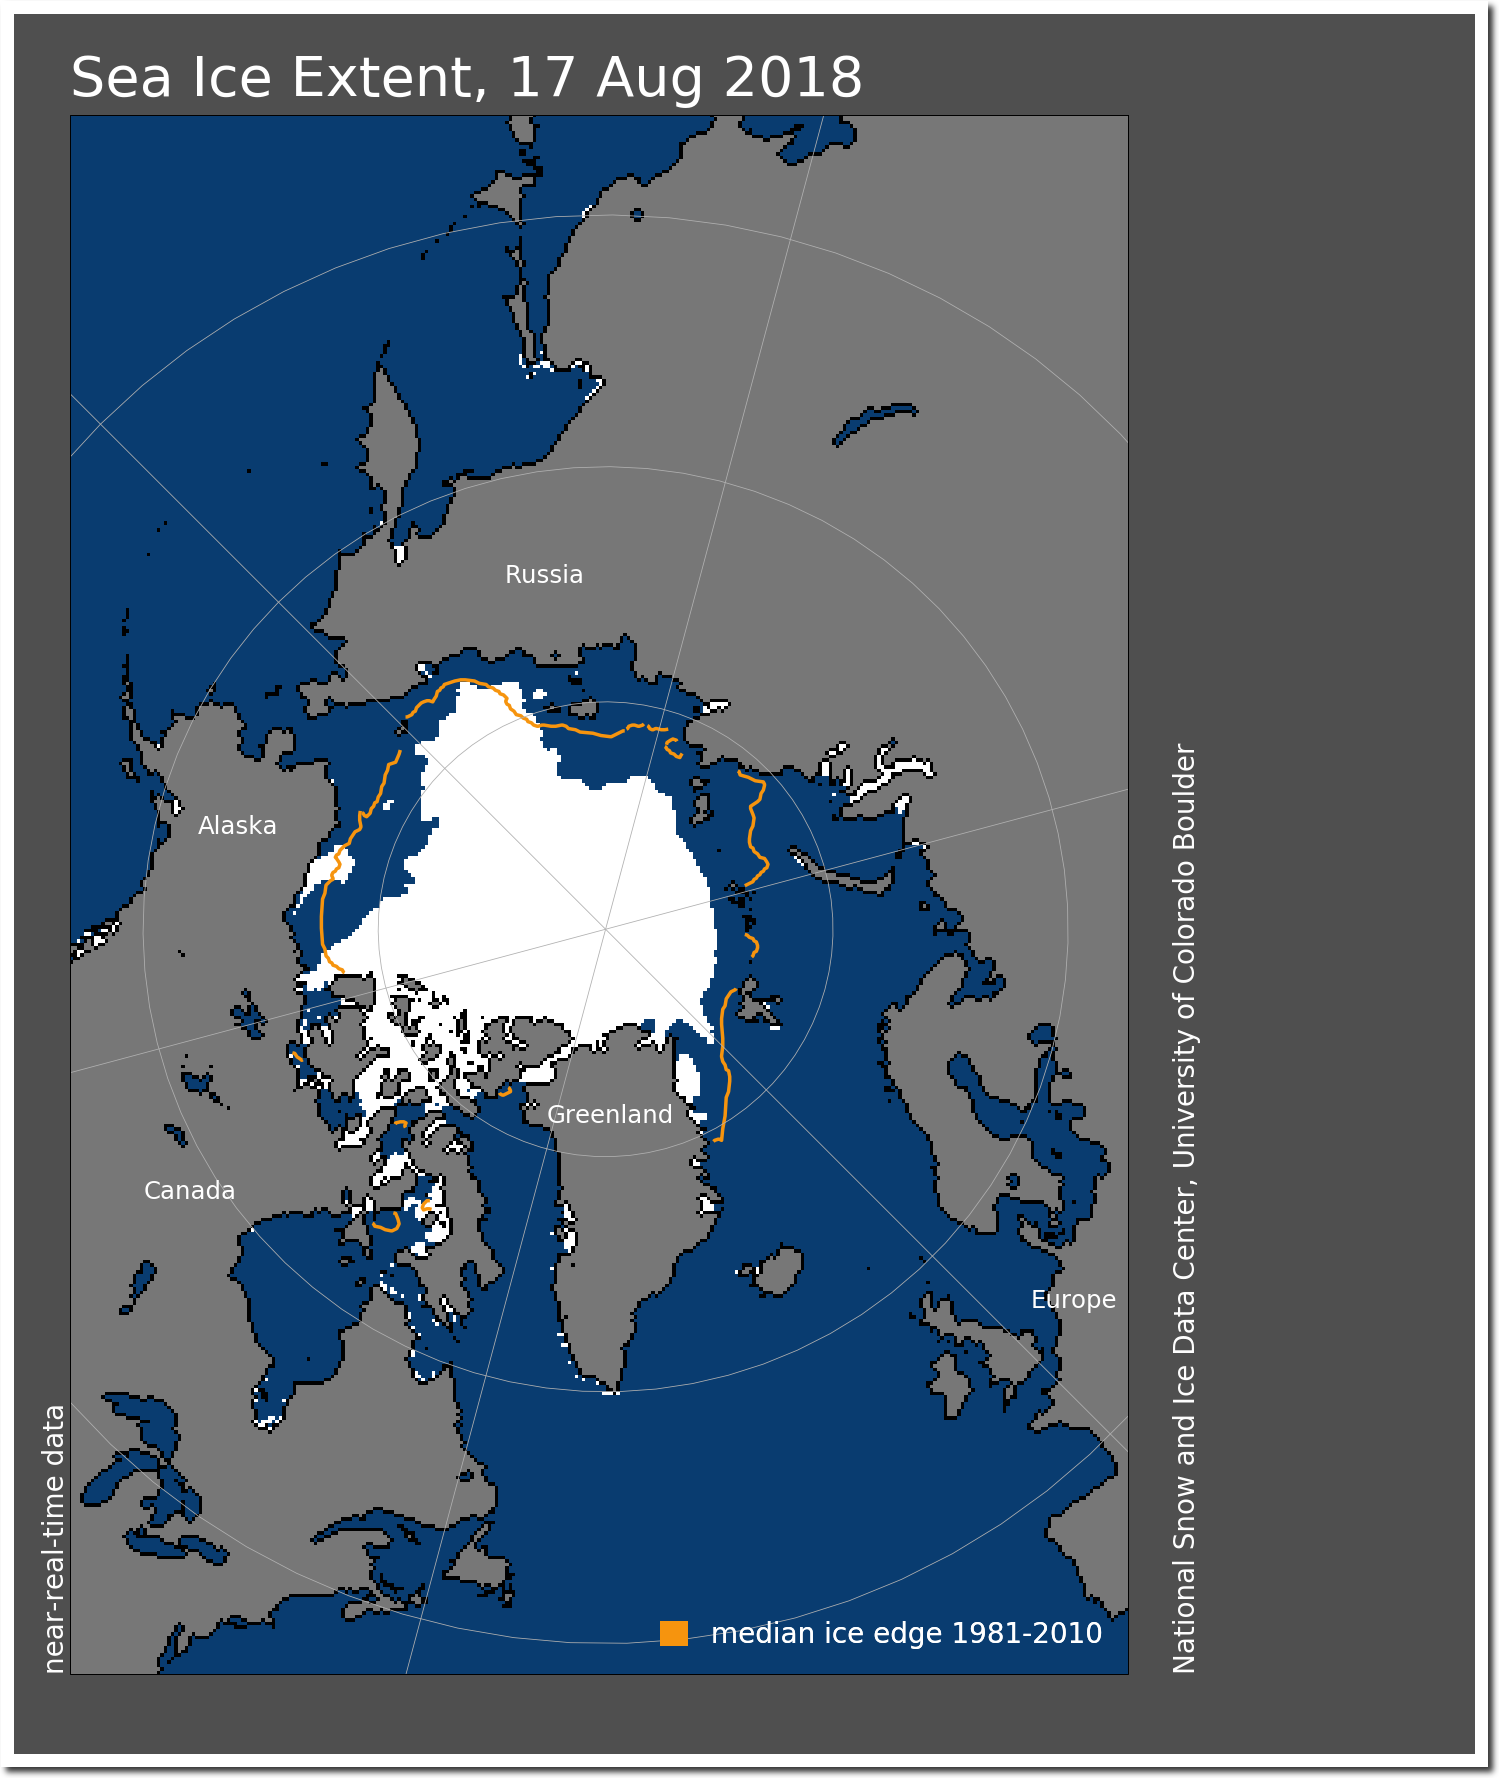
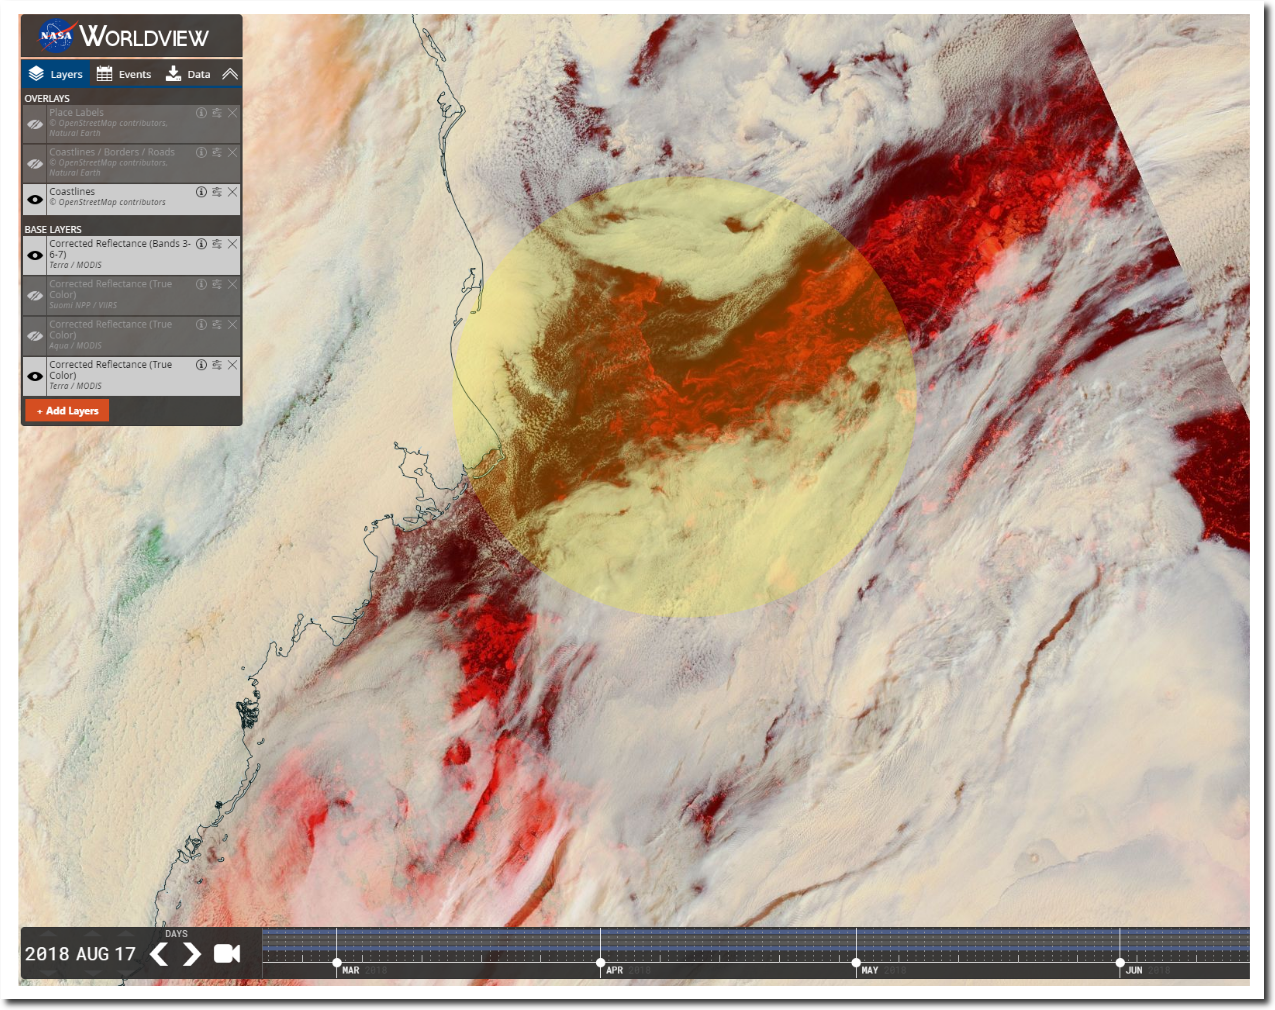
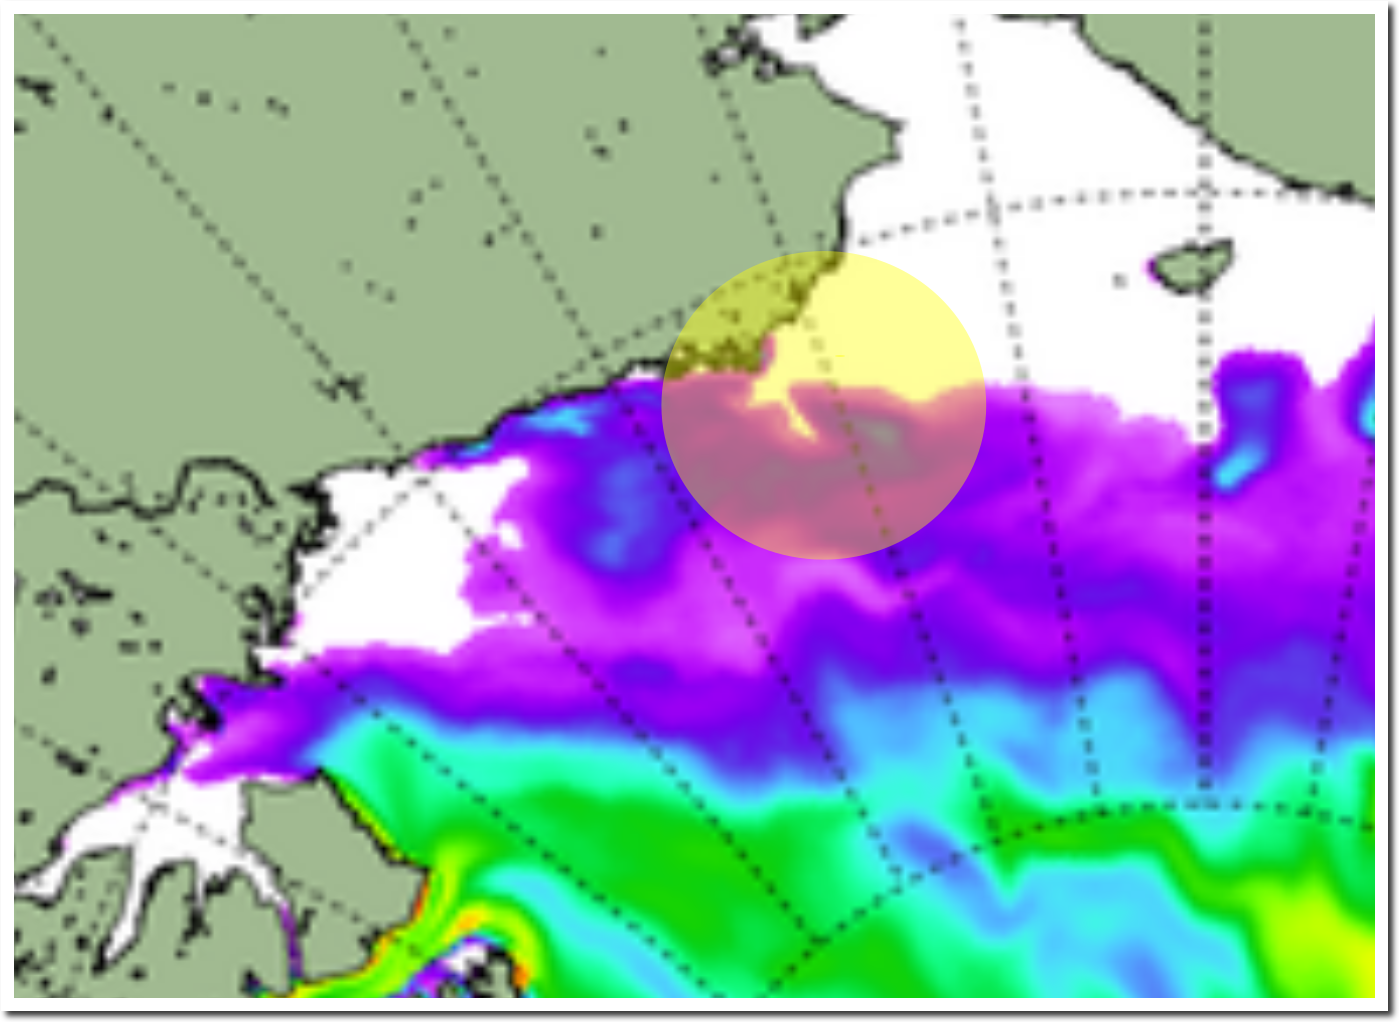
NSIDC shows no ice north of Barrow, AK.
N_20180817_extn_hires_v3.0.png (1461×1740)
But visible satellite imagery shows lots of ice (red) there.
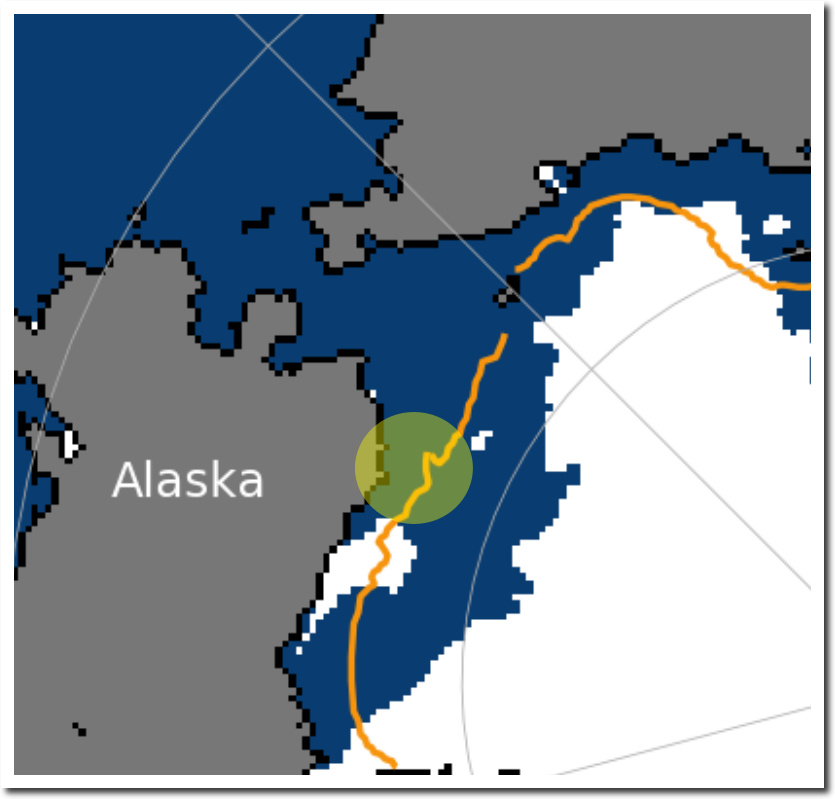
Unlike the fraudsters at NSIDC, the Danish Meteorological Institute correctly shows the ice.
I’ve also observed that NSIDC shows the edge of the ice consistently further back than satellite imagery shows. But when small fractions of a percent make for large differences in propaganda value, NSIDC consistently sides with the needs of propagandists.
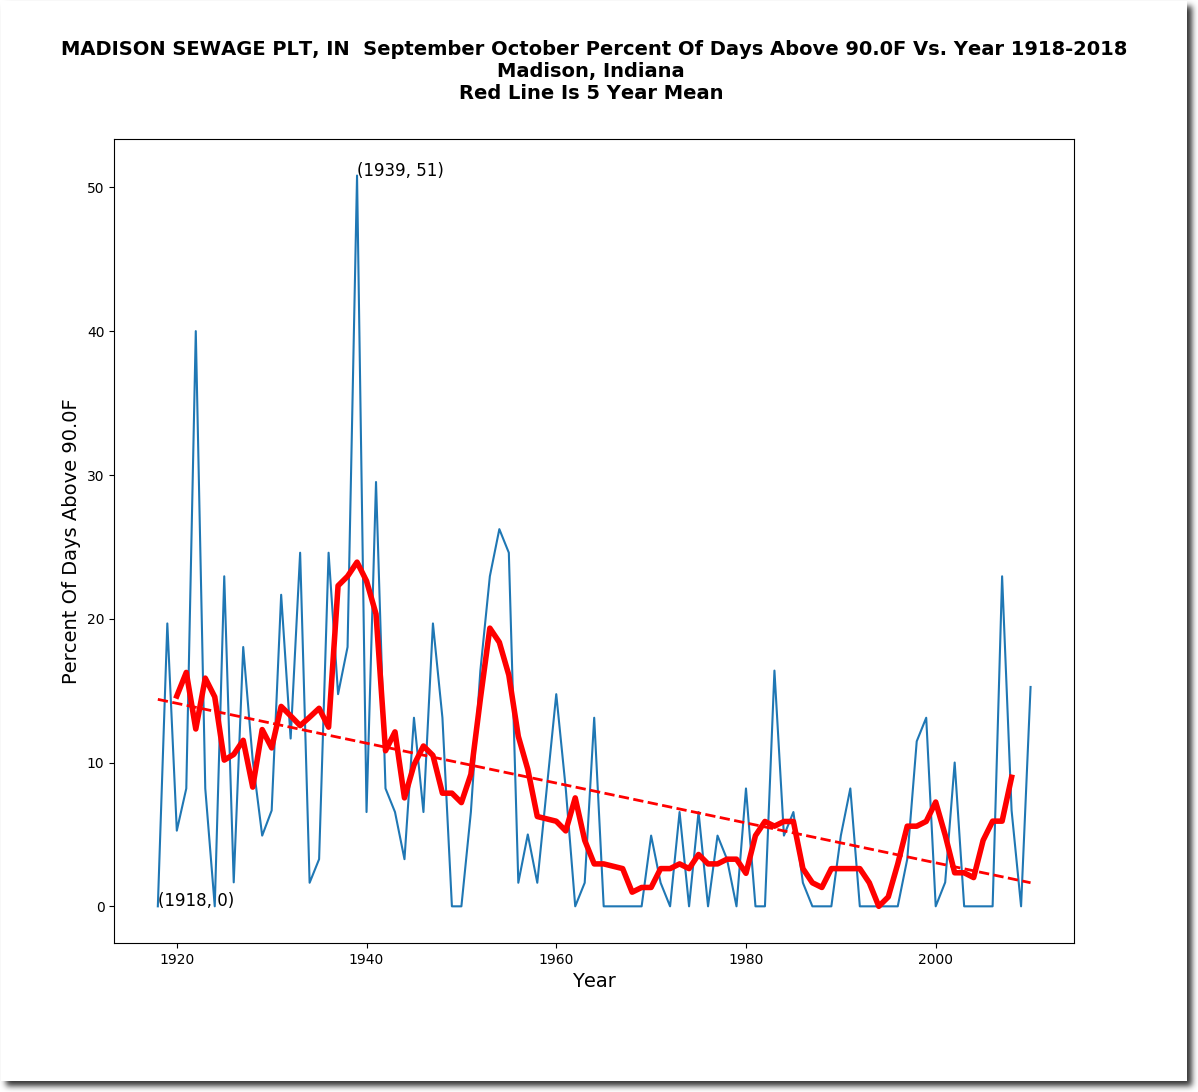
From September 1 to October 9, 1939 – Madison, Indiana afternoons averaged 95 degrees, had thirty-one days over 90 degrees, and eleven days over 100 degrees. On October 8, 1939 is was 100 degrees in Indiana. Imagine the global warming hysteria is this happened now.
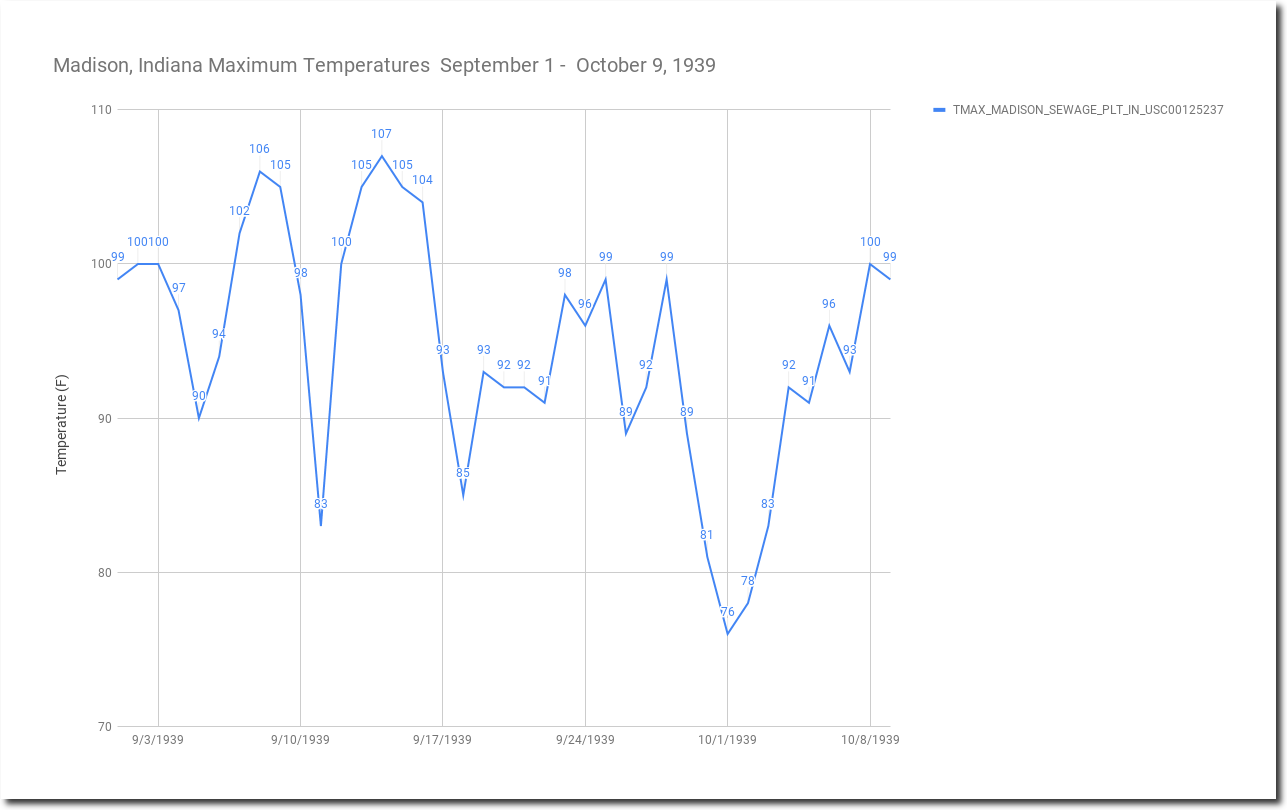
September/October afternoon temperatures have dropped more than five degrees over the last century at Madison, Indiana.

The heatwave was coast to coast.
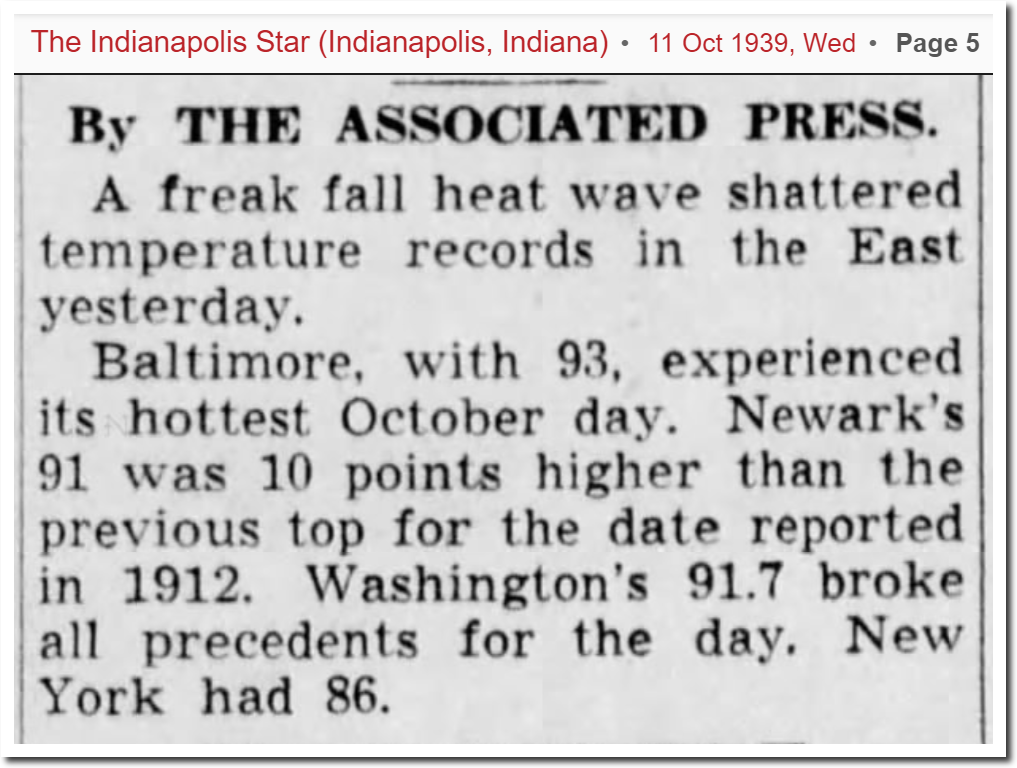
11 Oct 1939, Page 5 – The Indianapolis Star at Newspapers.com
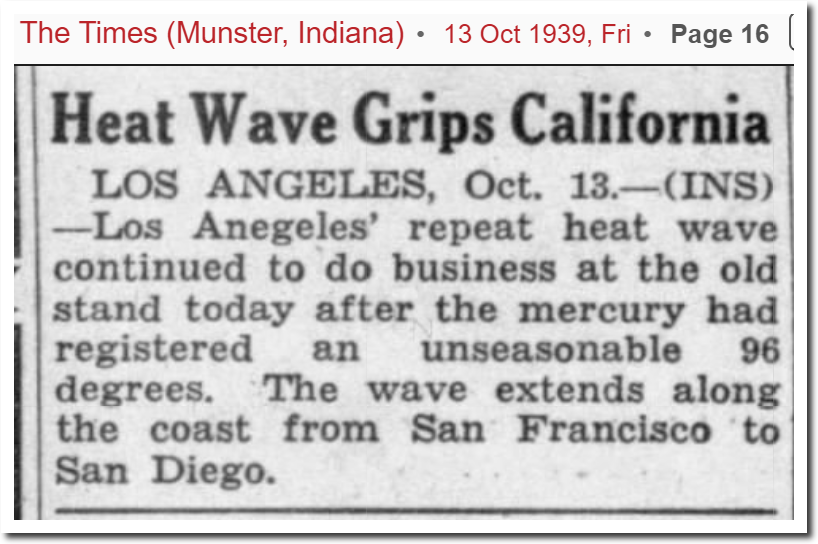
13 Oct 1939, 16 – The Times at Newspapers.com
Summer ends much earlier now than it did a century ago. Many years since 1960 haven’t had any 90 degree days, but prior to that it was very rare for Indiana summers not to reach 90 degrees.
This correlates with much more extensive autumn snow cover over the past 50 years.
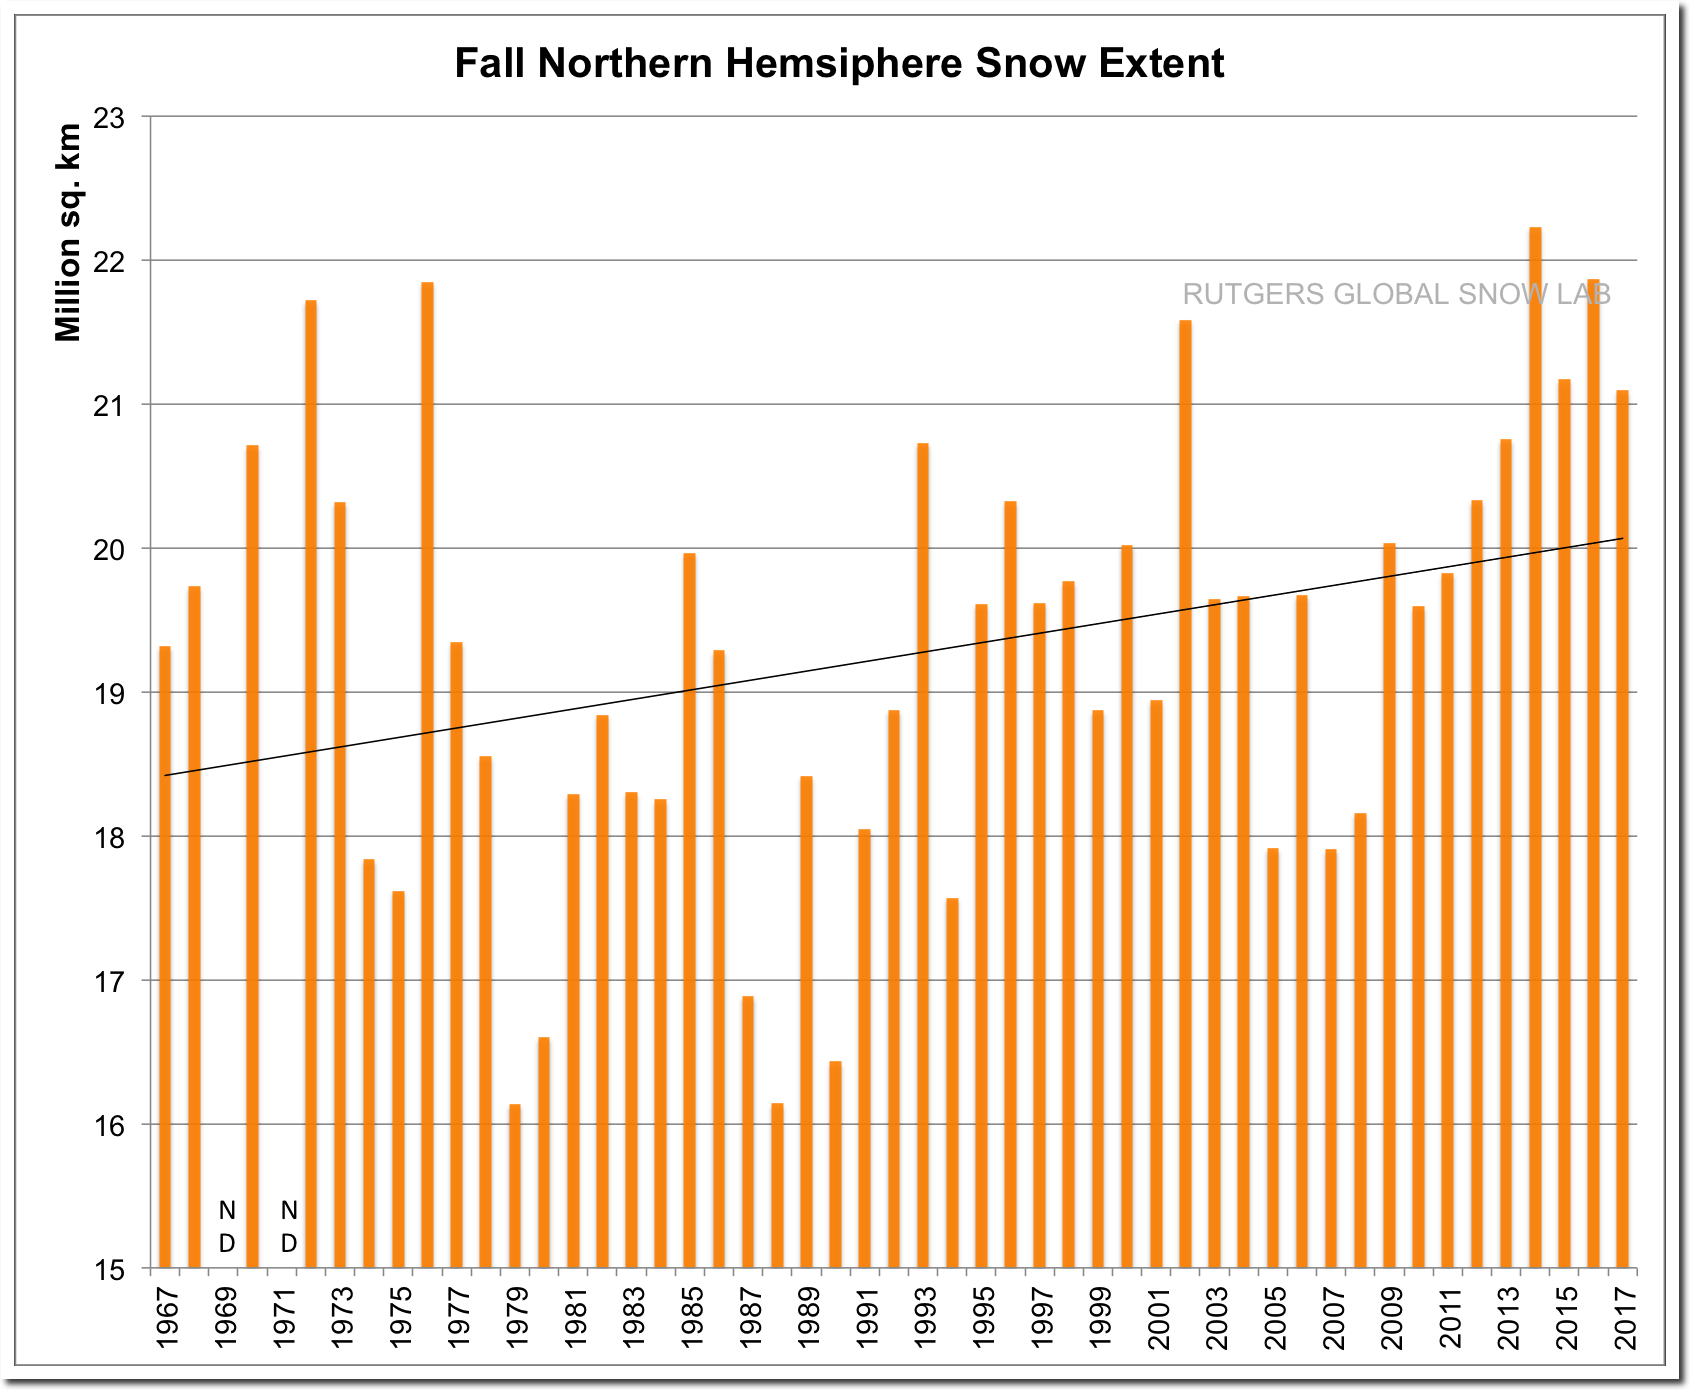
Rutgers University Climate Lab :: Global Snow Lab
There is lots of evidence that summers are becoming milder and shorter in the Northern Hemisphere, but that wrecks the multi-billion dollar global warming scam for climate scientists. so they will never tell the truth – about anything.

This is the 15th hole at the Los Alamos Golf Course. It is 160 yards downhill. I have been playing this hole for 50 years and still haven’t figured it out. They normally put the pin near the front of the green, to keep people from hitting cars. The front of the green is less than 20 feet wide, and it is only 30 feet from trap to trap.
Yesterday I thought I hit a perfect shot into a strong wind, and ended up in the trap on the right side. I missed the pin by only ten feet, but left myself with a very difficult second shot out of the trap on to a narrow green, which drops off sharply on the other side.
Unless you are pro, it probably makes sense to play it short and have an easy second shot on to a flat, smooth green, but I still haven’t figured that out yet after 50 years. The good news is that I now get a senior discount.
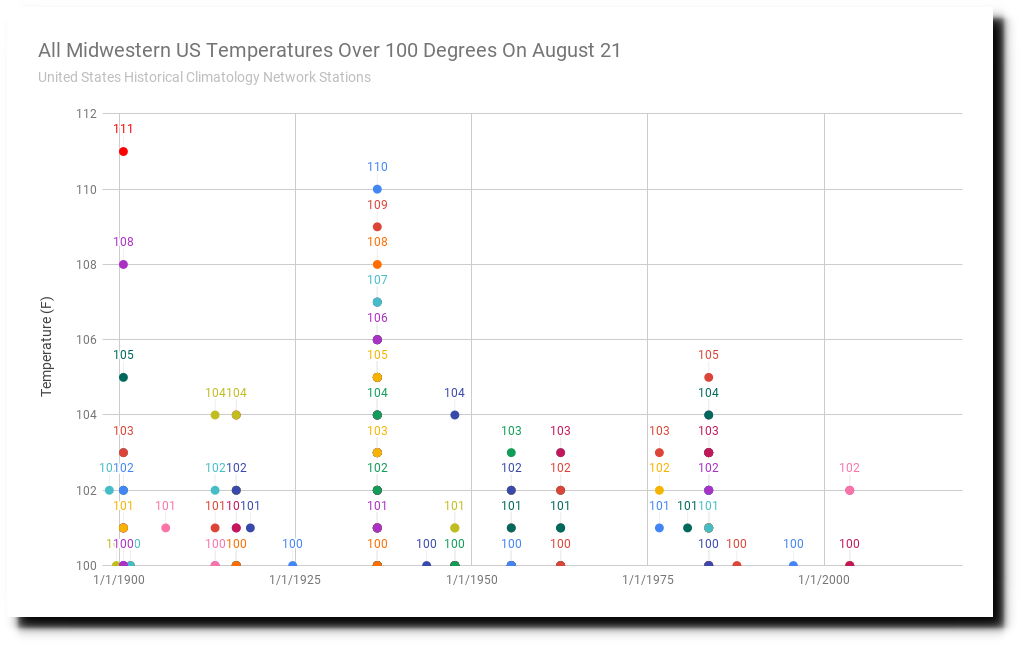
August 21 used to be a hot day in the Midwest, but has cooled dramatically over the last century. There hasn’t been a 100 degree day in the Midwest in 15 years, but they used to be quite common. On this date in 1900, Du Quoin, Illinois was 111 degrees.
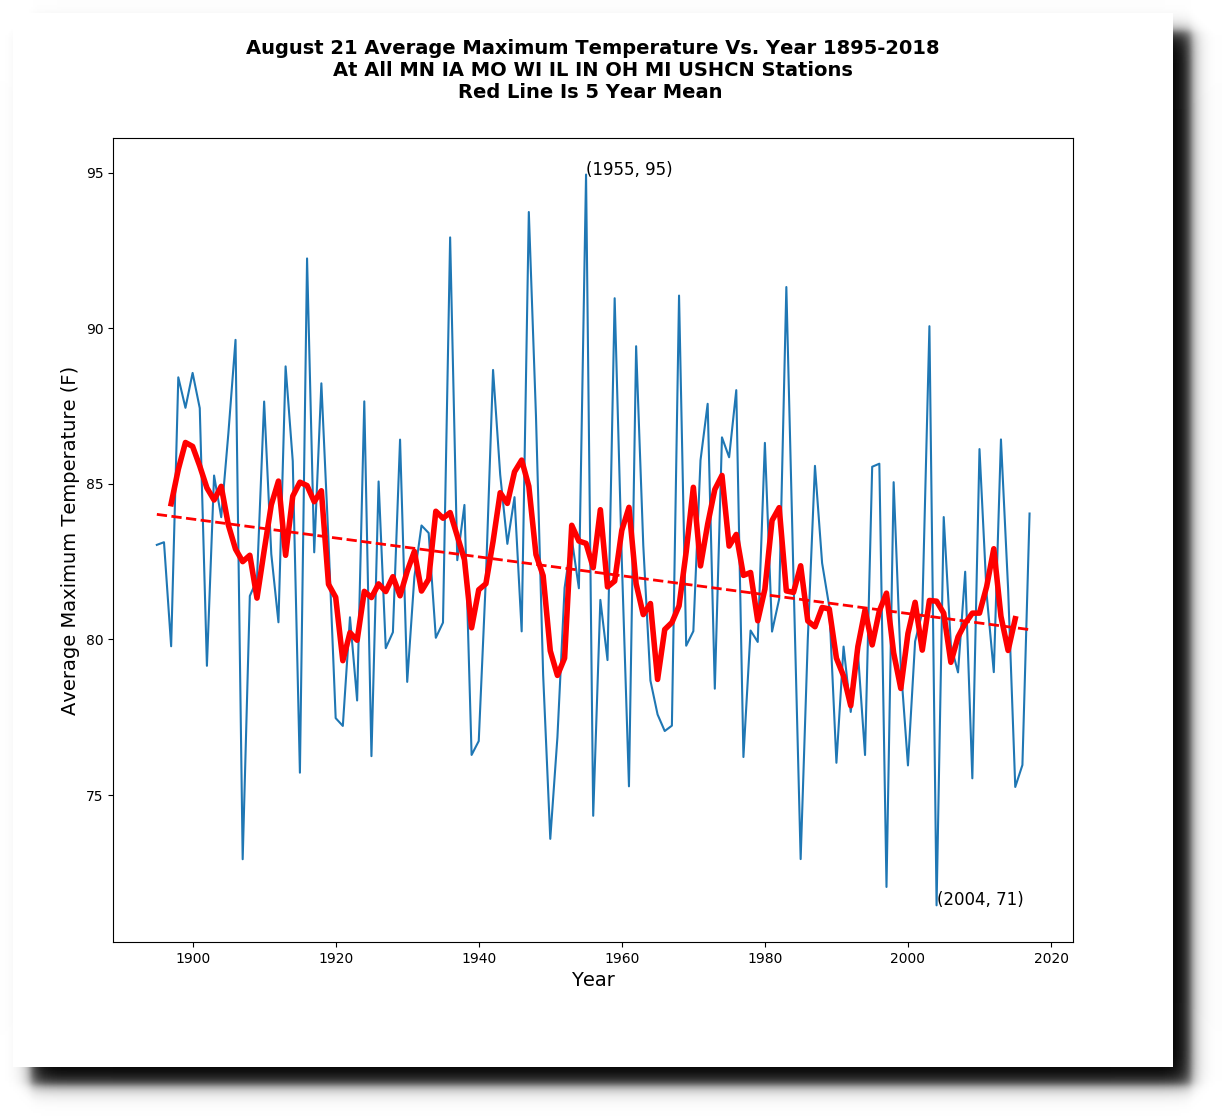
On this date in 1955, the average afternoon temperature in the Midwest was 95 degrees. Average afternoon temperatures have dropped three degrees since the 19th century.
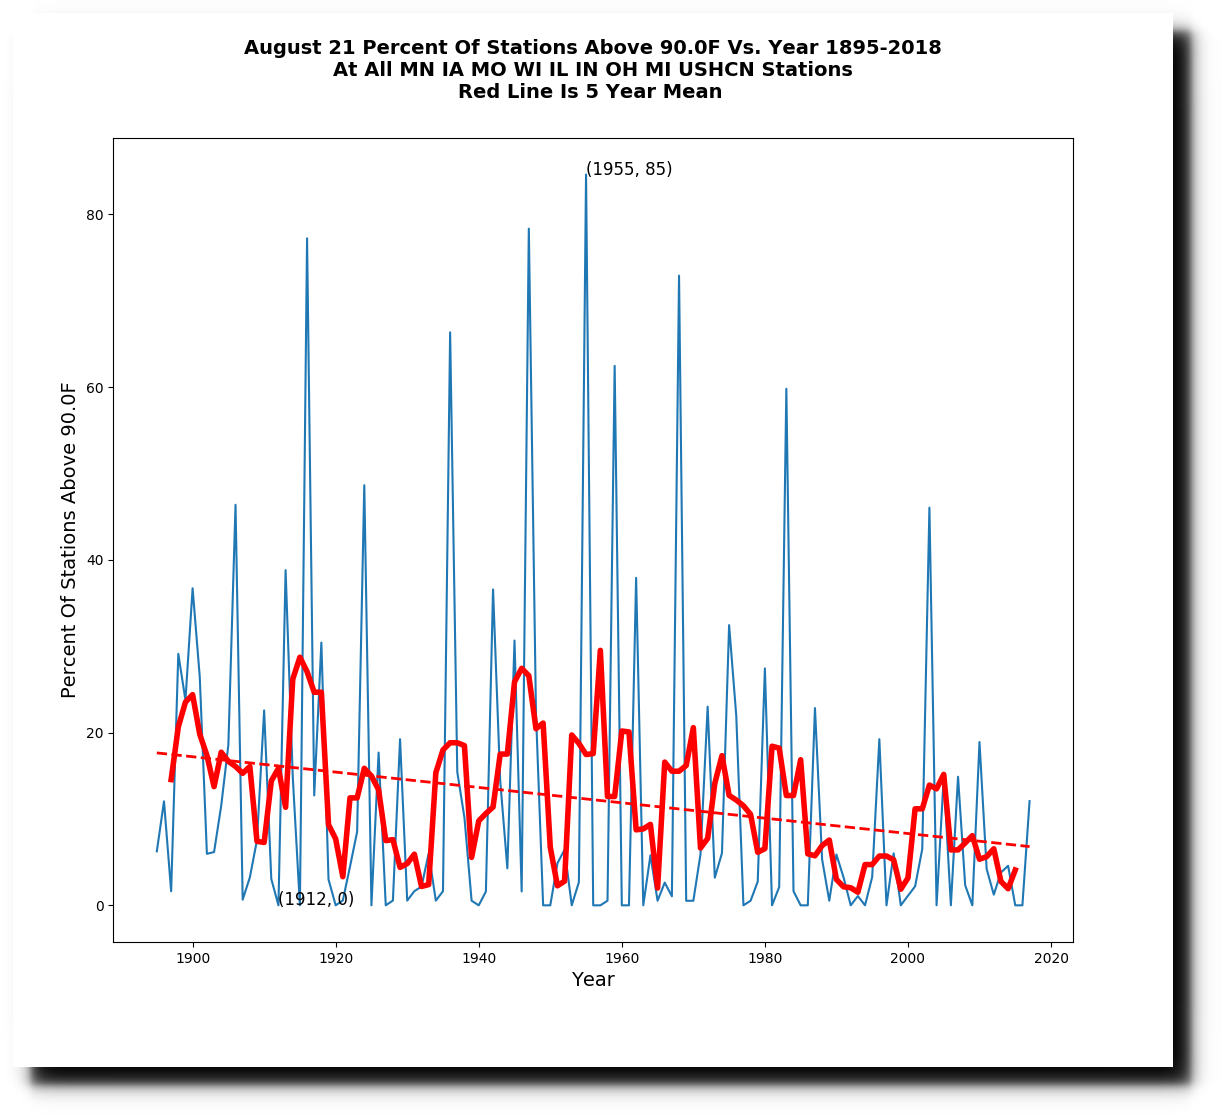
On this date in 1955, 85% of the Midwest was over 90 degrees.
Prior to 1960, summer used to last about ten days longer in the Midwest than it does now.
Midwest summers also start about five days later now than they did in the 19th century.
The frequency of hot days is down more than 50% over the past century.
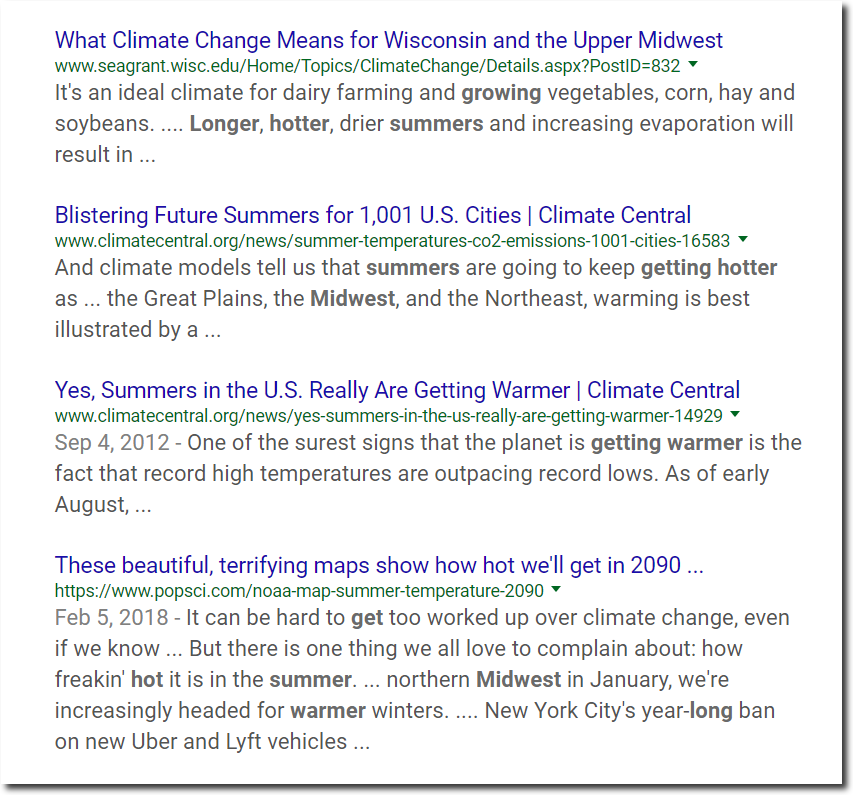
The “Union of Concerned Scientists” claims the exact opposite, because their agenda has nothing to do with science or reality.
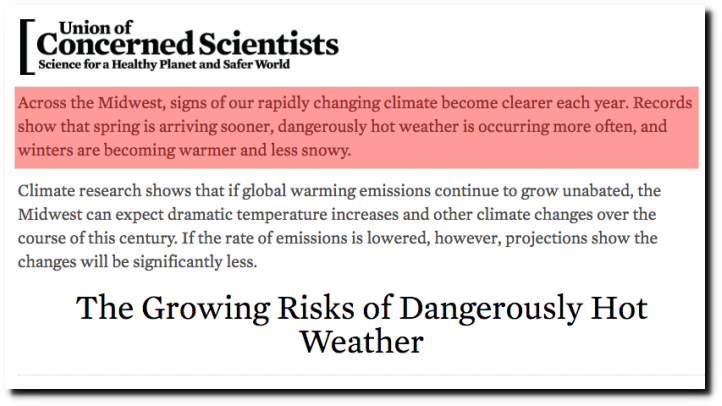
Global Warming in the Midwest | Union of Concerned Scientists
The Washington Post Capital Weather Gang are constantly working to outdo themselves in the fake news climate hysteria department. Their latest claim is that July was California’s hottest month ever recorded.
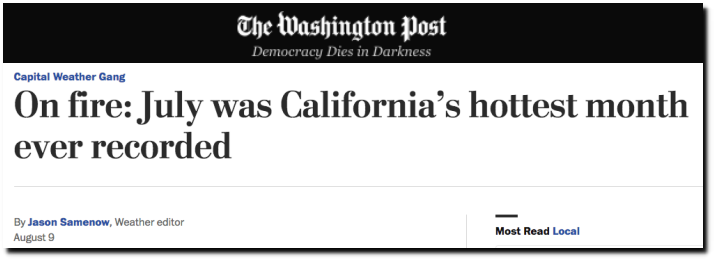
On fire: July was California’s hottest month ever recorded – The Washington Post
Average maximum temperatures in California this July weren’t in the top ten, and were four degrees cooler than 1931.

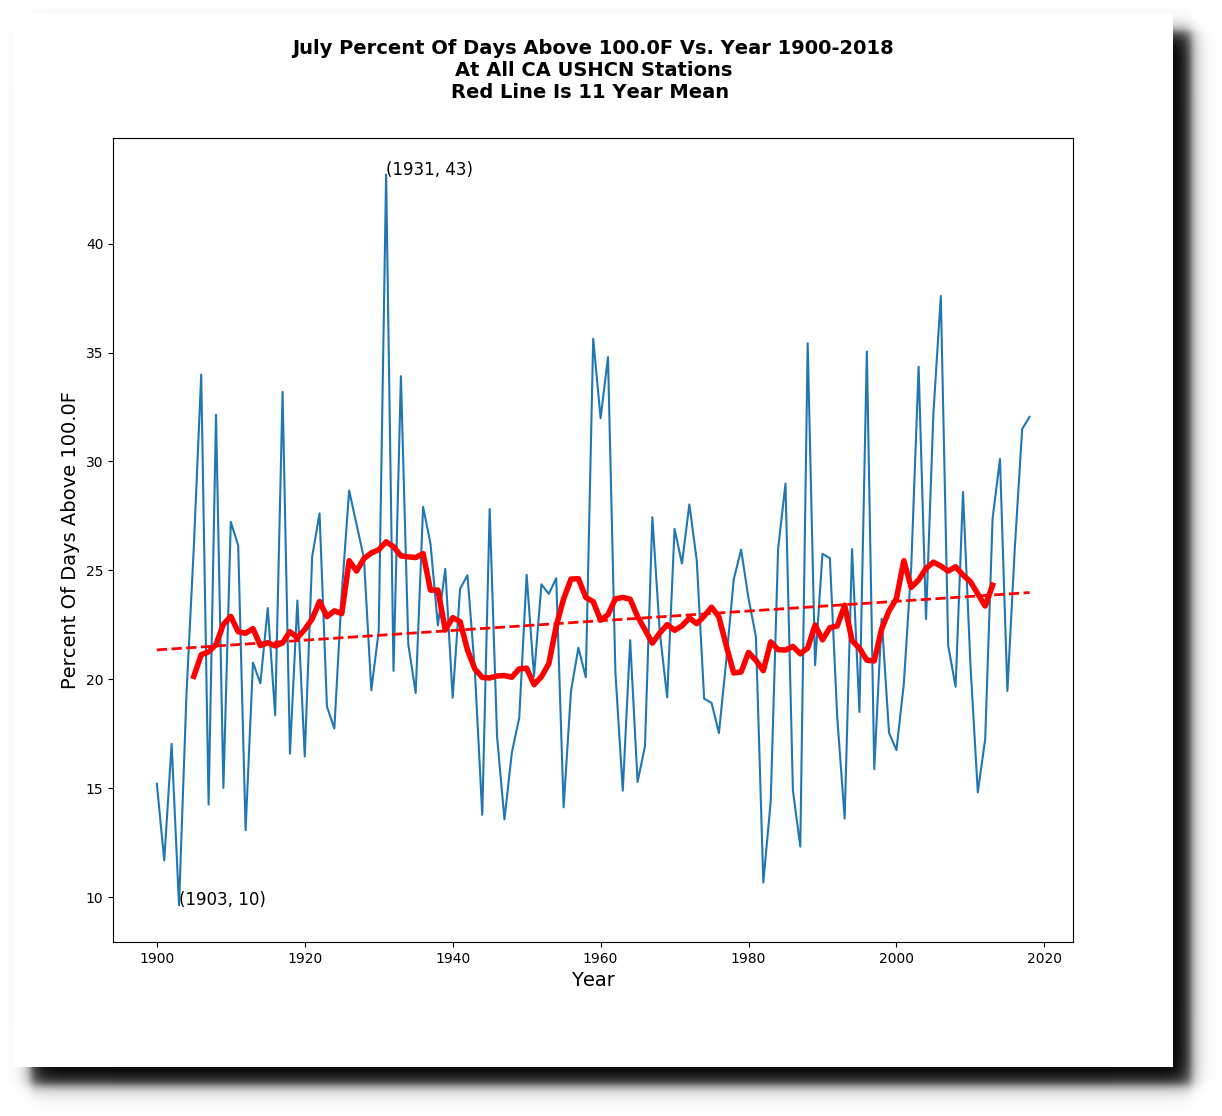
The frequency of hot days wasn’t in the top ten either.
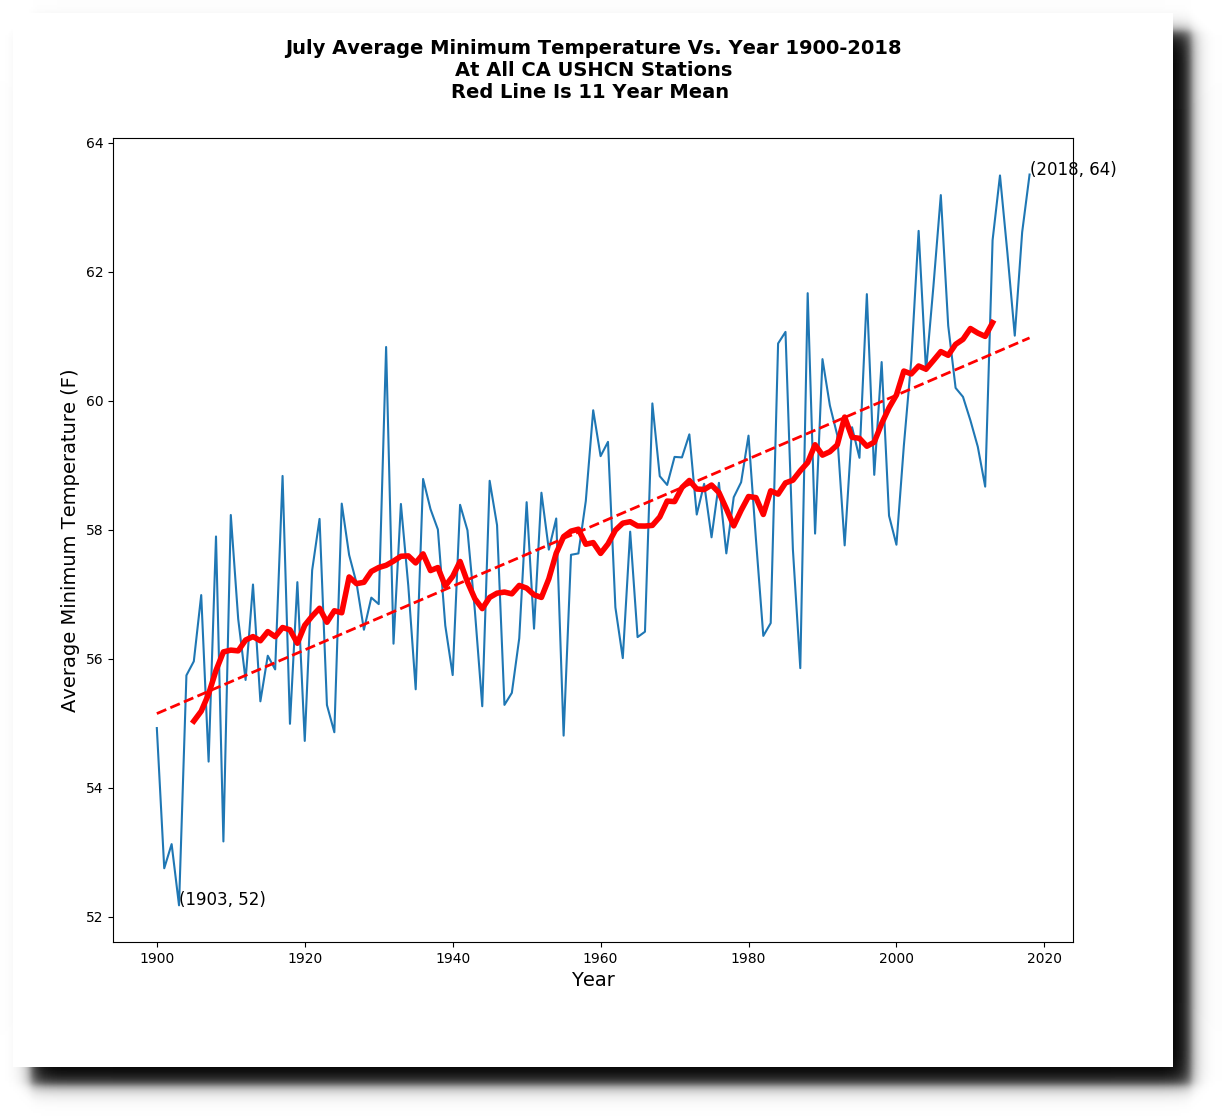
Minimum temperatures were the least cold, but most people don’t consider 64 degrees to be “hot.” However, the warmth in minimum temperatures is most likely due to urban heat island effects around the thermometers, rather than climate.
But the junk science is worse than it seems. California’s two hottest stations do not have any data prior to 1940 in the GHCN database, so they need to be removed to do a fair comparison vs. 1931. When Needles and Death Valley are removed, California July temperatures are dropping sharply and this year was not much above average. July 2018 was five degrees cooler than 1931.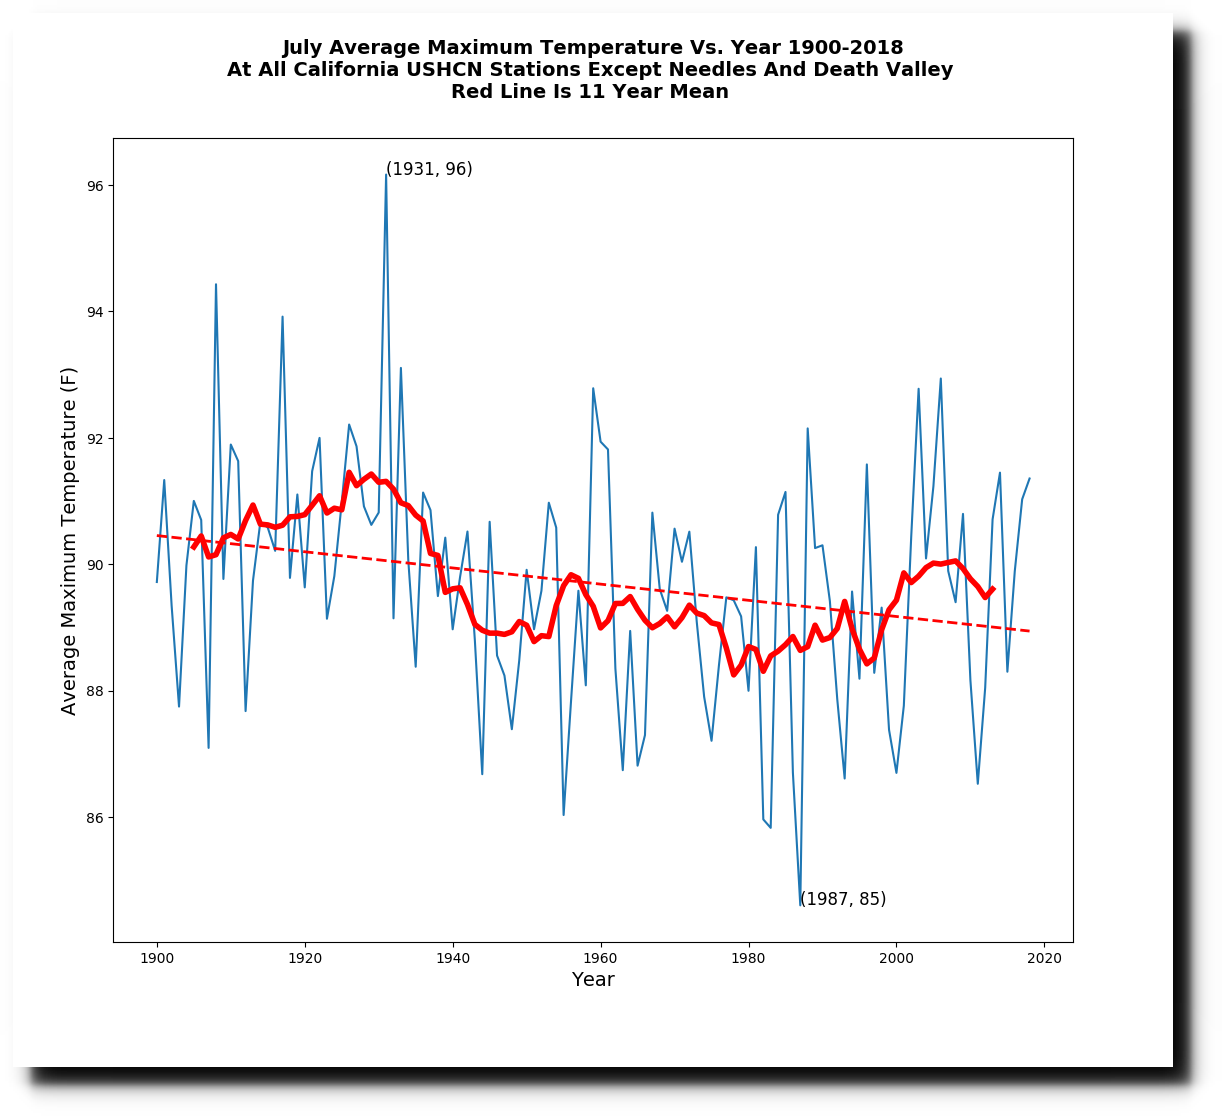

This sort of nonsense is standard practice for the Capital Weather Gang, who claimed the Arctic was “super hot” on a day when temperatures made it up to 0C for a few hours in a small region near the North Pole.
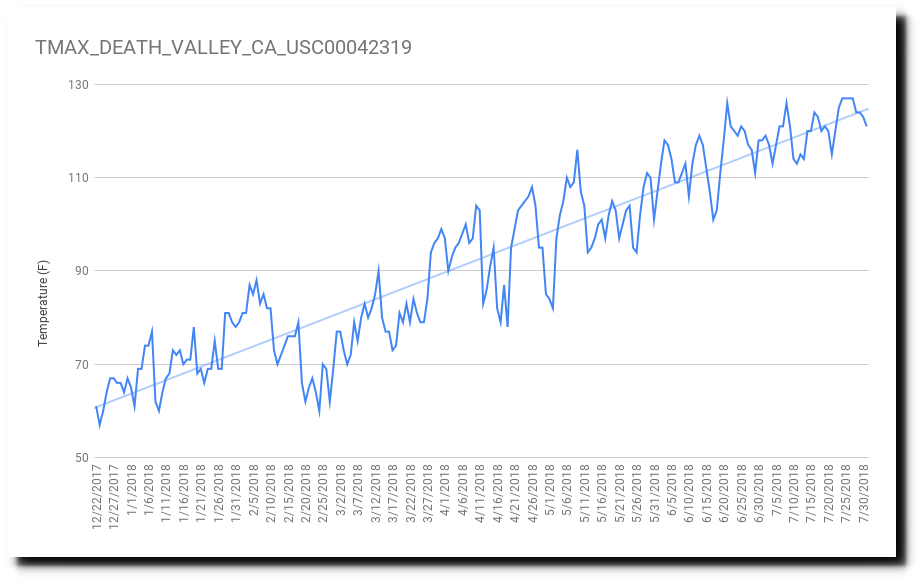
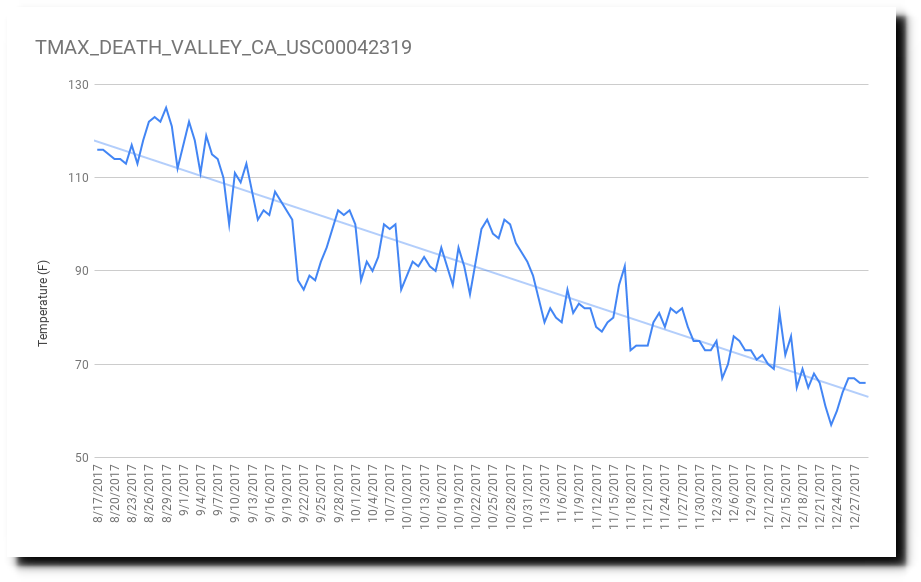
From December 22, 2017 to July 30, 2018, Death Valley, CA warmed at a rate of 102 degrees per year. Using the universally accepted climate science linear extrapolation, Death Valley should reach the boiling point of water* during late May of next year.
Having said that, it should also be noted that Death Valley cooled at a rate of 145 degrees per year from August 27 to December 30 last year. This is undoubtedly one of the many benefits of California carbon taxes.


