Comparing The Heat Of 2018 To 1936

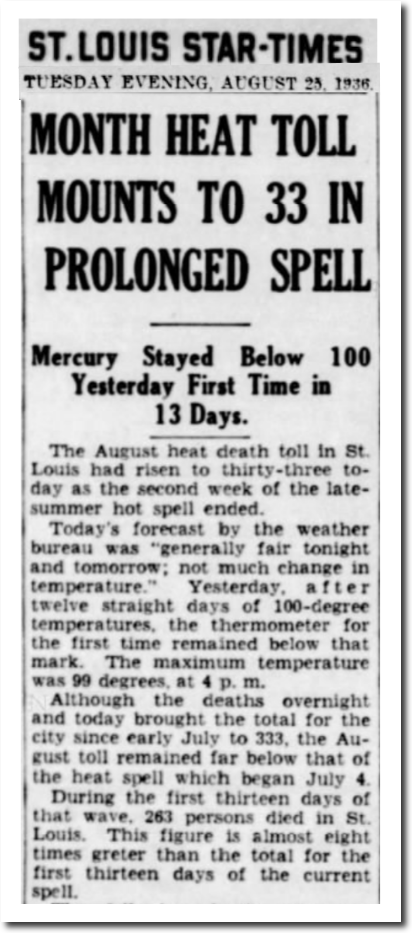
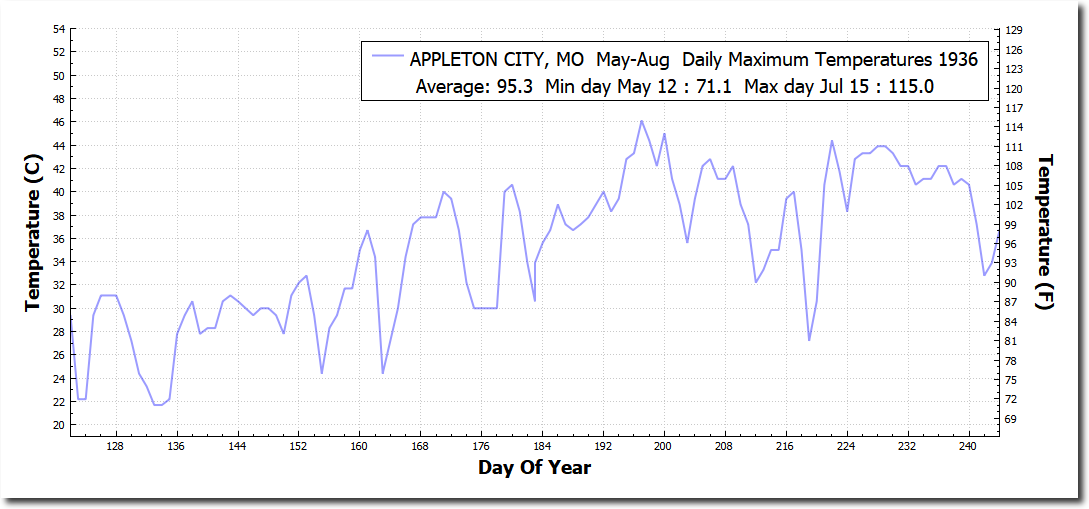
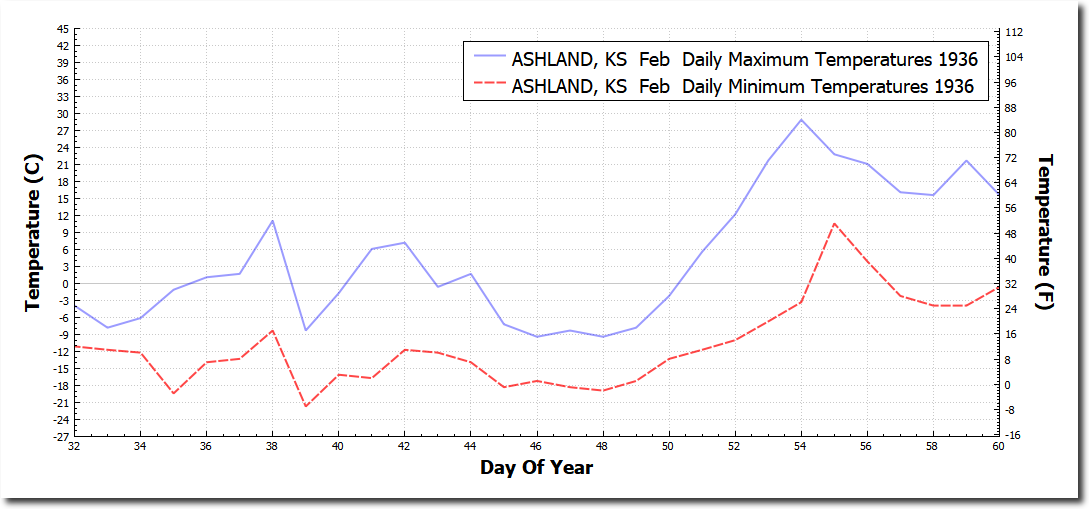
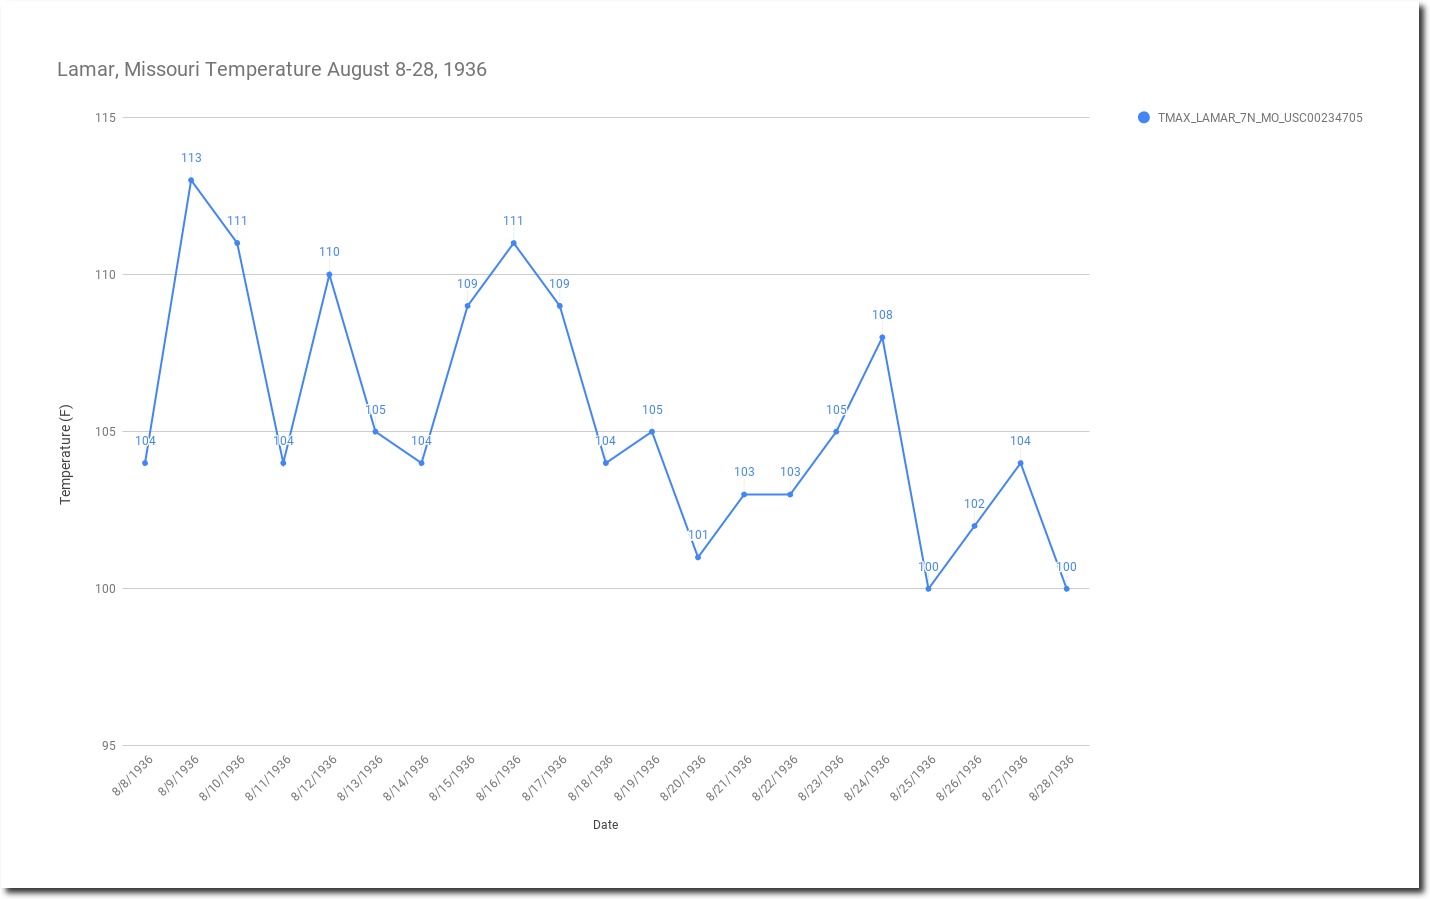
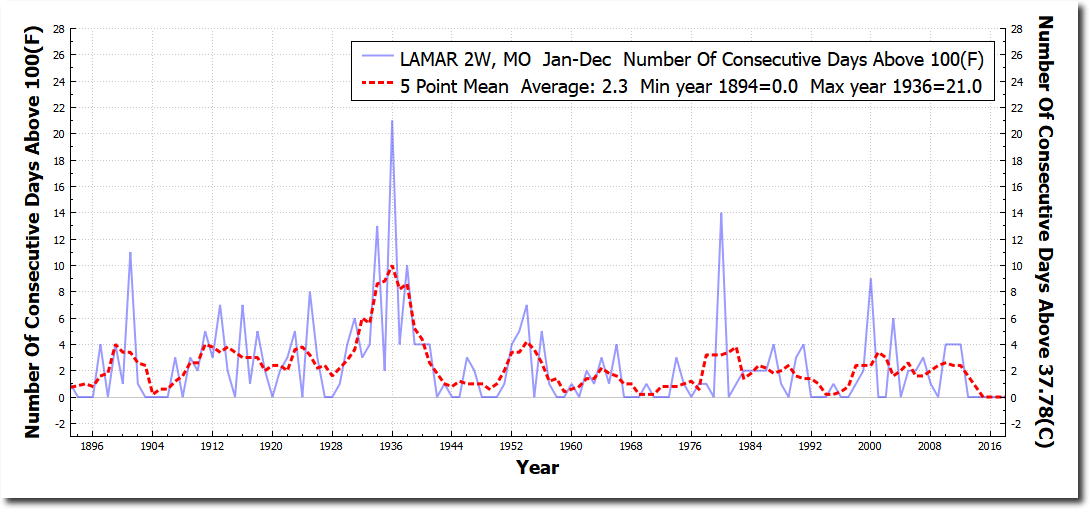
From August 8-28, 1936, Lamar, Missouri was over 100 degrees every day, and averaged 105 degrees. Peak temperature was 113 degrees.

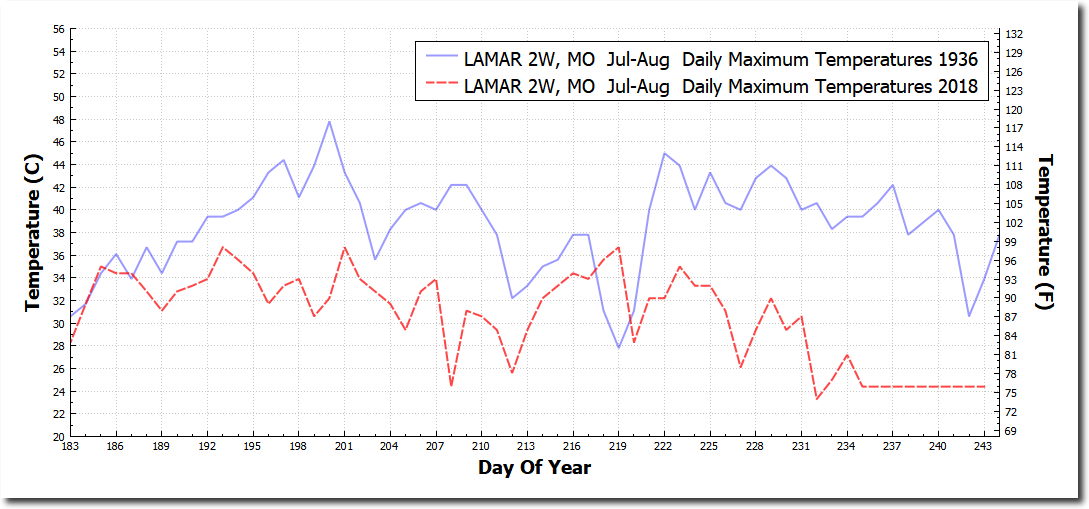
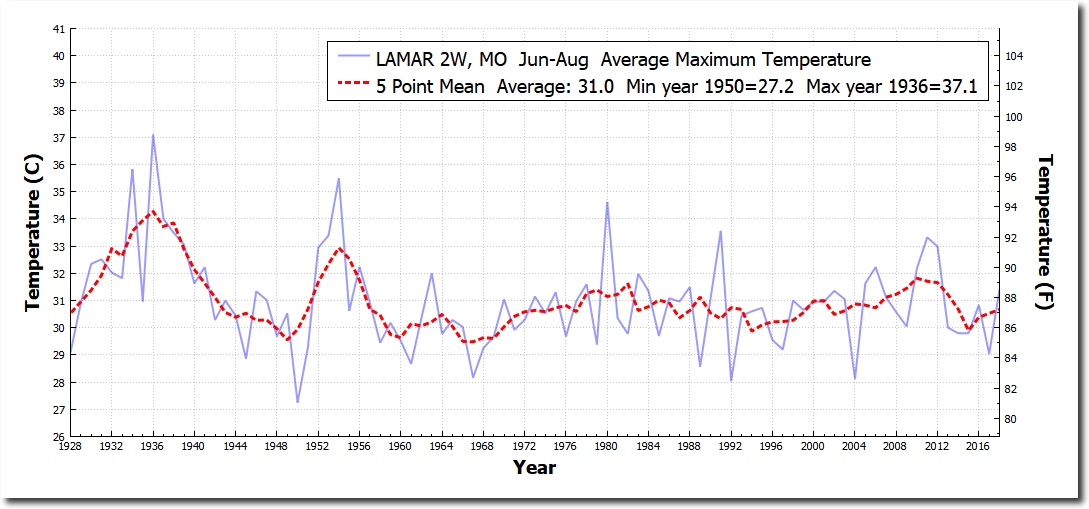
During July/August 1936 Lamar averaged 102 degrees, compared to 89 degrees in July/August 2018.  Peak temperature in 1936 was 118 degrees, compared to 98 degrees this year.

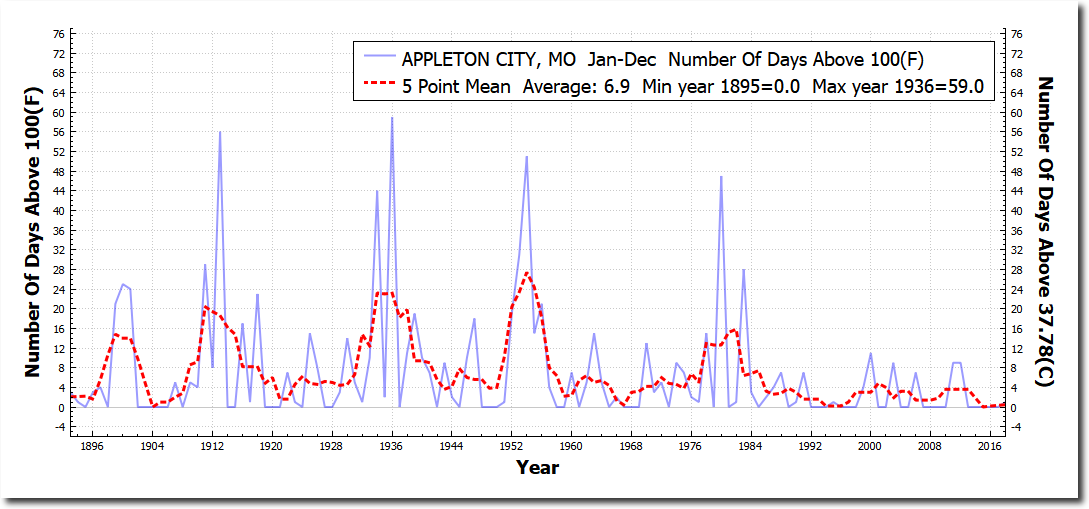
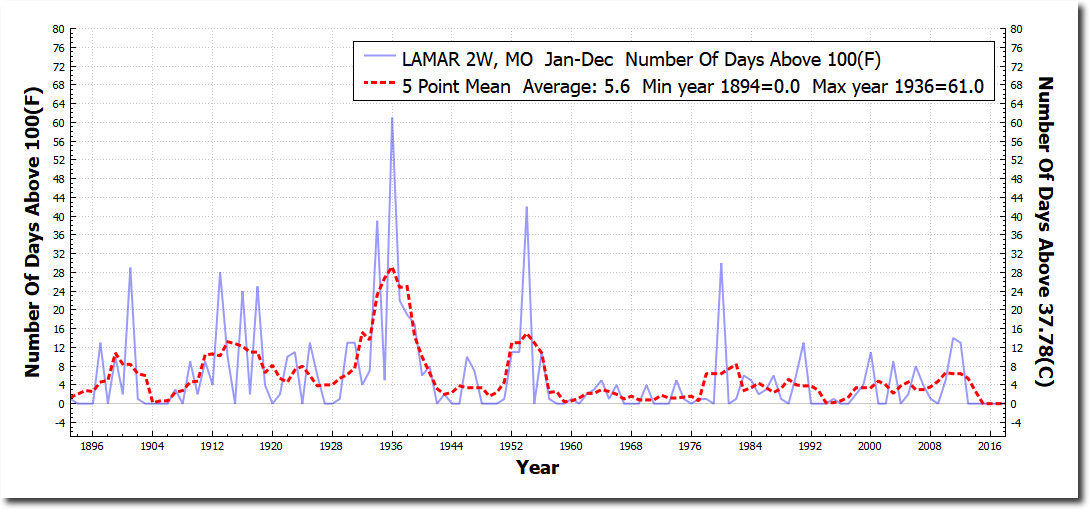
In 1936, Lamar had sixty-one days over 100 degrees, compared to no days over 100 for the past six years.

The 21 consecutive days over 100 degrees during August, 1936 was the all-time record. Lamar has now gone more than 2,000 days without reaching 100 degrees.

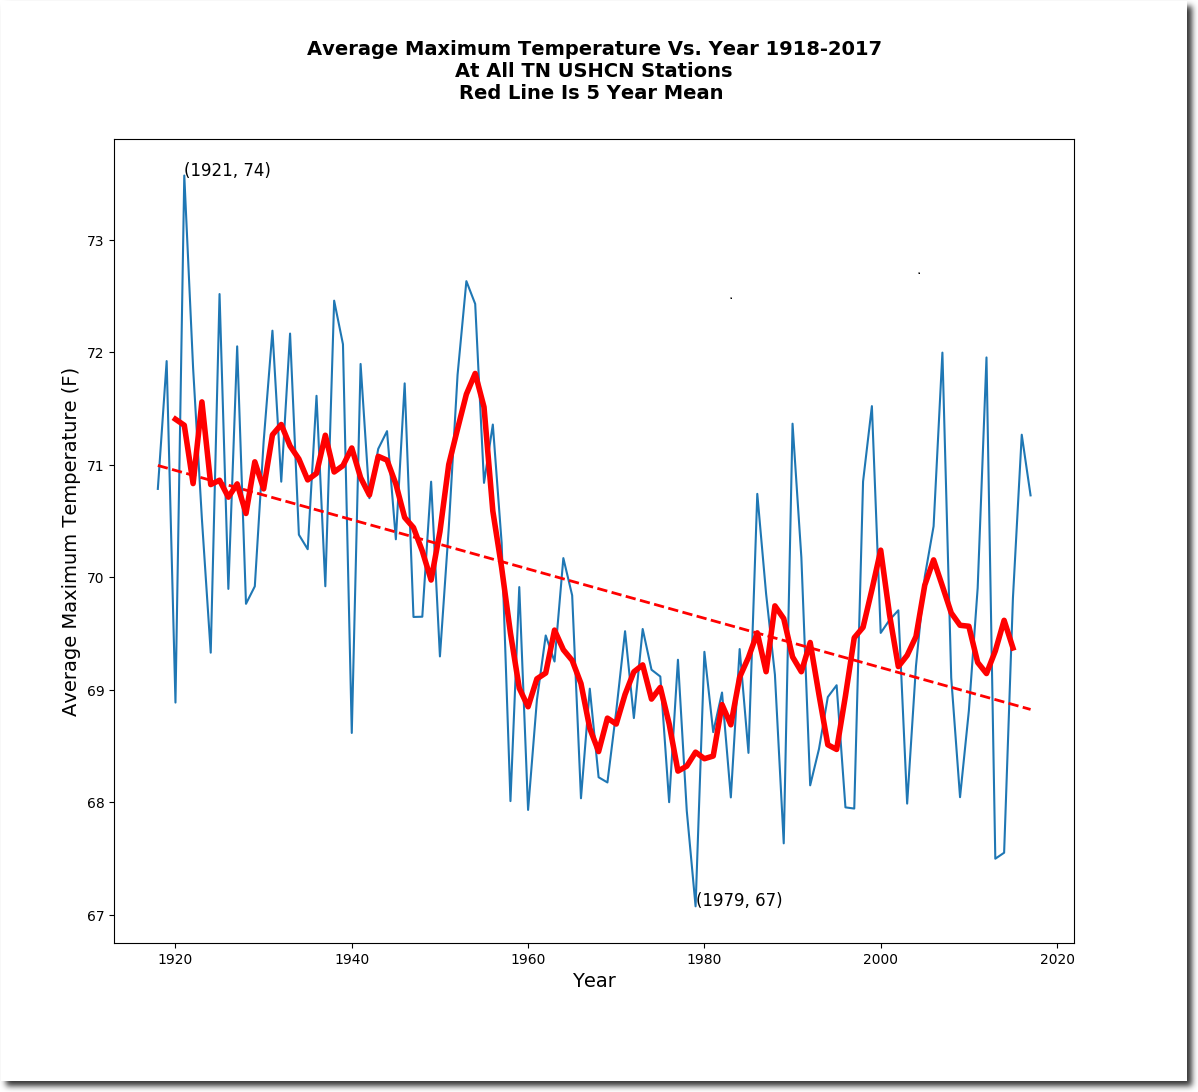
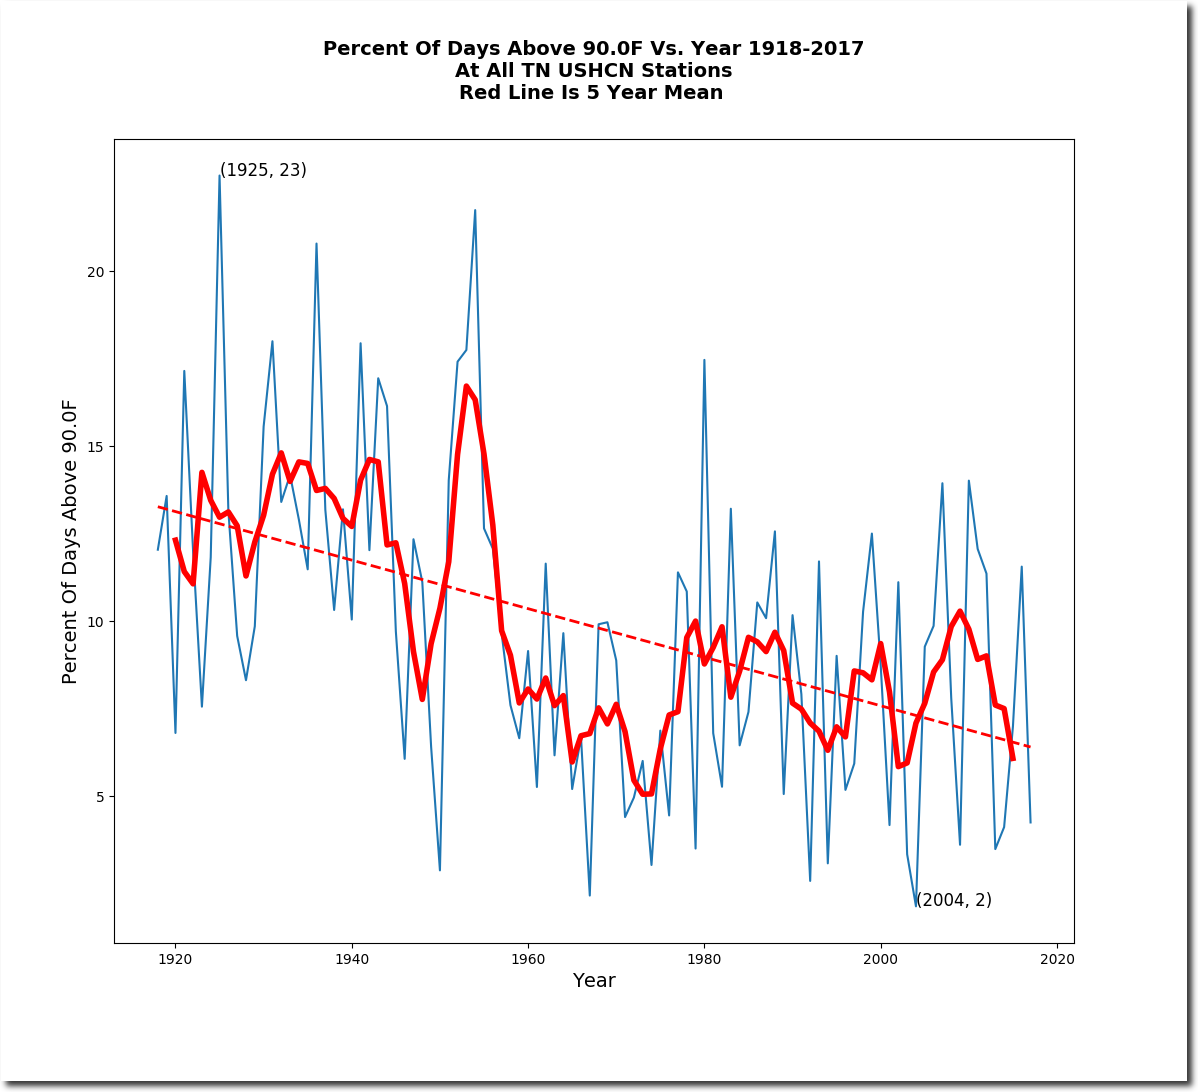
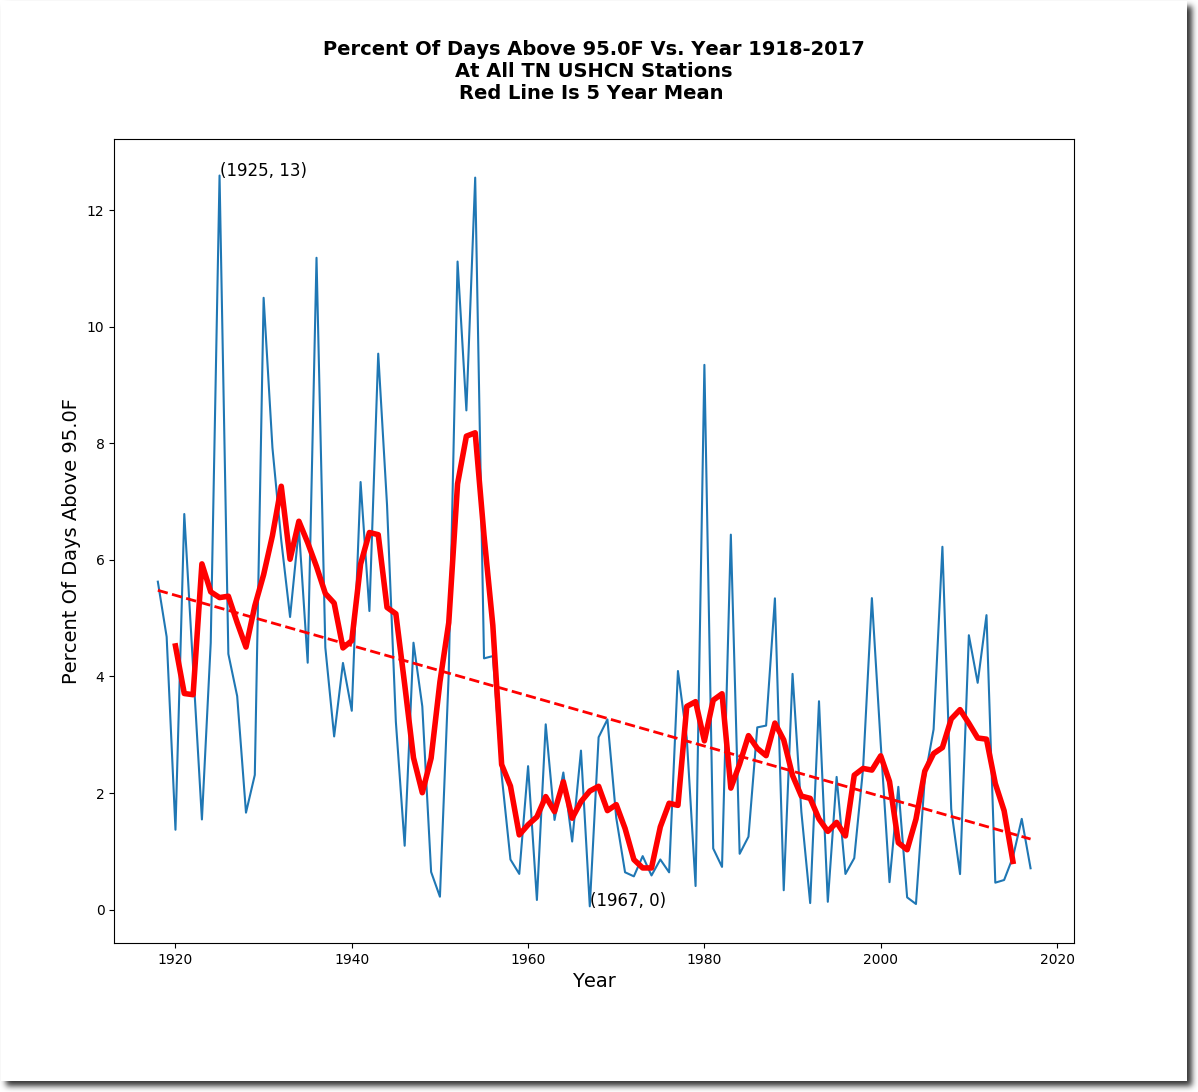
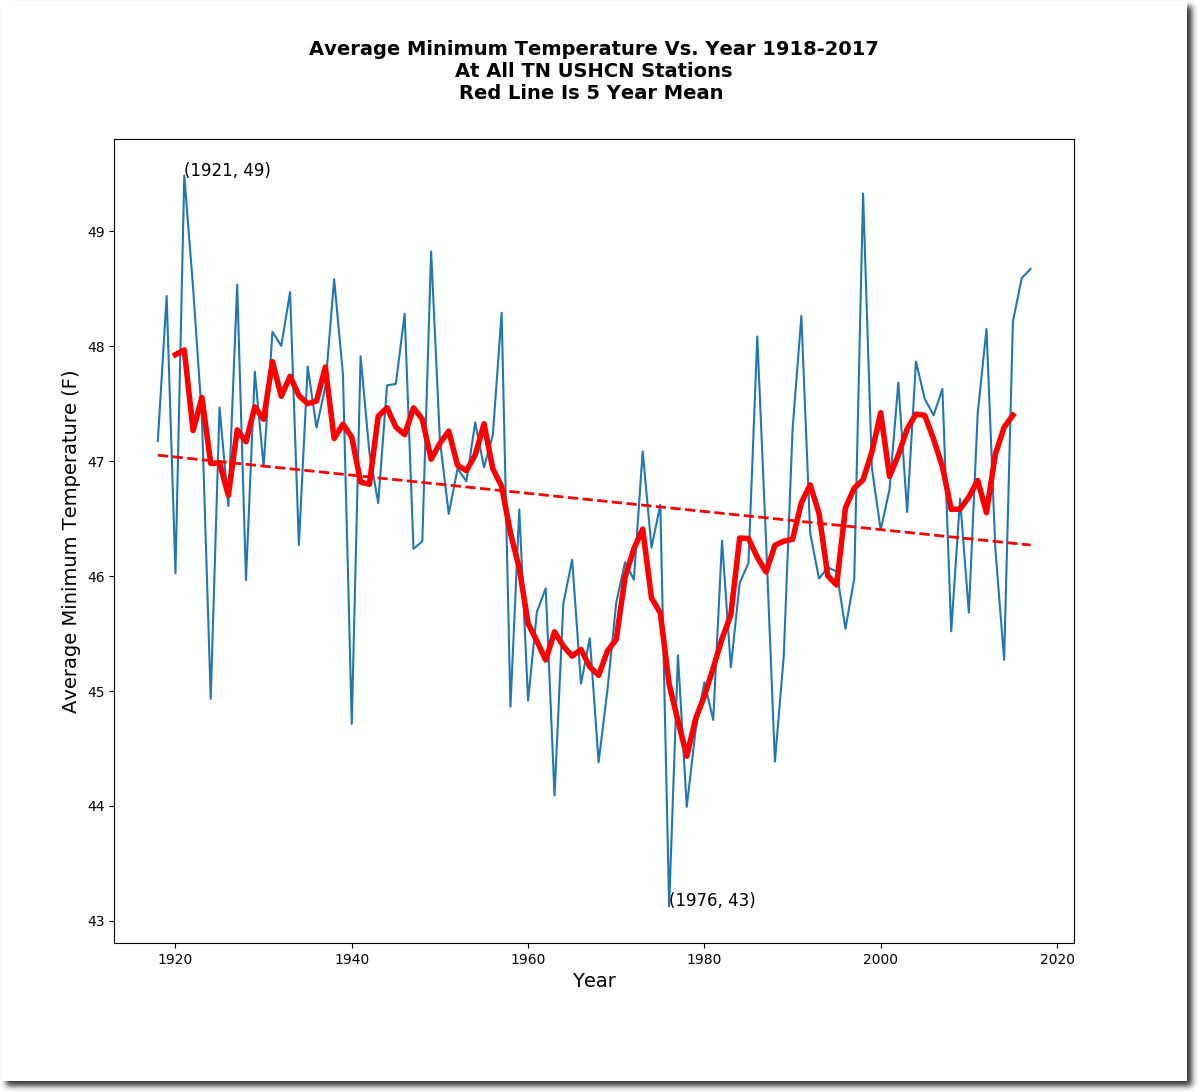
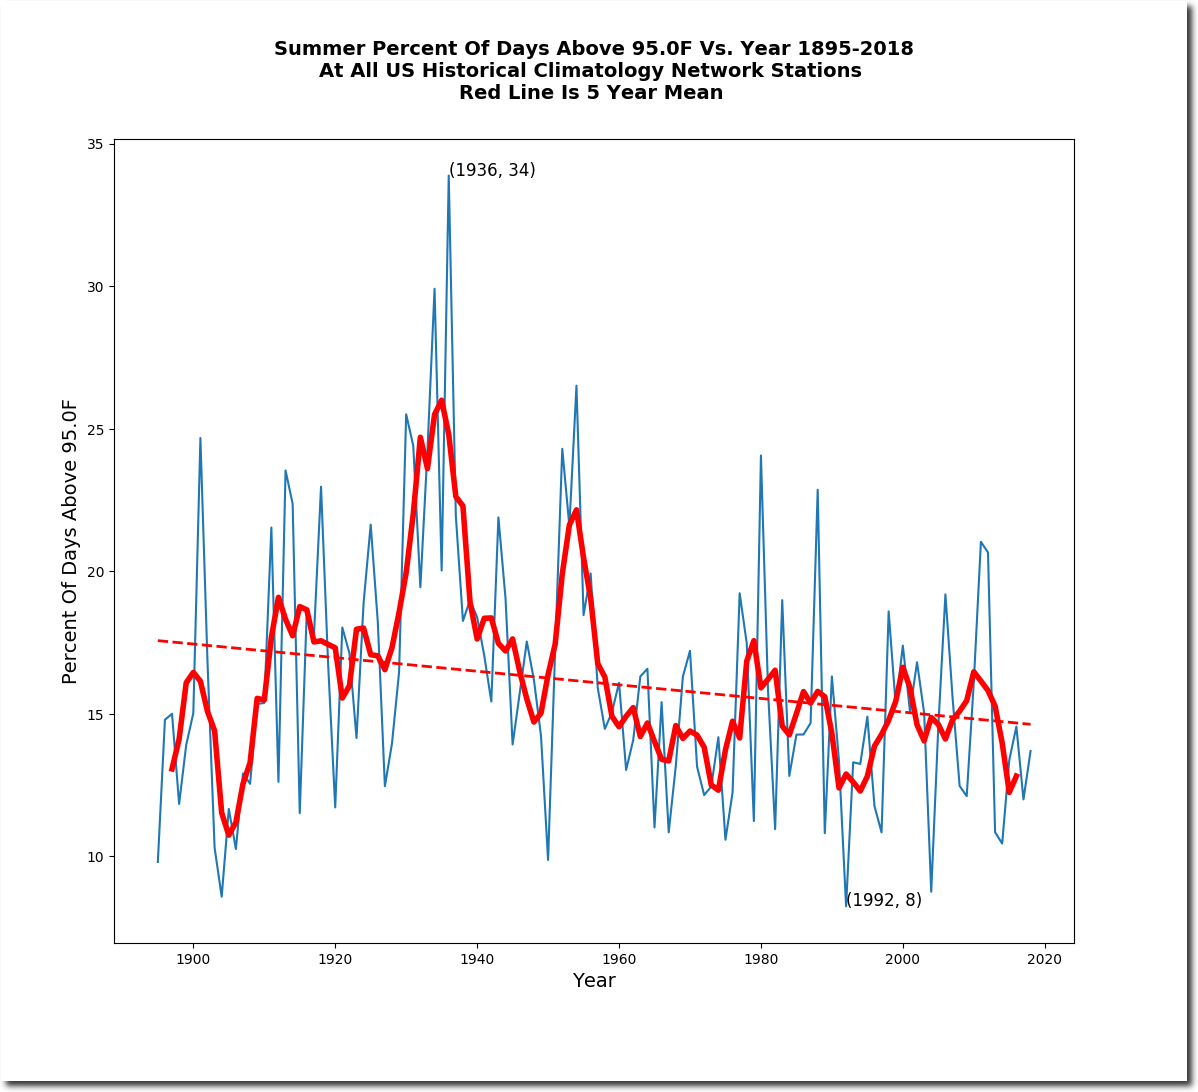
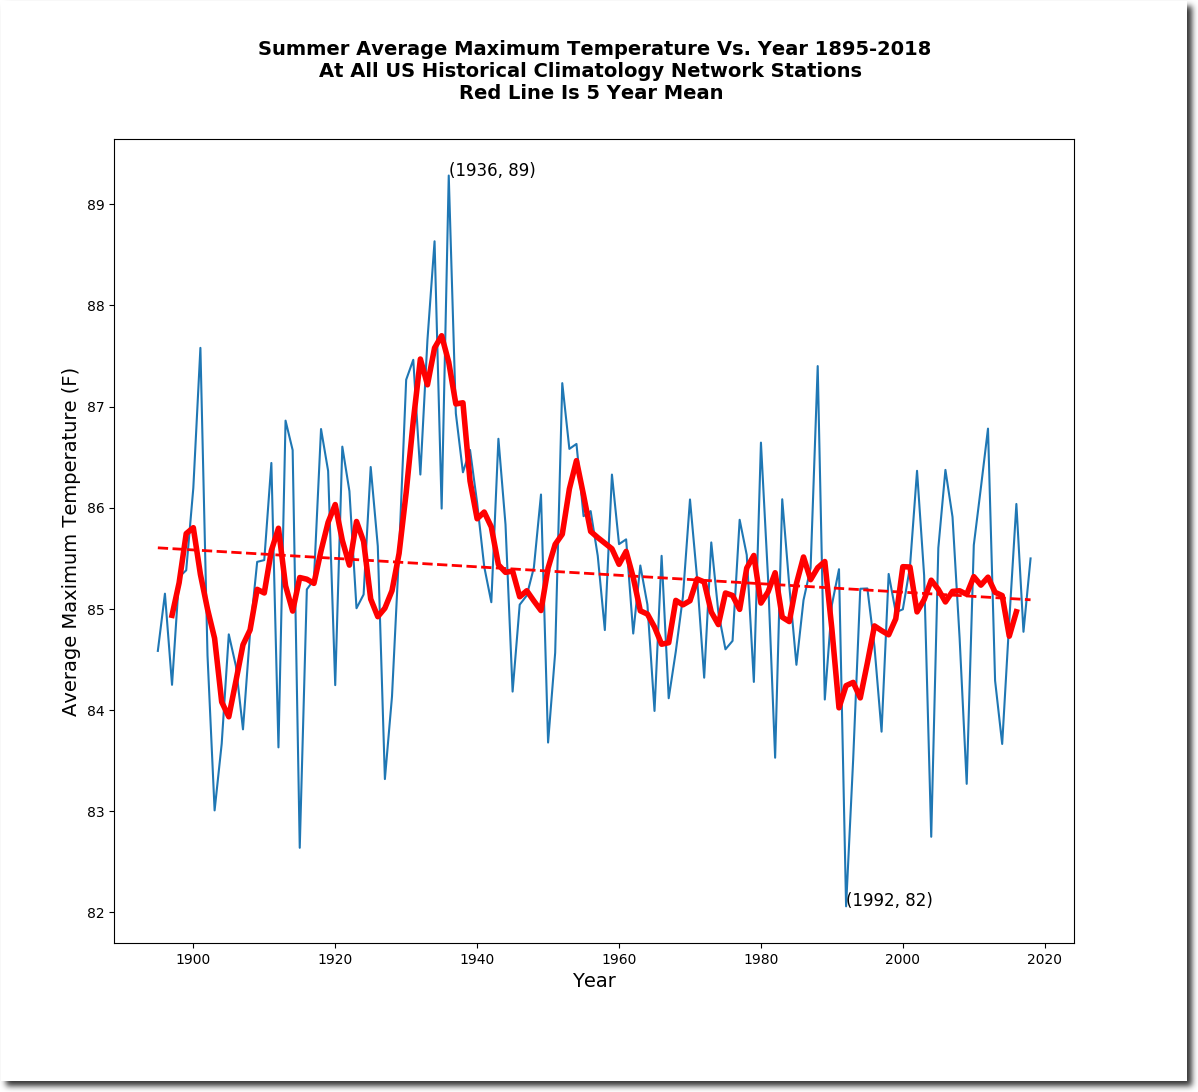
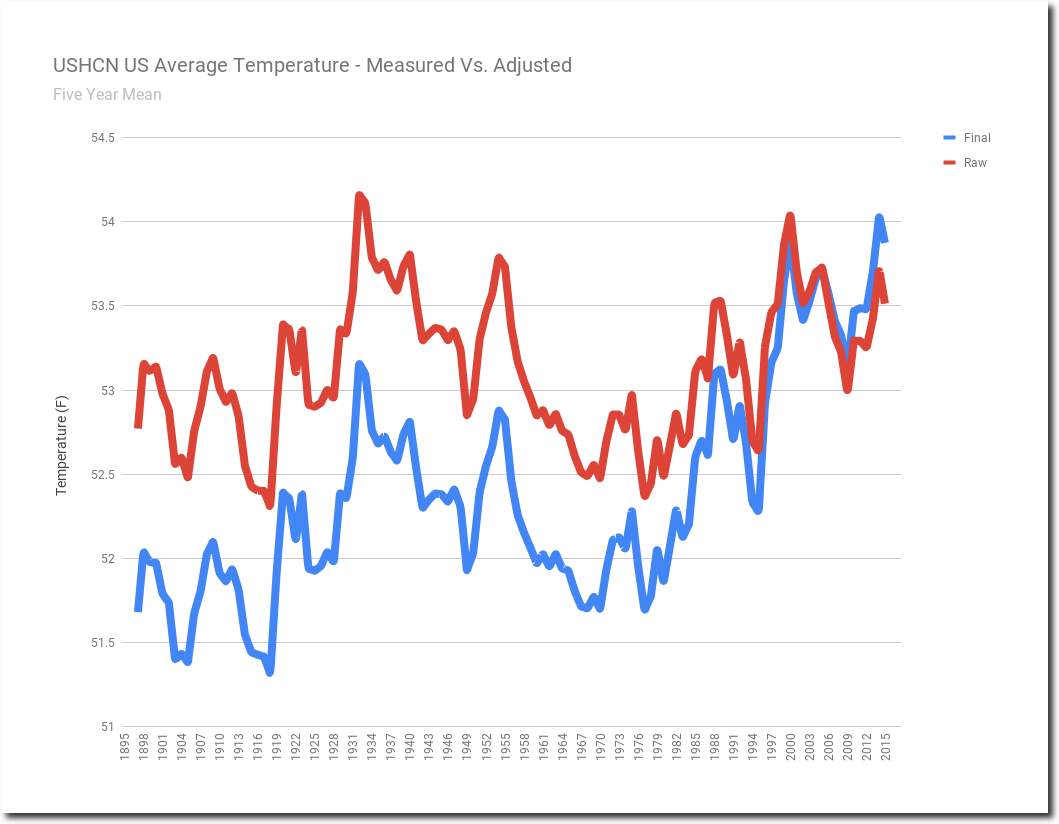
Summer afternoon temperatures in the Midwestern US have plummeted over the last 90 years, but facts and data have no meaning to climate alarmists.

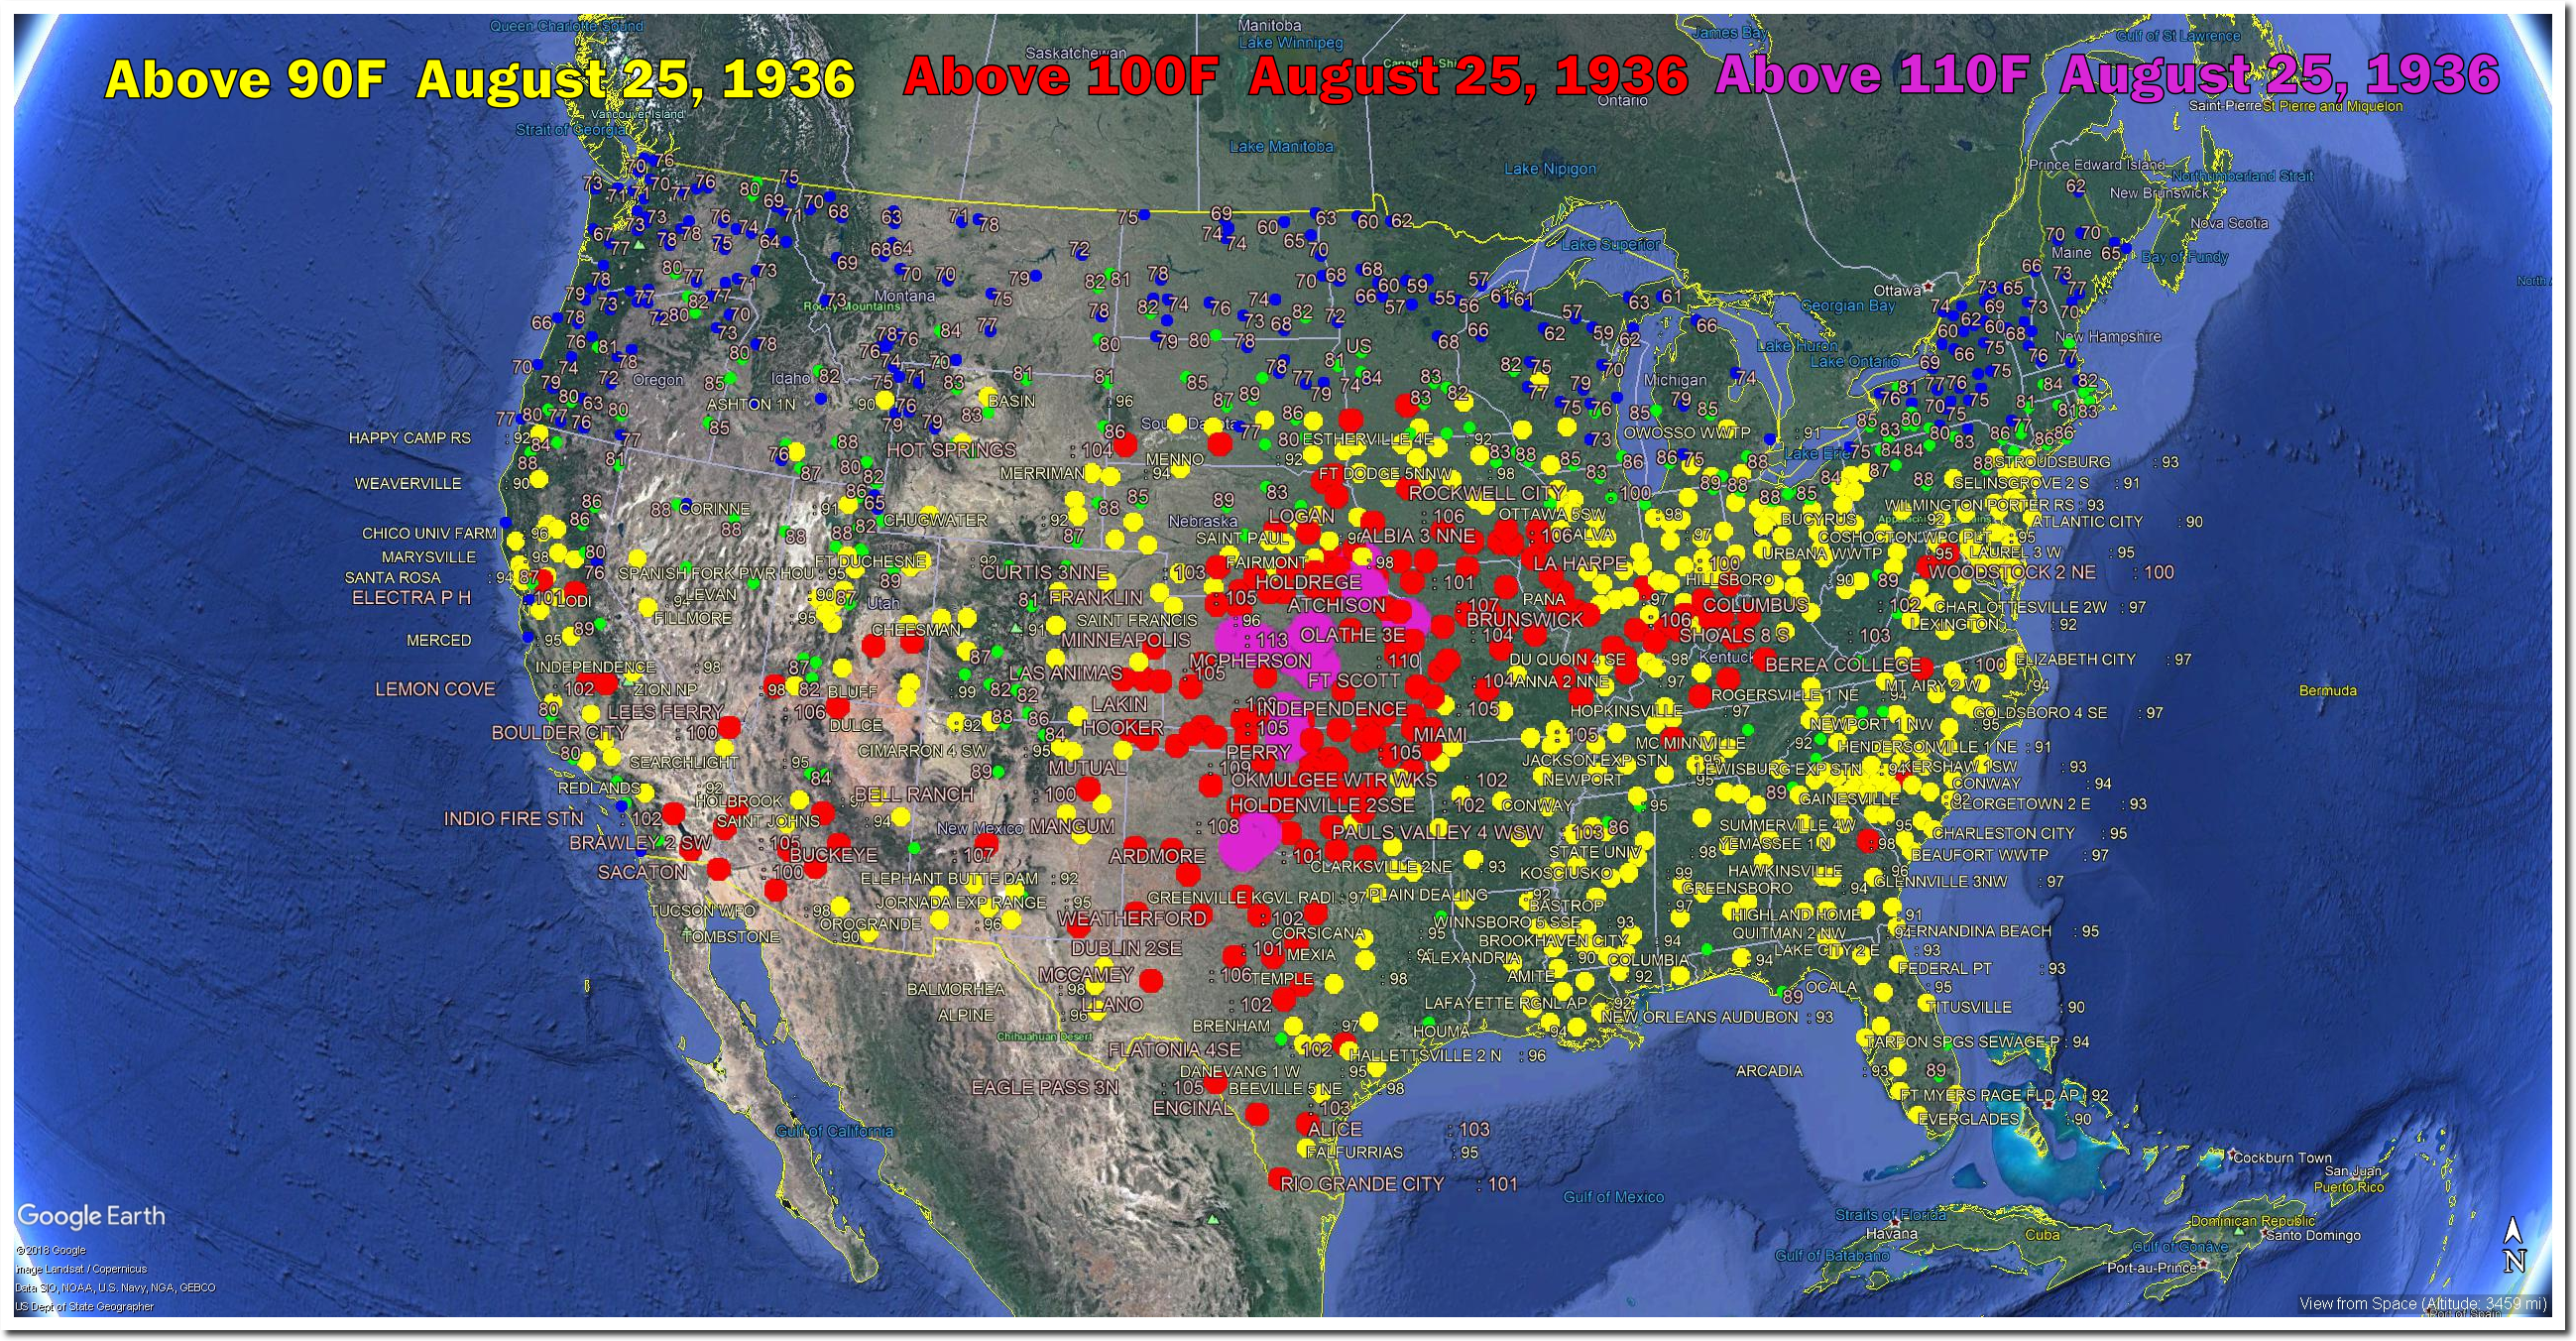
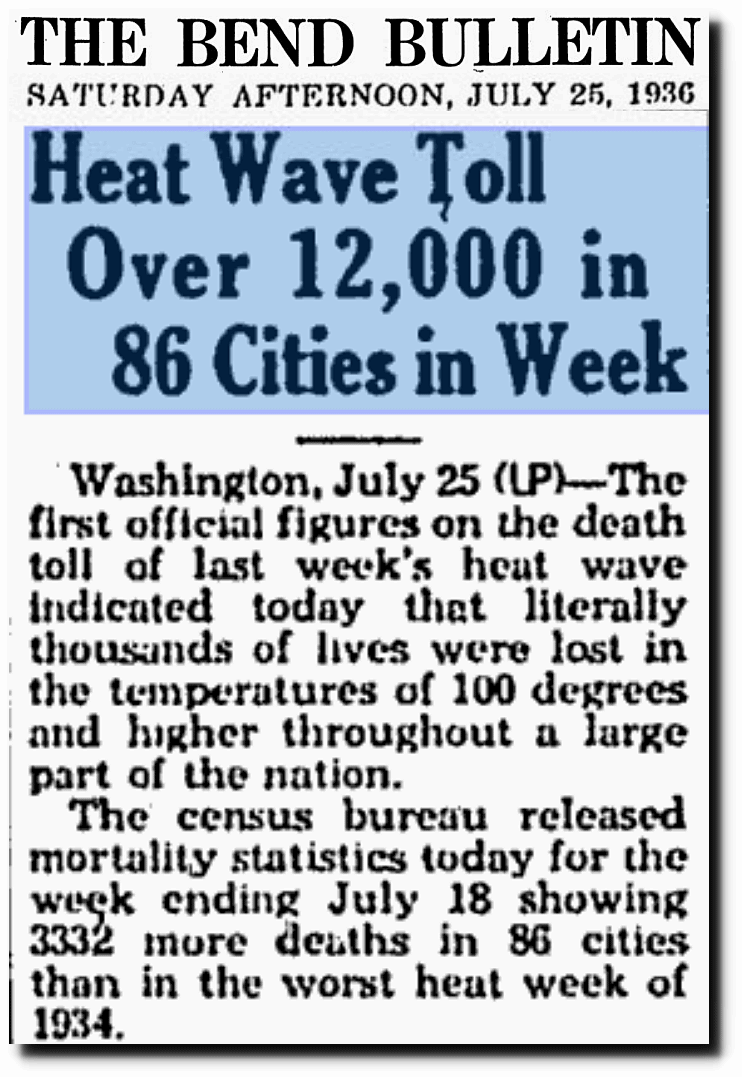
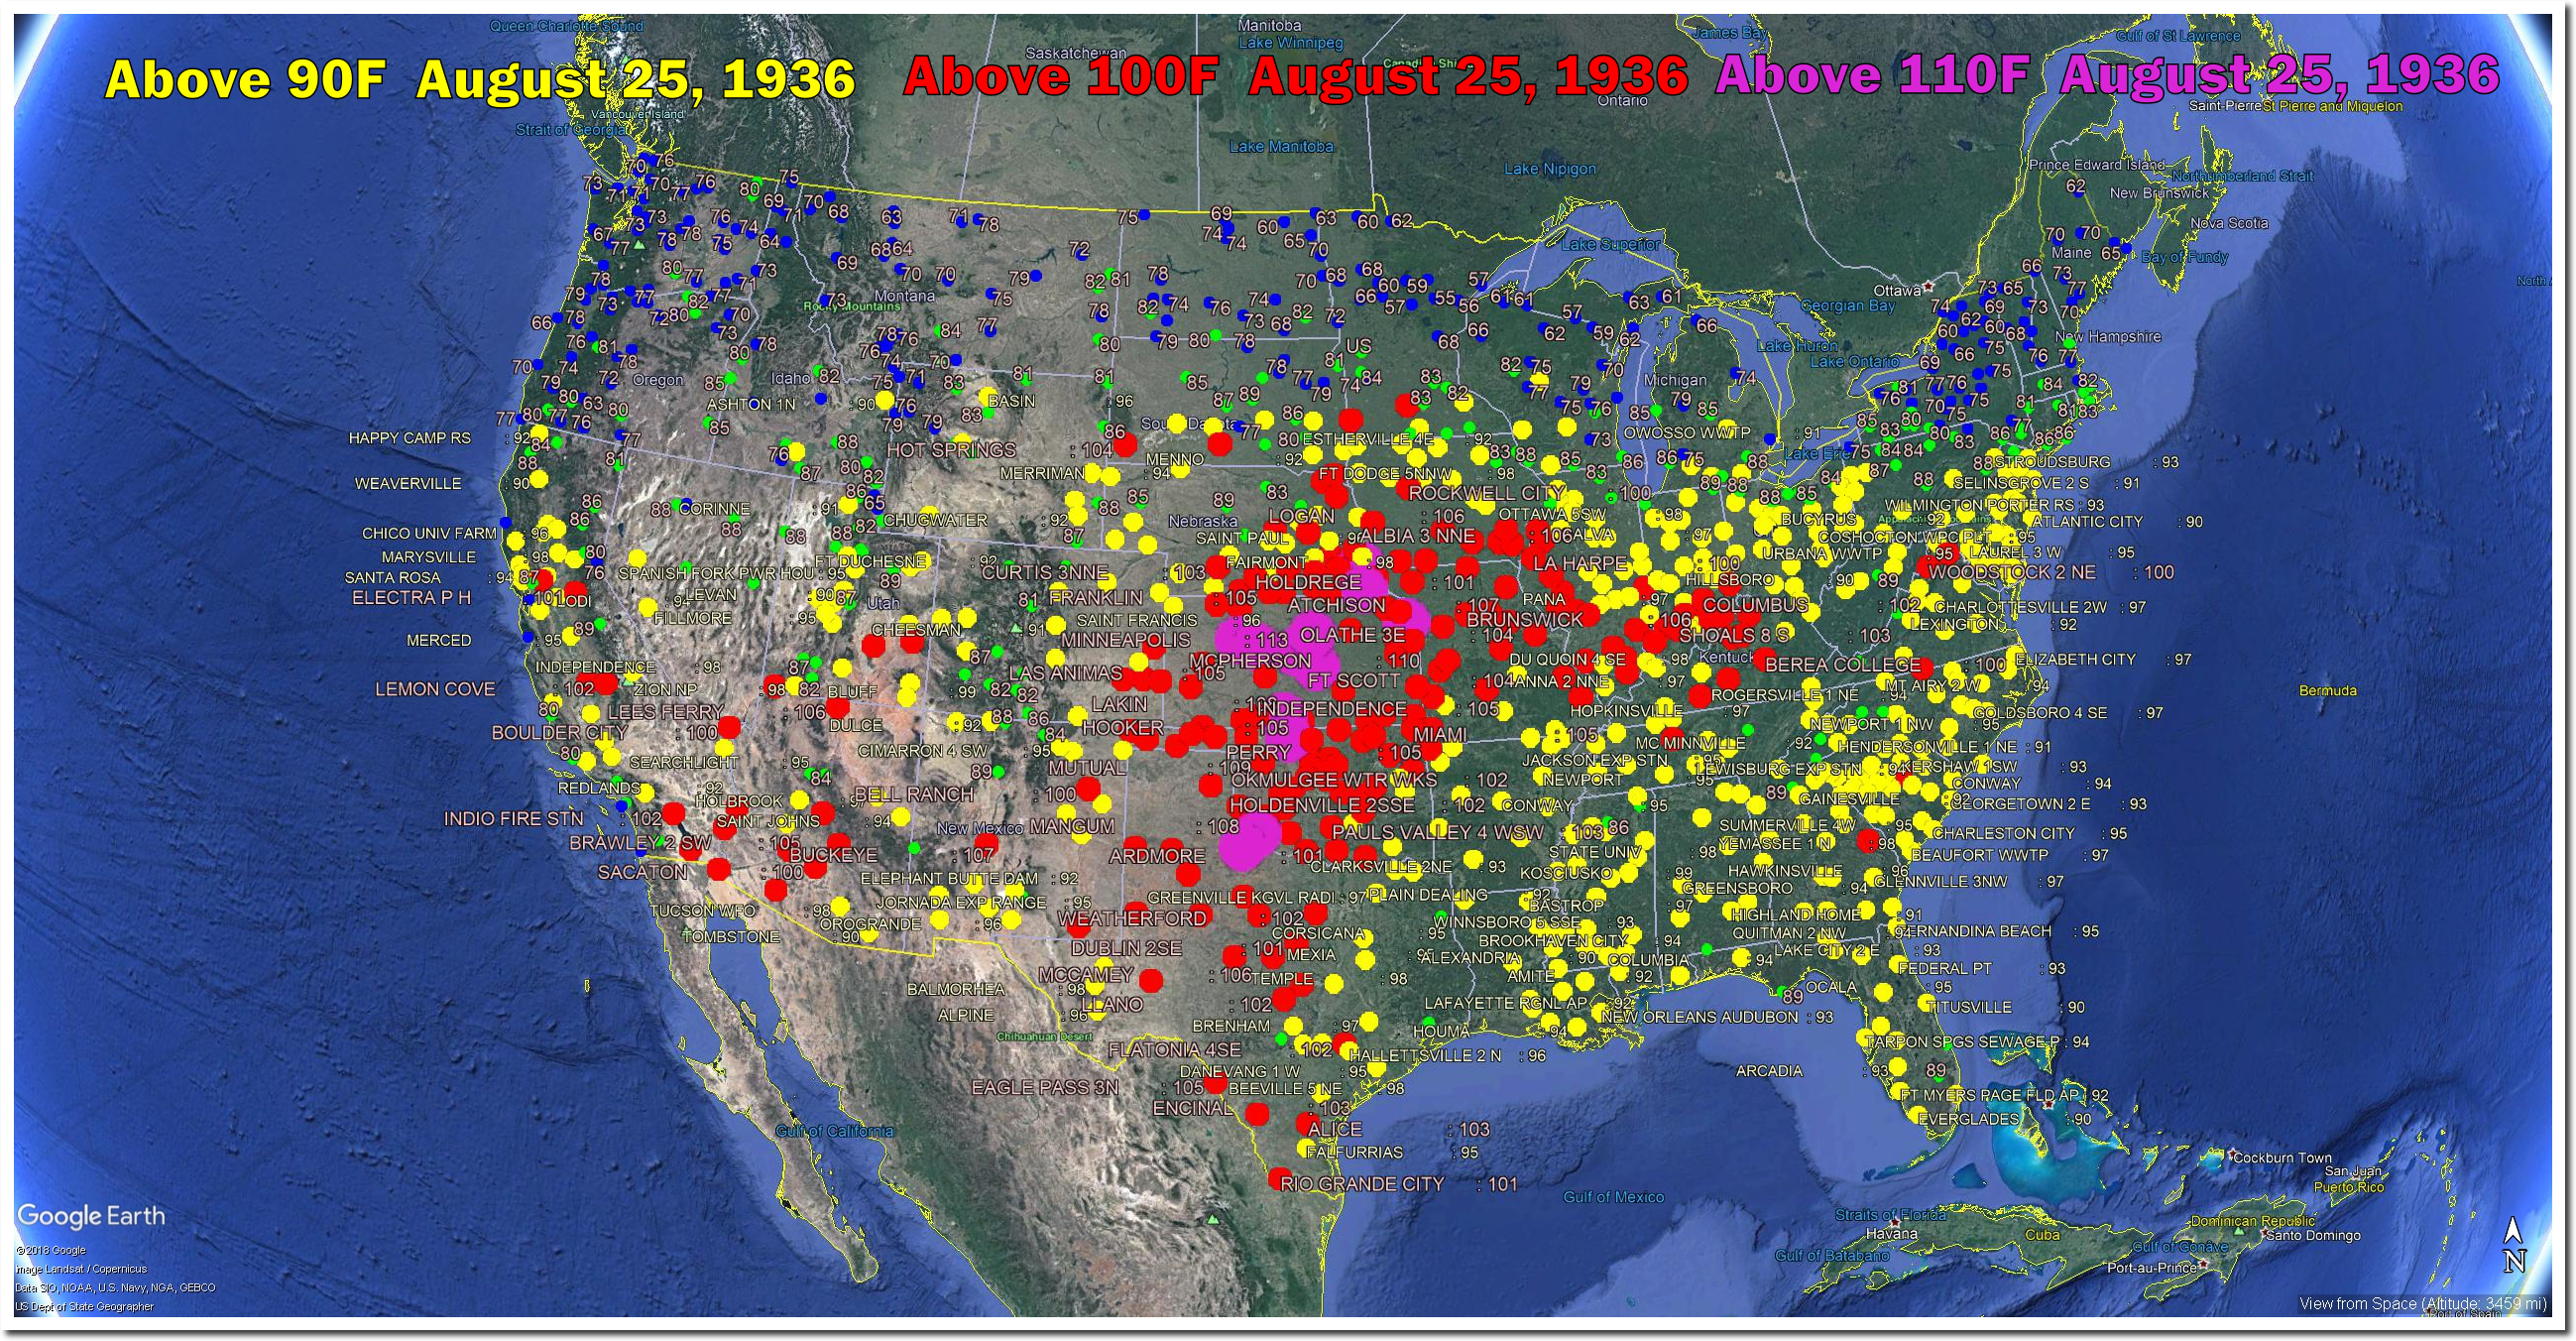
On this date in 1936, it was 113 degrees in Kansas, 112 degrees in Nebraska and Texas, and 111 degrees in Oklahoma. The were 100 degree temperatures from California to Virginia, and from Texas to Minnesota.

Posted in Uncategorized | Leave a comment

New York Times – Recycling The Same Fake News Decade After Decade

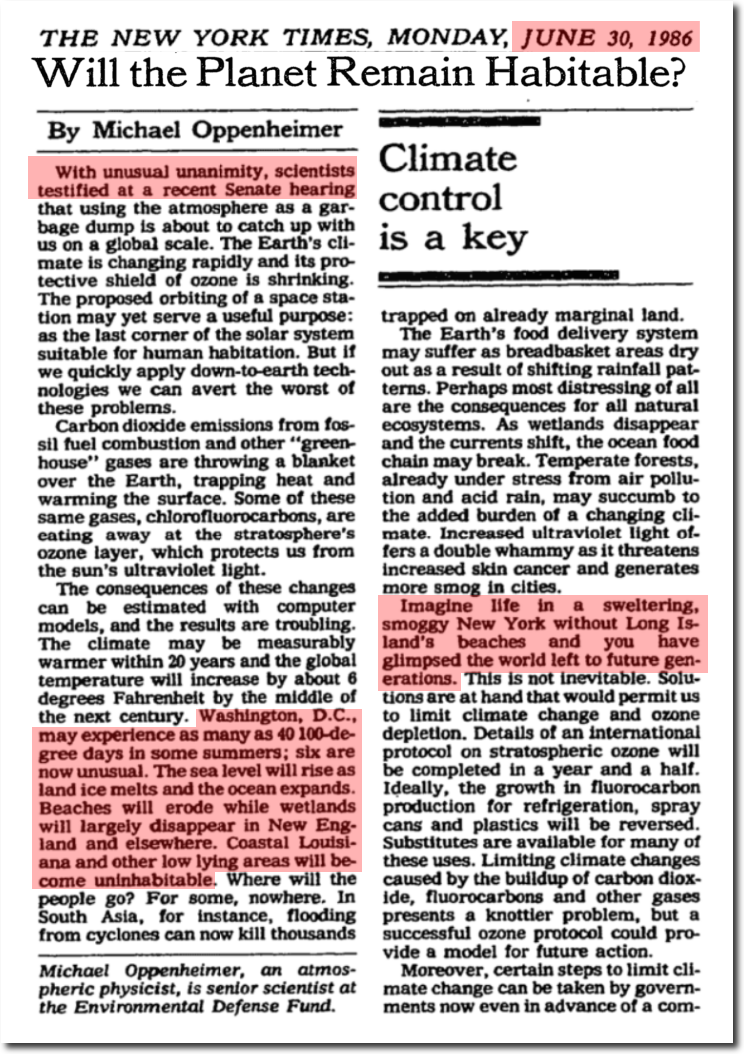
Thirty two years ago, the New York Times predicted forty days per summer over 100 degrees in Washington D.C., and that New York would become sweltering hot without any beaches.

https://timesmachine.nytimes.com/timesmachine/1986/06/30/issue.html

The frequency of 100 degree days in the Washington D.C. area has declined since the 1930’s, and now temperatures over 100 degrees happen very rarely.

The frequency of hot days in New York has declined.

And Long Island beaches are doing just fine.
Long Beach NY Beach Cam & Surf Report

Undaunted by facts, reality, ethics or journalistic integrity, the New York Times continues cranking out the same nonsense.
Posted in Uncategorized | Leave a comment

Correlating CO2 And Glacial Cycles

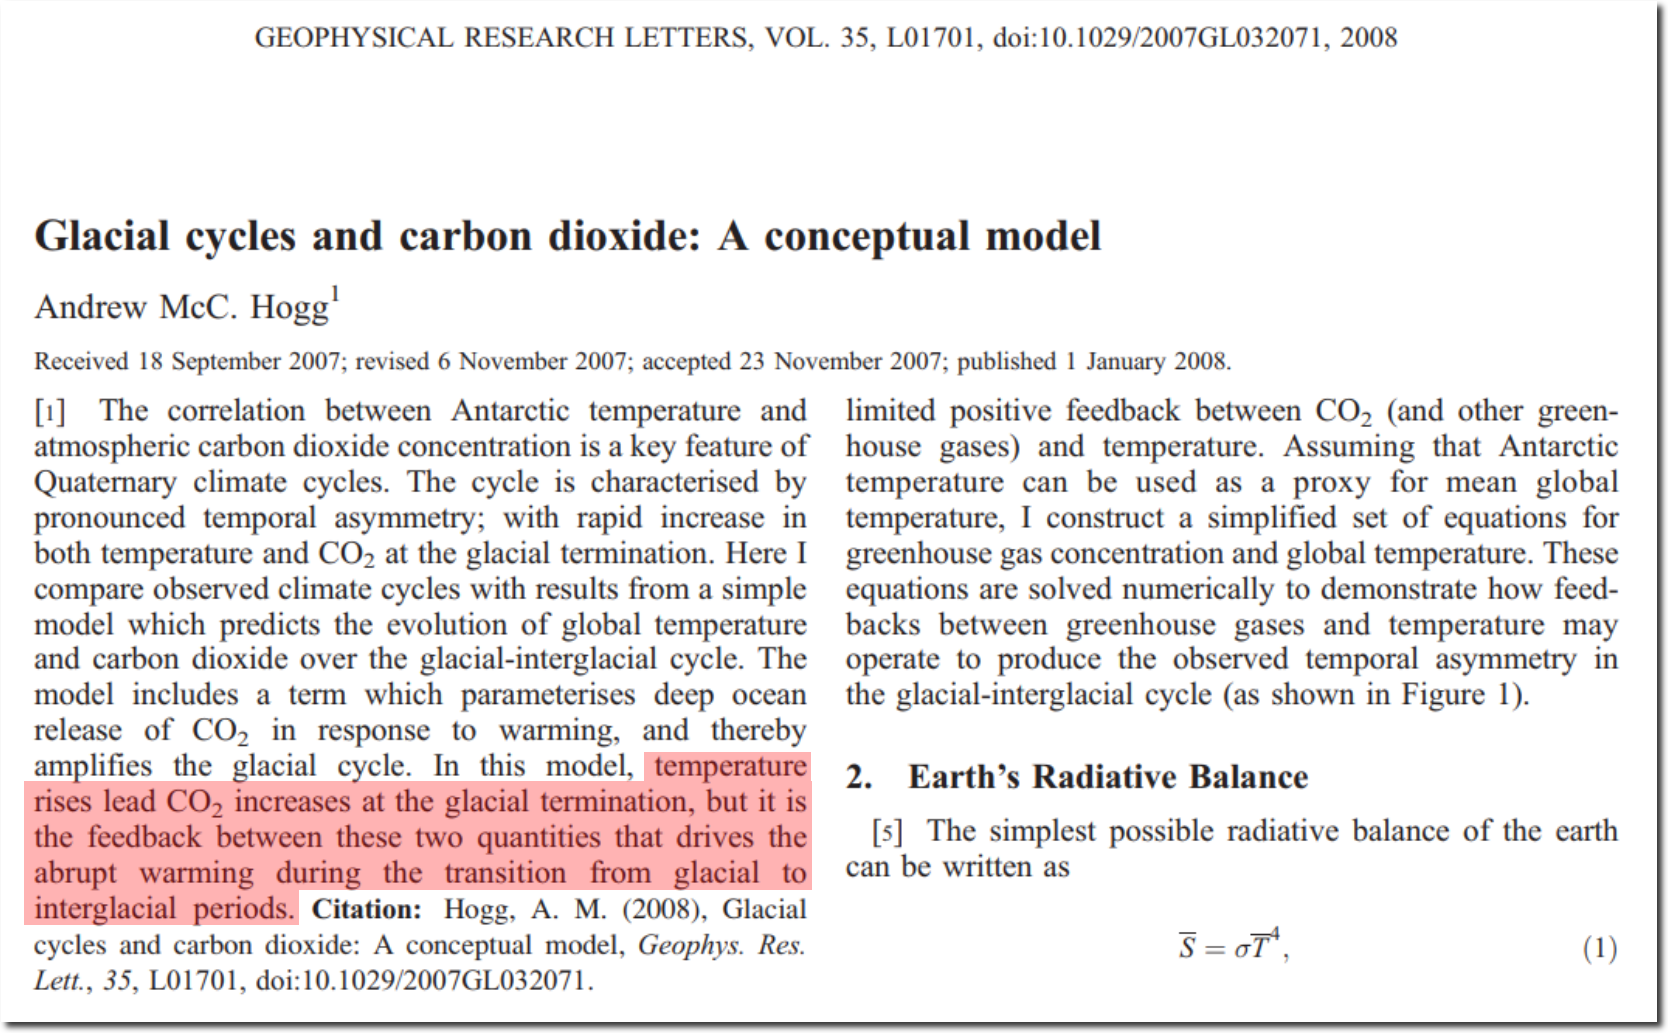
Climate scientists acknowledge that CO2 follows rather than leads temperature, but they insist that feedback loops drive the transitions from glacial to interglacial conditions.

Glacial cycles and carbon dioxide: A conceptual model

Let’s see if that makes any sense,  by making a few observations.

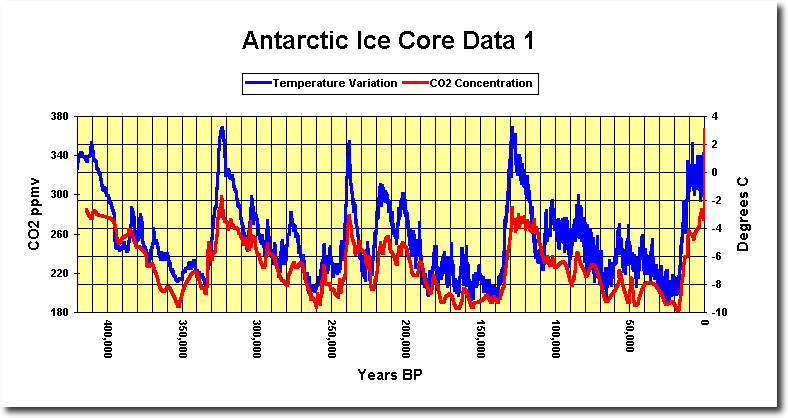
New Antarctic Ice Core Data

  1. Ice ages begin when CO2 is at a maximum. Ice ages end when CO2 is at a minimum. Both are the exact opposite of global warming theory.
  2. Sometimes temperatures rise quickly at 320 PPM CO2.  Sometimes temperatures fall quickly at 320 PPM CO2
  3. Sometimes temperatures rise quickly at 200 PPM CO2. Sometimes temperatures fall quickly at 200 PPM CO2

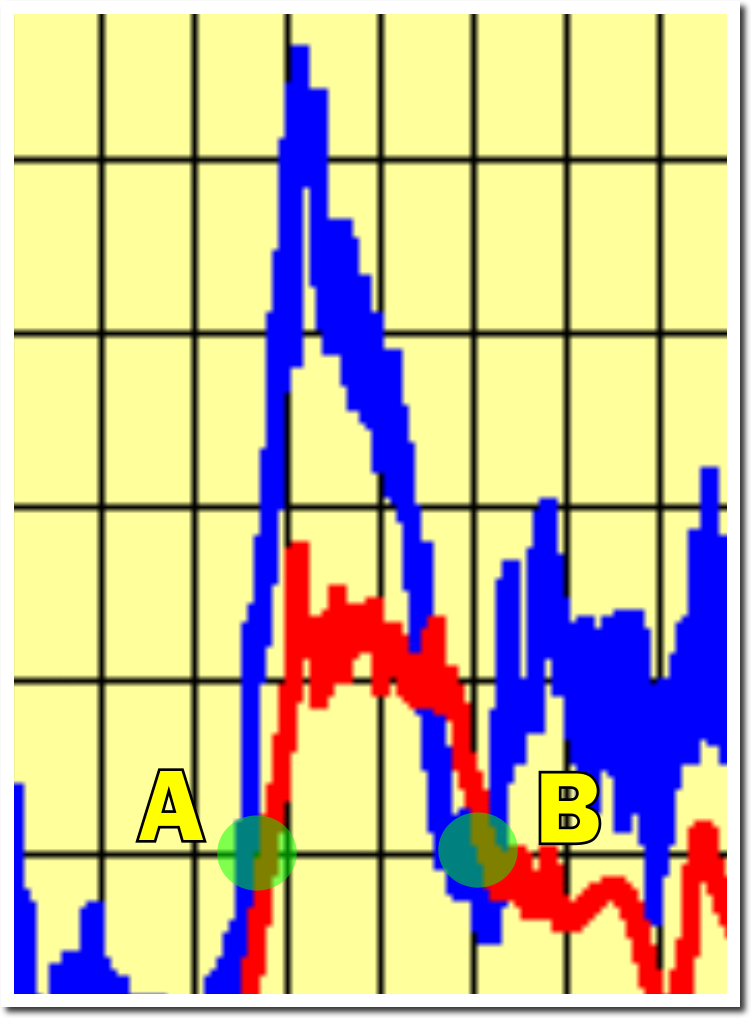
None of these observations are consistent with the idea that CO2 drives temperature.  CO2 follows ocean temperature, and there is zero empirical evidence of any reverse relationship. Consider points A and B below.  Same temperature and same CO2 level, yet at point A temperature is rising quickly, and at point B, temperature is falling quickly. Shortly thereafter, temperatures were rising quickly again.  This shows unequivocally that any effects of CO2 are trivial compared to the driving factors of climate.

If CO2 was the temperature control knob, it would be impossible to either start or  get out of an ice age. Obviously CO2 is not the control knob of temperature.

Posted in Uncategorized | Leave a comment

Greenland Melting Scam Crashes And Burns

For the second year in a row, Greenland’s surface has gained far above normal amounts of ice.

Greenland Ice Sheet Surface Mass Budget: DMI

For climate alarmists, reality is the enemy. So they scan the globe for any data point they can cherry pick. And if that doesn’t work, they simply make things up.

Posted in Uncategorized | Leave a comment

Graphing For Griff

Griff’s point is correct, but is irrelevant in the context of my graphs.

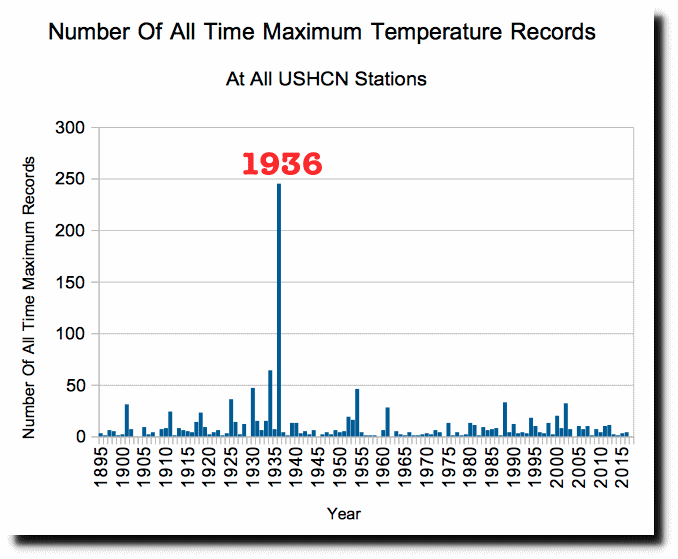
This is the graph as of August 22, 2018.  It is clear that 1936 was the hottest year.

If instead of being 2018, this was 1910 – my Google spreadsheet graph would look like this. Almost all of the records would have been set during the very hot year of 1901, instead of 1936.

This is what my Google graph would have looked like when Bernie Sanders was a teenager in 1930.

If instead of being 2018, this was 1895 (when Arrhenius invented junk climate science) – my Google spreadsheet graph would look like this.  Every single record would have been set that year.

As new years are added, some of the old records are beaten.   There is no time bias to my graphs, and it is silly that US cooling deniers continue to beat this dead horse.

Posted in Uncategorized | Leave a comment

Football Season!

“films, football, beer and above all, gambling filled up the horizon of their minds. To keep them in control was not difficult.”

  • George Orwell, 1984

Posted in Uncategorized | Leave a comment

Latest Graphing Conspiracy Theory

The latest graphing conspiracy theory is that shape of the graphs are affected by the fact that fewer stations report now than 30 years ago.  If I plot the same graphs for the set of all stations which were active in both 1930 and 2017, the evidence is even stronger – because stations with short term records excluding the hot 1930’s, don’t get included.

The US used to be much hotter than it is now.  Reality is difficult to accept by climate alarmists.


Posted in Uncategorized | Leave a comment

Scientists Locate The “Last Arctic Ice”

Climate scientists have located the last ice in the Arctic, and say it is melting.

Arctic’s strongest sea ice breaks up for first time on record | World news | The Guardian

With the Arctic full of ice, they had to work pretty hard to find something to lie about.

Winds pushed the ice off shore north of Greenland.

NASA Imagery

Temperatures in Greenland are quite cold.

Ventusky – Wind, Rain and Temperature Maps

The level of desperation and fraud among these people seems to know no bounds.

Posted in Uncategorized | Leave a comment

Sunset Pictures

Posted in Uncategorized | Leave a comment

Algorithm For Counting Records

Every time I post a graph showing temperature records, all kinds of wild theories are made claiming that early years show more records simply because they are early.  This is complete nonsense. The algorithm below is the basis of the counting.

max = -1000.0
max_year_list = []

for year in range(1895, 2018) :
    if (temperature[year] > max) :
        # Start a new list if the old record is beaten
        max_year_list = [year]
        max = temperature[year]
    else if (temperature[year] == max) :
        # Append to the list if the old record is tied
        max_year_list.append(year)

The only way a record gets counted is if it is highest temperature from 1895-2018.

Posted in Uncategorized | Leave a comment