Usually July is a very brown month here in Boulder, but we have had lots of rain this spring and early summer, and it is the greenest I have ever seen it in July.








Usually July is a very brown month here in Boulder, but we have had lots of rain this spring and early summer, and it is the greenest I have ever seen it in July.
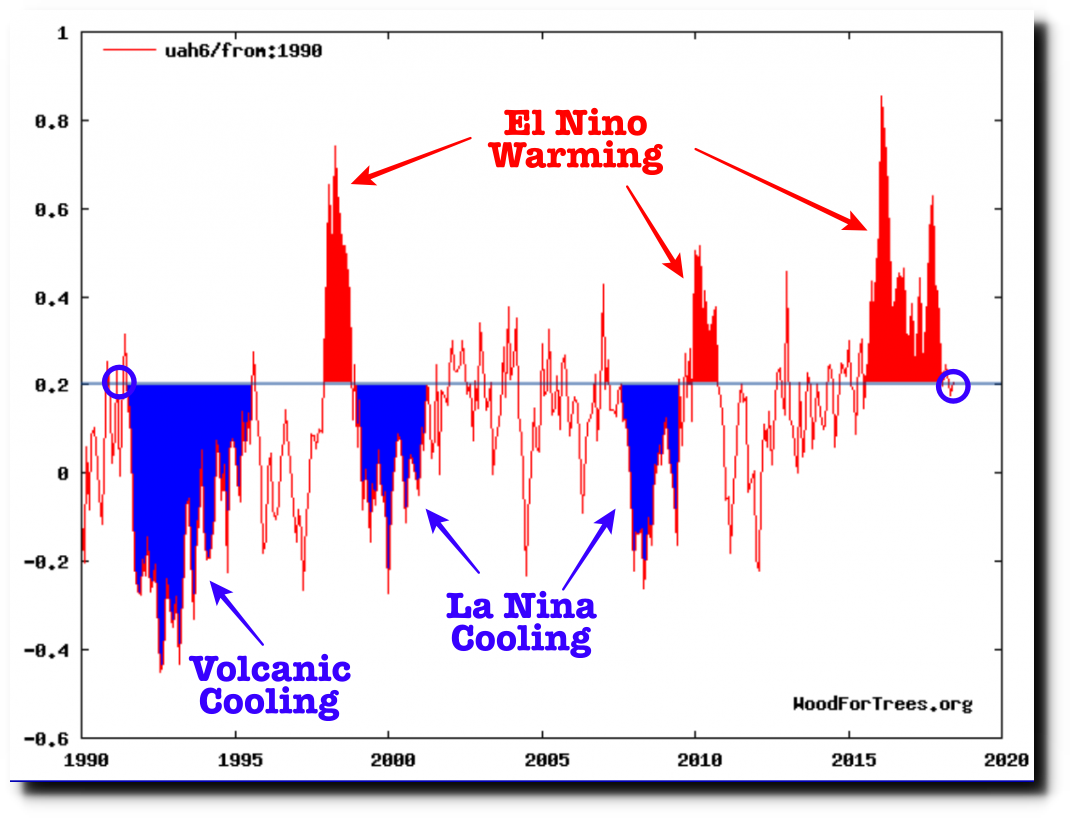
Satellite data shows that current troposphere temperatures are about the same as 1991 and 1995. Other than spikes and dips caused by volcanoes and ENSO events, there has been no change in temperature.
Wood for Trees: Interactive Graphs
The 1995 IPCC report showed no change in troposphere temperature from 1958 to 1995, based on satellite and balloon observations.
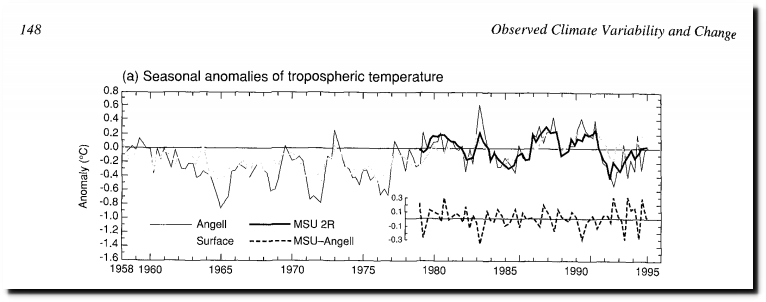
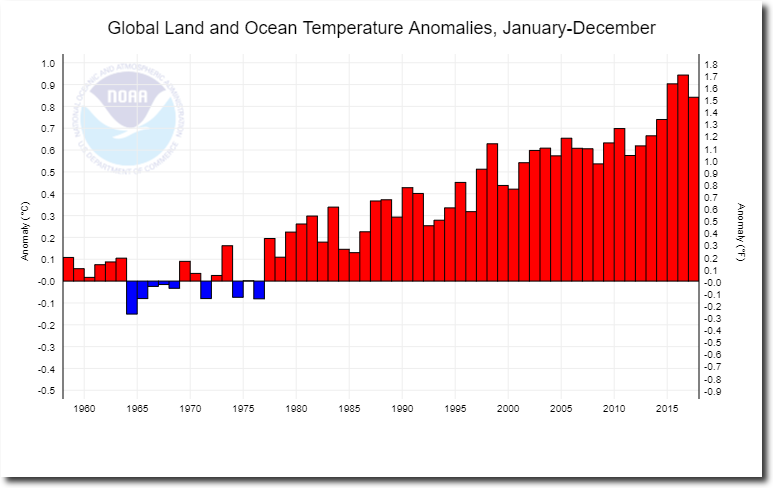
No warming from 1958-1995, and none since 1995. So there has been little or no warming for 60 years, which of course is reported by government agencies as the Earth burning up.
Climate at a Glance | National Centers for Environmental Information (NCEI)
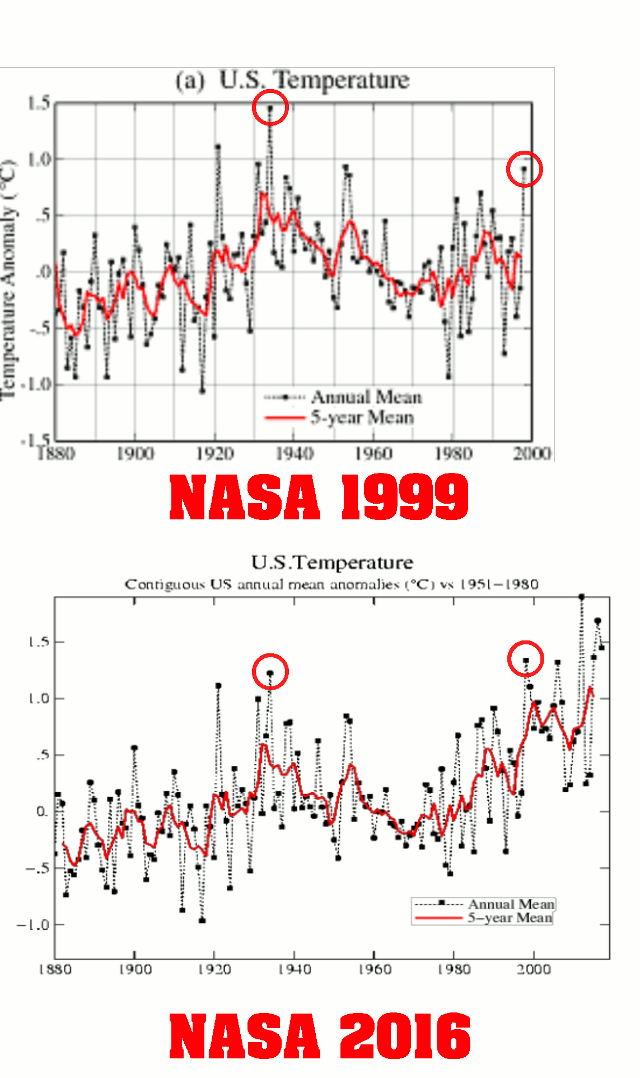
When data doesn’t fit the agenda, government scientists simply alter it.
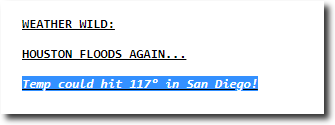
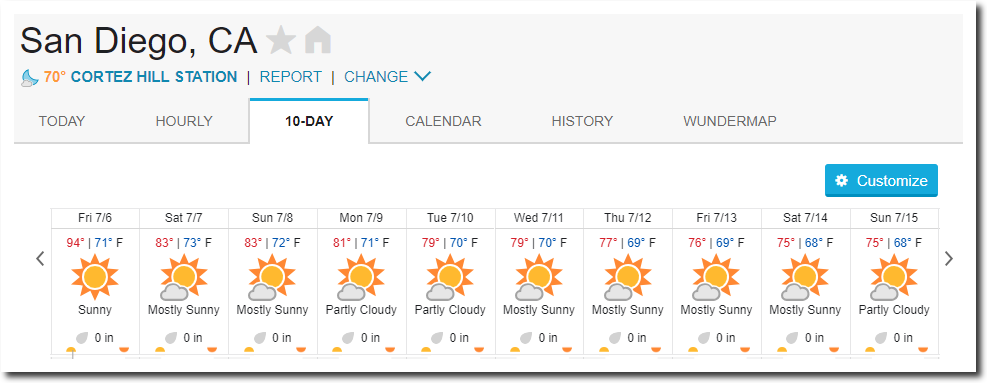
117 degrees in San Diego? Fake news doesn’t get much more incredulous than that. The actual forecast for San Diego is fairly typical for this time of year.
Meanwhile, here in the real world, July 6, 1936 was the hottest day on record in North Dakota – at 121 degrees.

These were the temperatures at Fort Yates, North Dakota from June 18- September 22, 1936.
100, 90, 90, 64, 90, 91, 110, 107, 97, 104, 97, 93, 93, 84, 93, 96, 104, 108, 119, 112, 109, 113, 114, 110, 106, 101, 98, 108, 118, 107, 109, 102, 91, 100, 99, 100, 101, 100, 100, 93, 91, 88, 95, 100, 108, 91, 82, 71, 84, 96, 98, 104, 96, 99, 84, 91, 91, 101, 99, 79, 91, 93, 79, 80, 88, 93, 88, 81, 80, 81, 77, 75, 80, 84, 96, 91, 89, 90, 93, 90, 73, 87, 60, 82, 87, 91, 87, 64, 75, 72, 80, 75, 81, 82, 84, 91, 101
Arctic sea ice volume is about to pass 2003 and move to third highest in the DMI record. This should happen on Saturday.
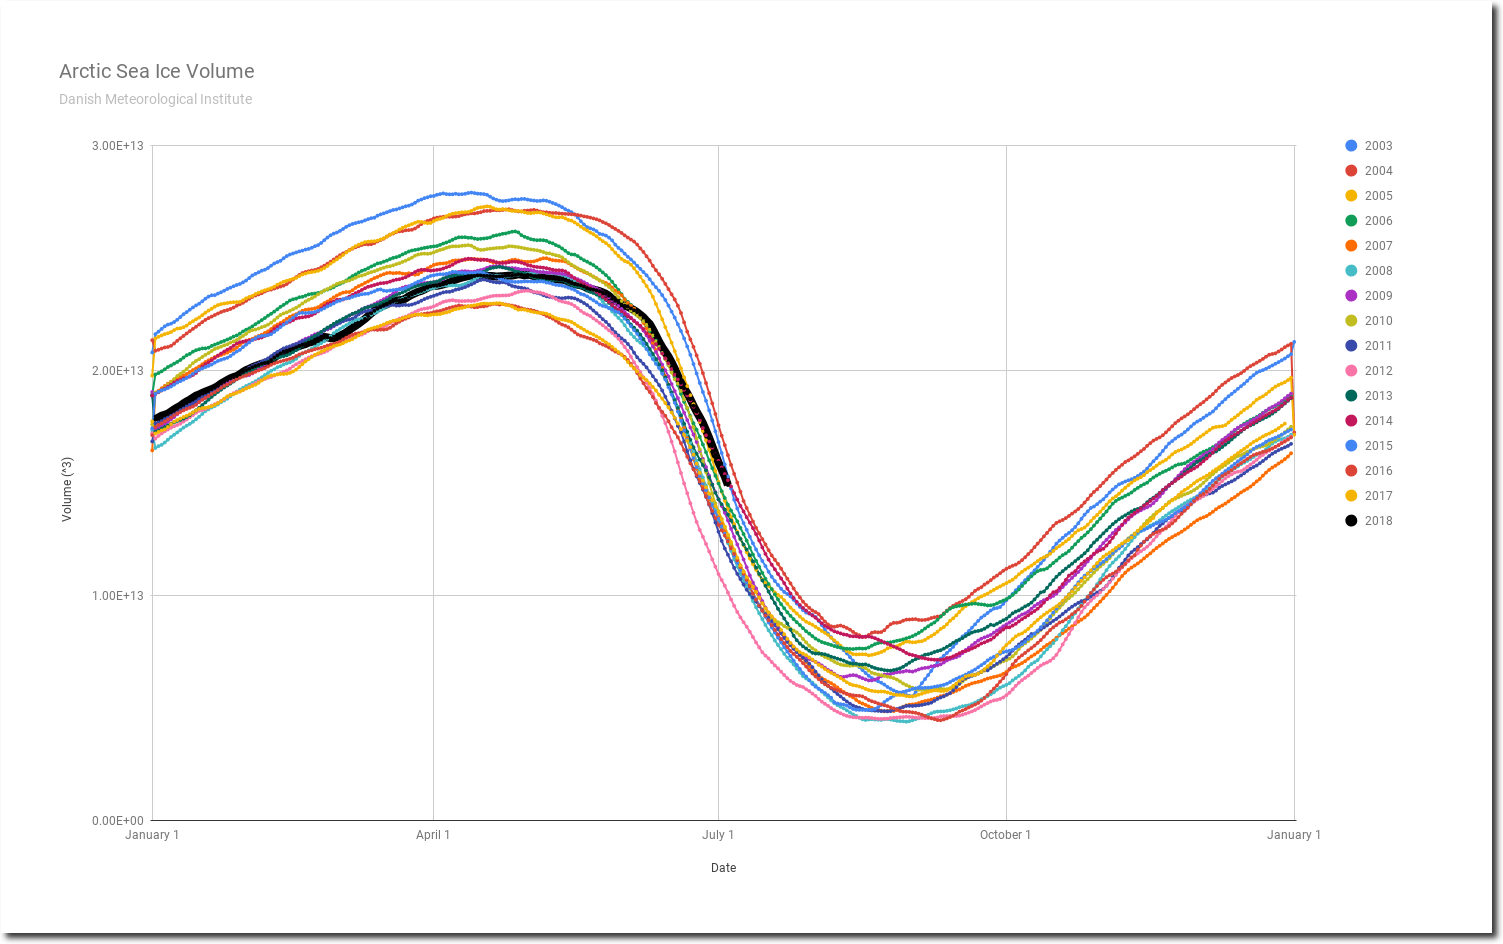
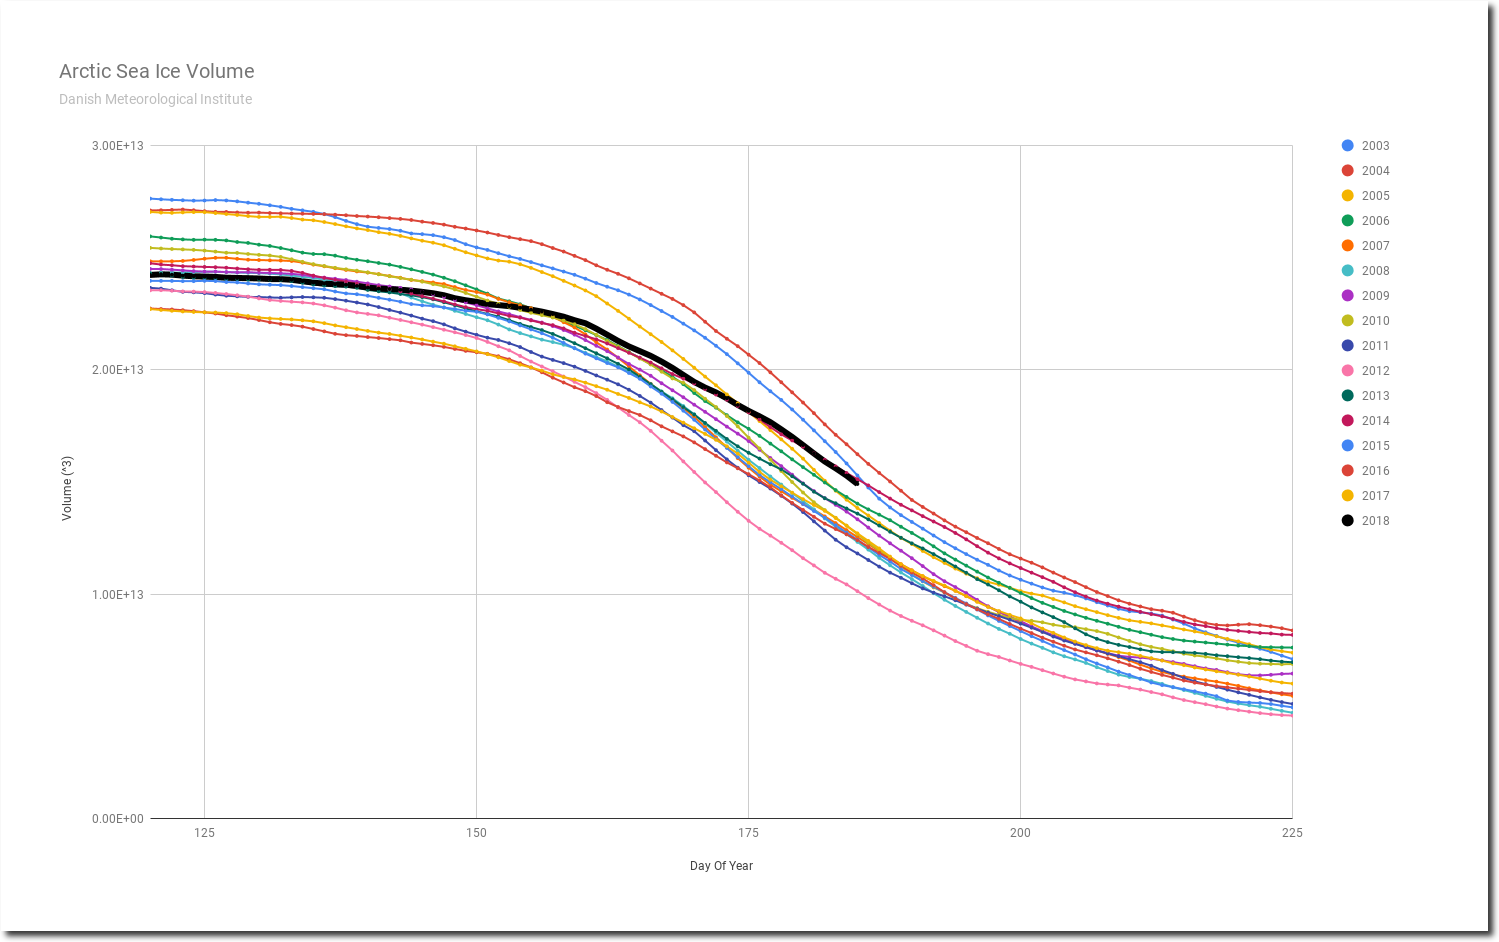
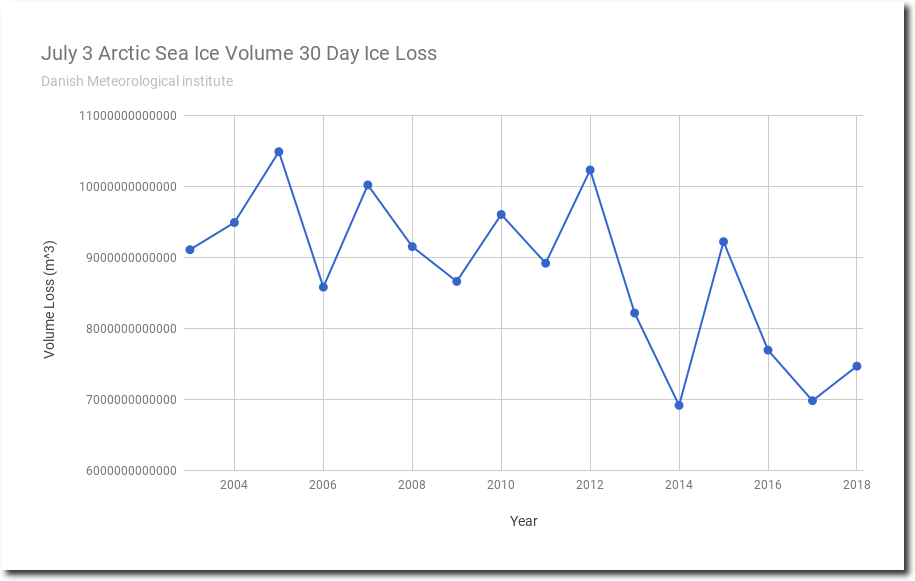
Yesterday was the peak melt day of the season so far. The only other year when the peak melt occurred in July was 2003. Normally it occurs in June.
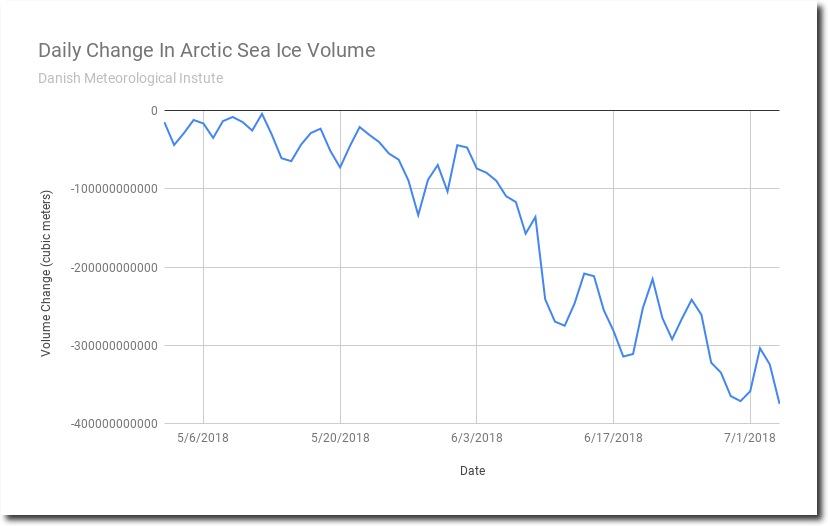
Peak melt rates have declined over the past 15 years, with this year being the fourth lowest on record (so far.)

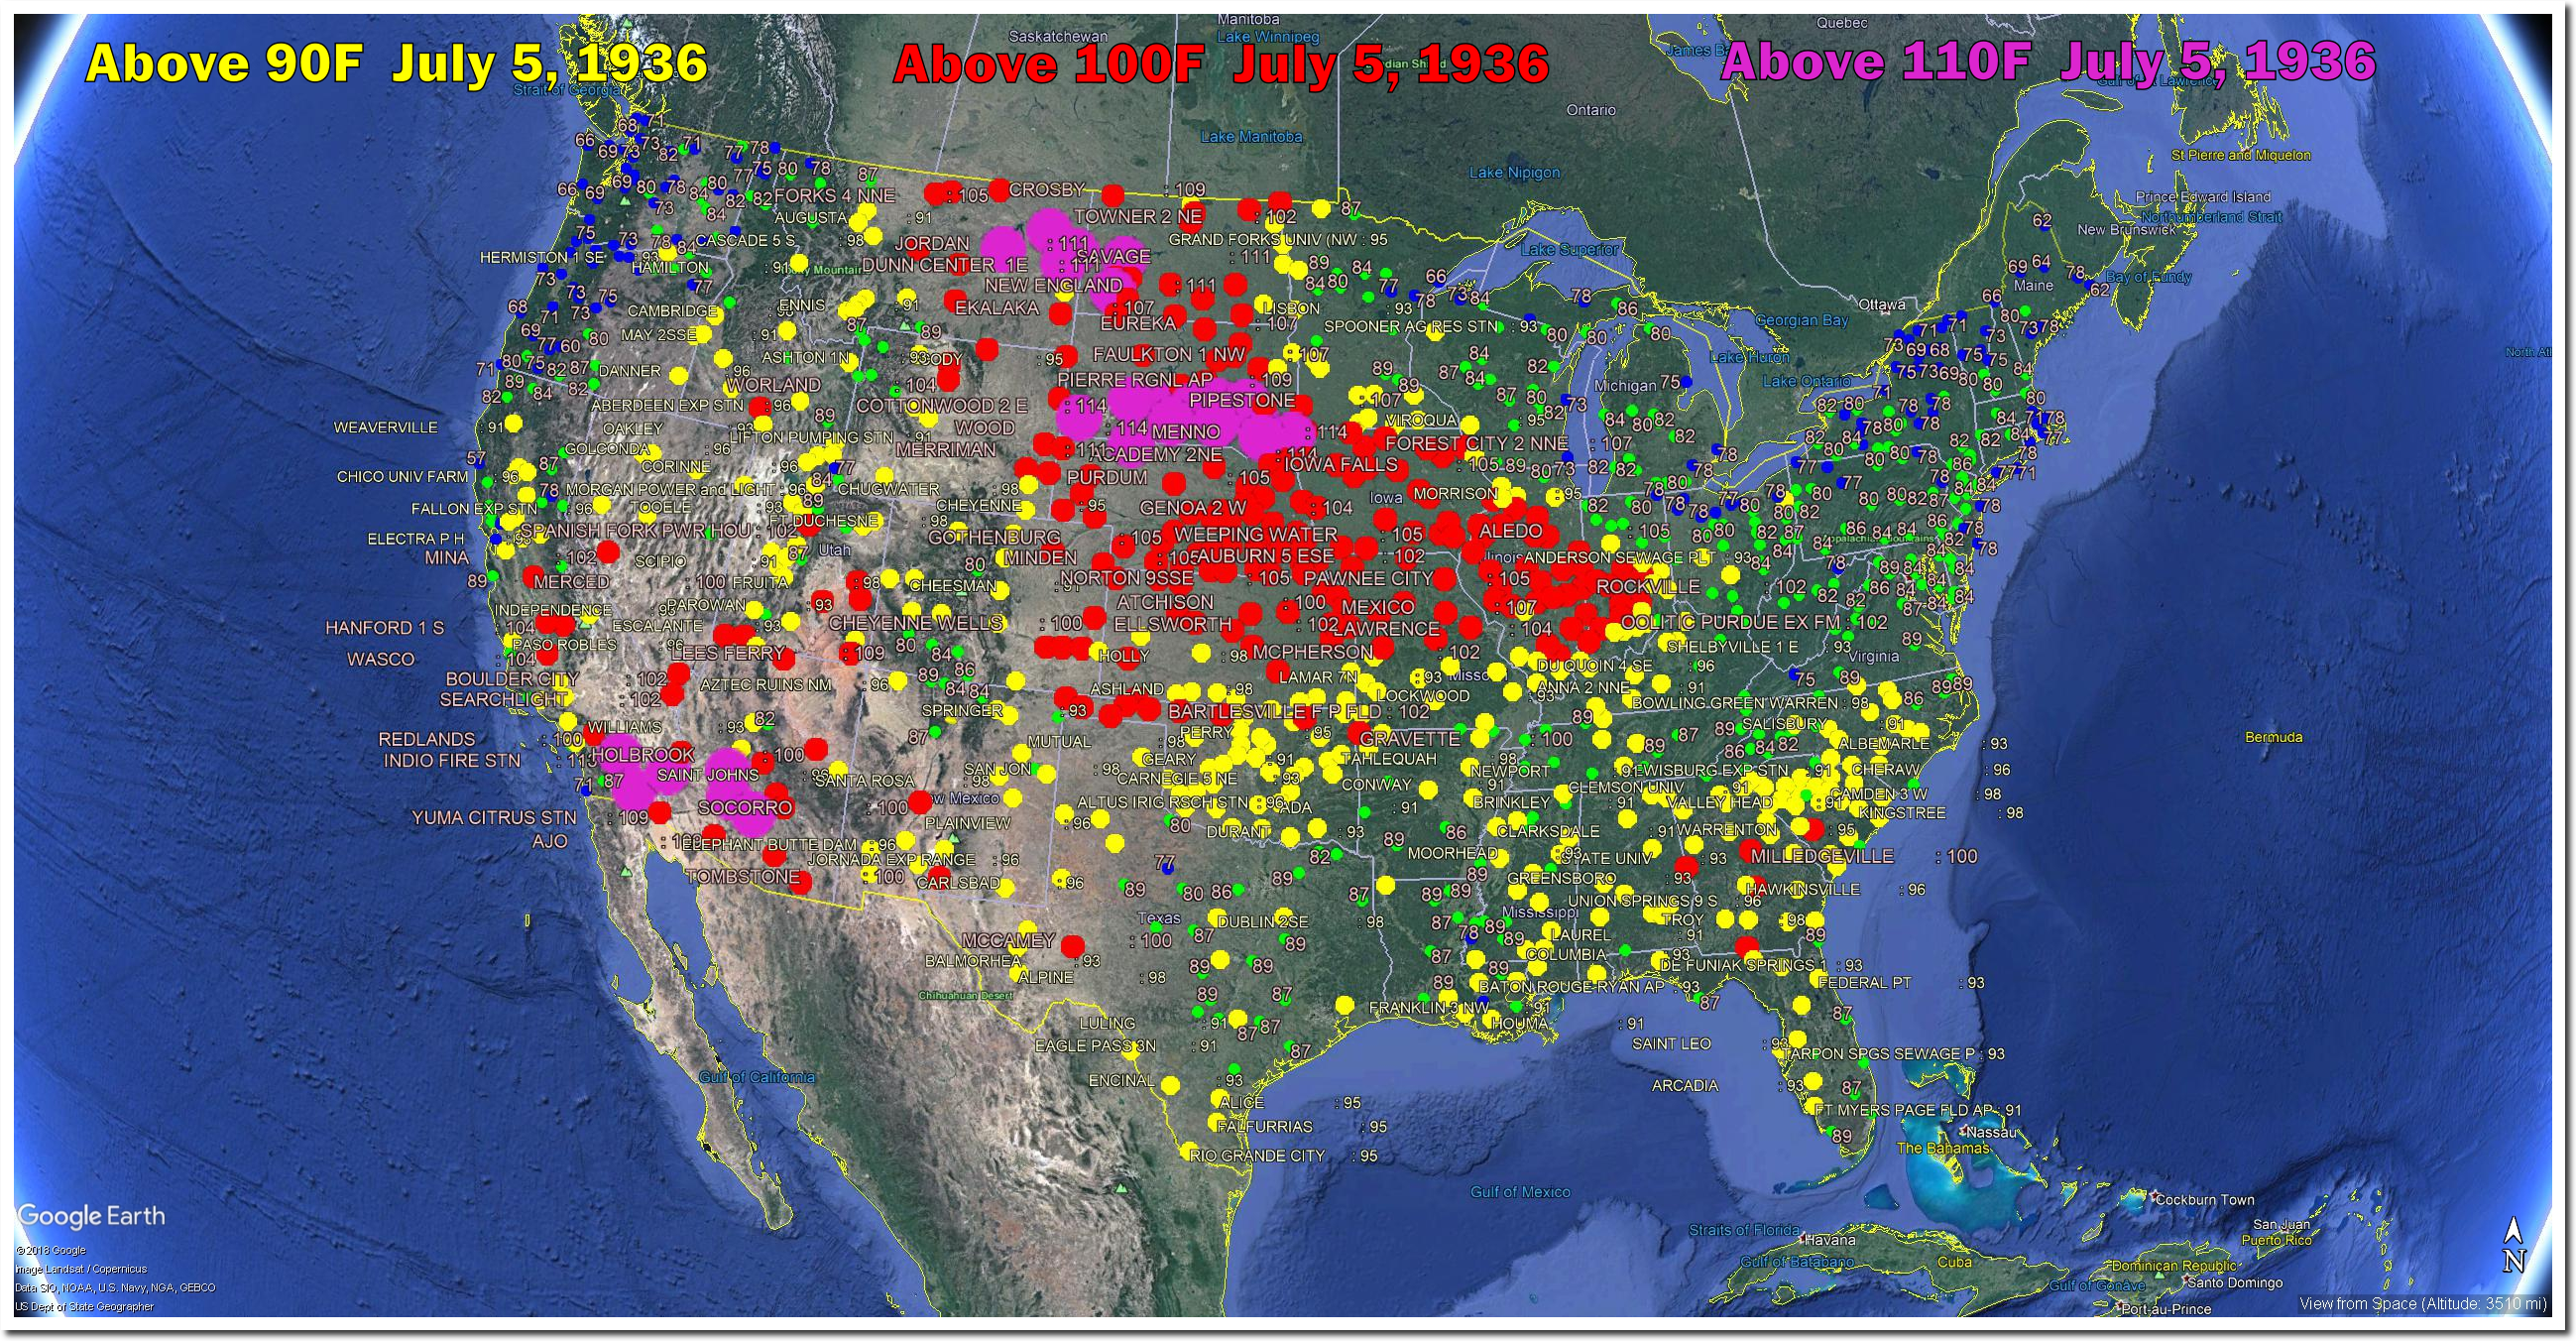
On this date in 1936, Gann Valley, South Dakota reached 120 degrees – the hottest temperature ever recorded in South Dakota.
The hottest July 5th occurred in 1911. with 100 degree temperatures into New England.
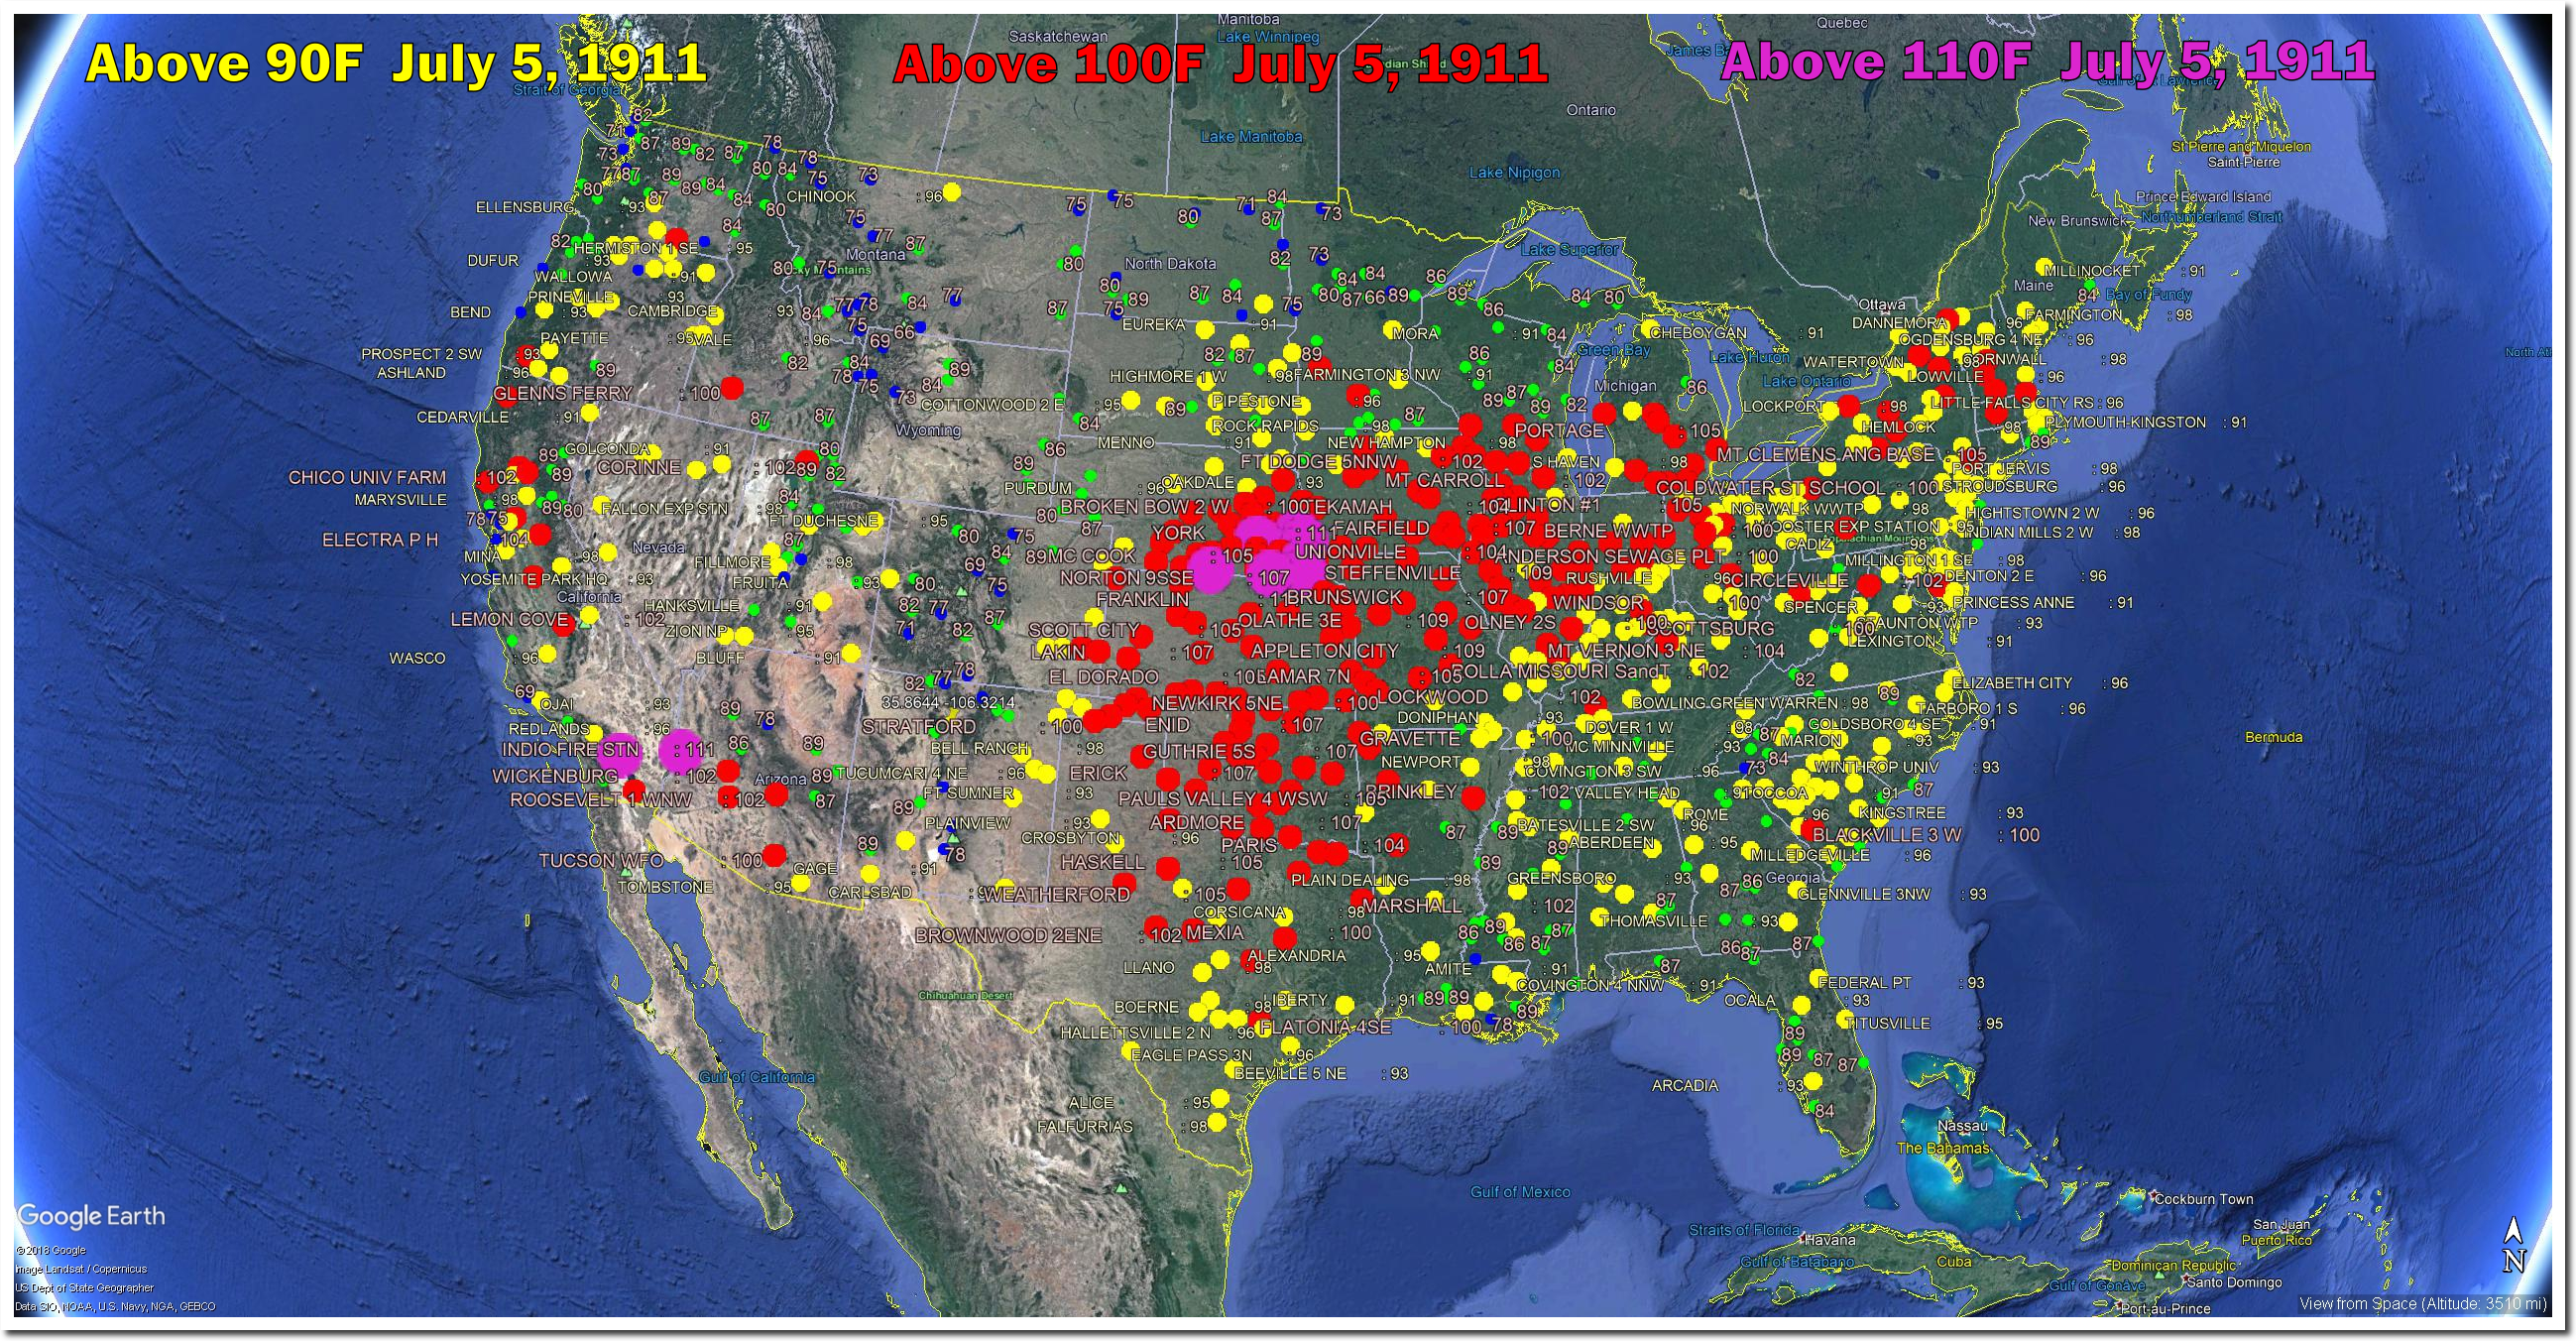
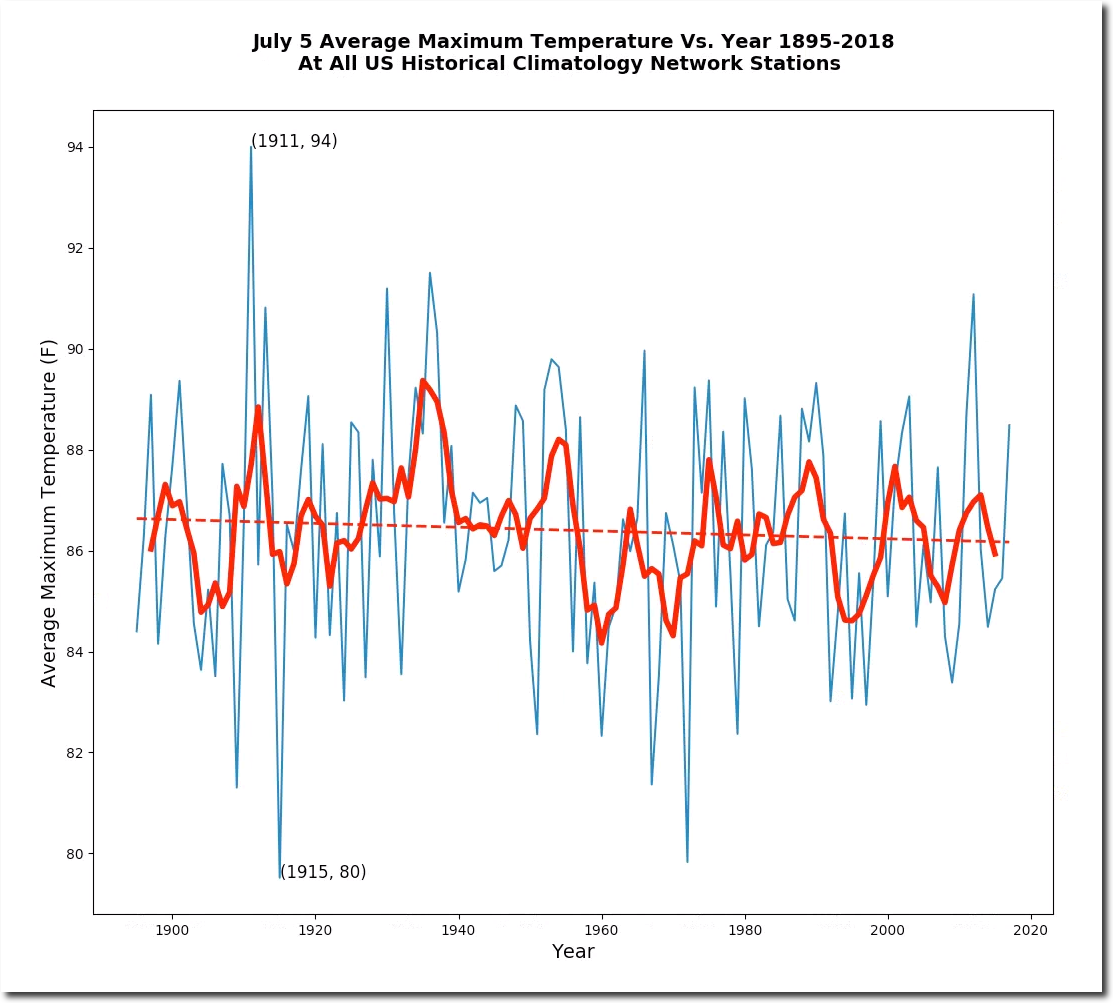
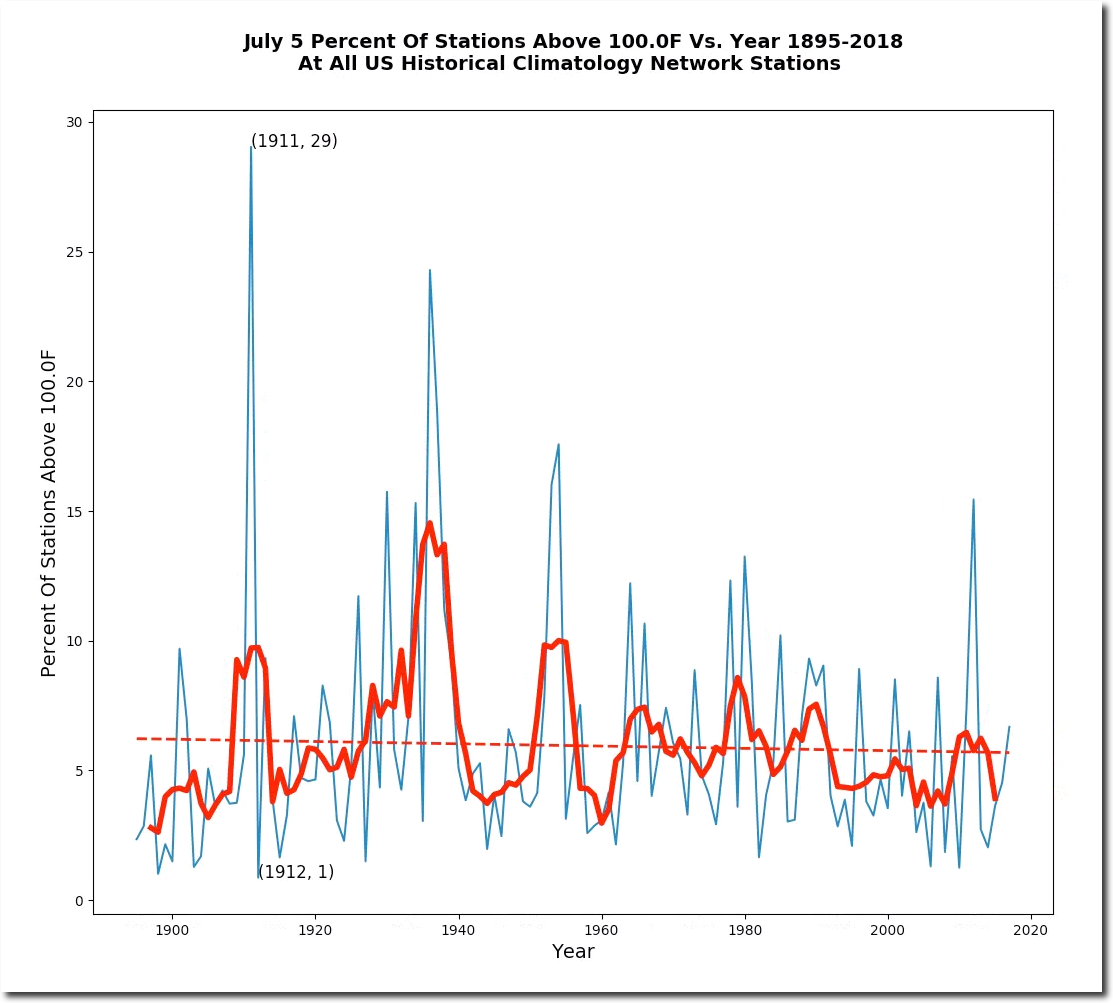
The 1911 heatwave lasted eleven days and killed thousands of New Englanders, many by suicide. It was the worst weather disaster in new England history.
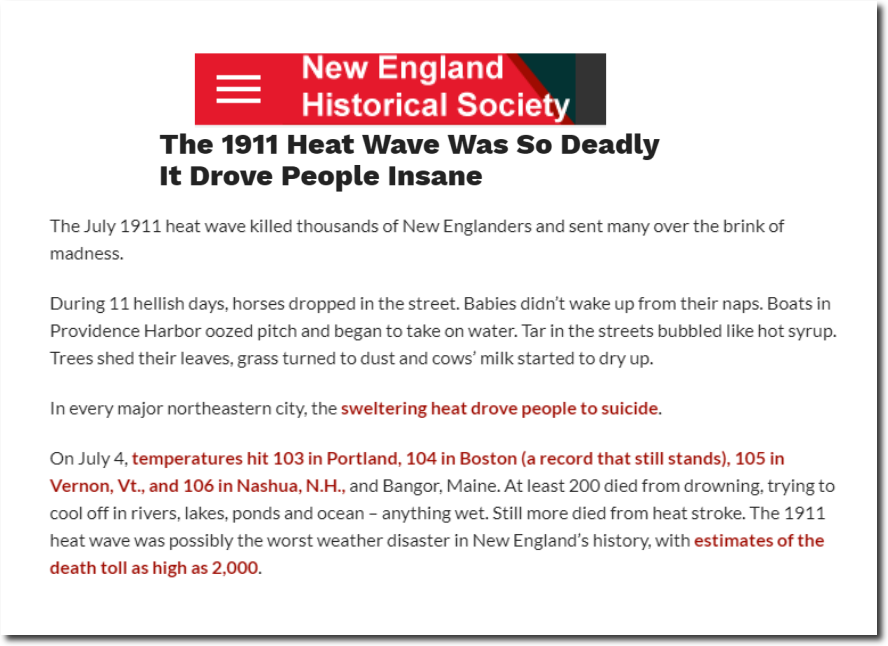
The 1911 Heat Wave Was So Deadly It Drove People Insane – New England Historical Society
Meanwhile, Drudge continues to pimp the “record heat” fake news.
One of the favorite lies of climate scientists is that snow cover is declining, and that it is having a “profound” effect on ecosystems.
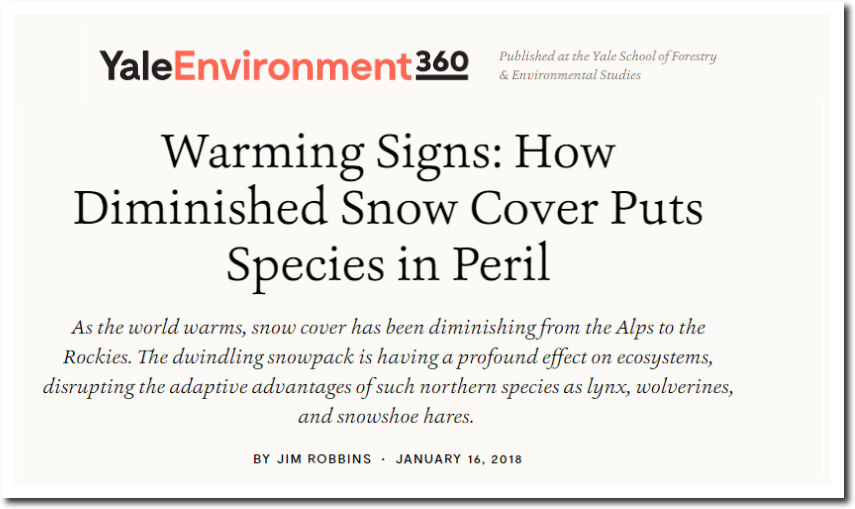
Warming Signs: How Diminished Snow Cover Puts Species in Peril – Yale E360
In fact, snow cover has increased sharply over the past 30 years, since CO2 reached 350 PPM. Northern Hemisphere snow cover has been above long-term mean for most of the last 25 years.

Rutgers University Climate Lab :: Global Snow Lab
Climate science is a “profoundly” fraudulent venture.
In order to hide past heat, Wikipedia pulls a couple of dirty tricks. They report the most recent year a record temperature was reached, instead of the first year. This skews the graph to favor recent UHI affected temperatures, and hides past heat.

U.S. state temperature extremes – Wikipedia
But the real dirty trick is using bogus temperatures. The official temperature at Pierre, South Dakota on July 15, 2006 was 116 degrees – four degrees cooler than the Wikipedia claimed temperature, and four degrees cooler than the actual South Dakota record heat of 120 degrees on July 5, 1936. There weren’t any USHCN stations in South Dakota close to 120 degrees on July 15, 2006, but there were two on July 5, 1936.
England’s front line watching the ball cross in front of the goal.

Brazil’s front line putting the ball in the goal.

Arctic sea ice volume is fourth highest for the date since 2003, and is about to pass 2003. There are only a few weeks left until the end of the melt season.
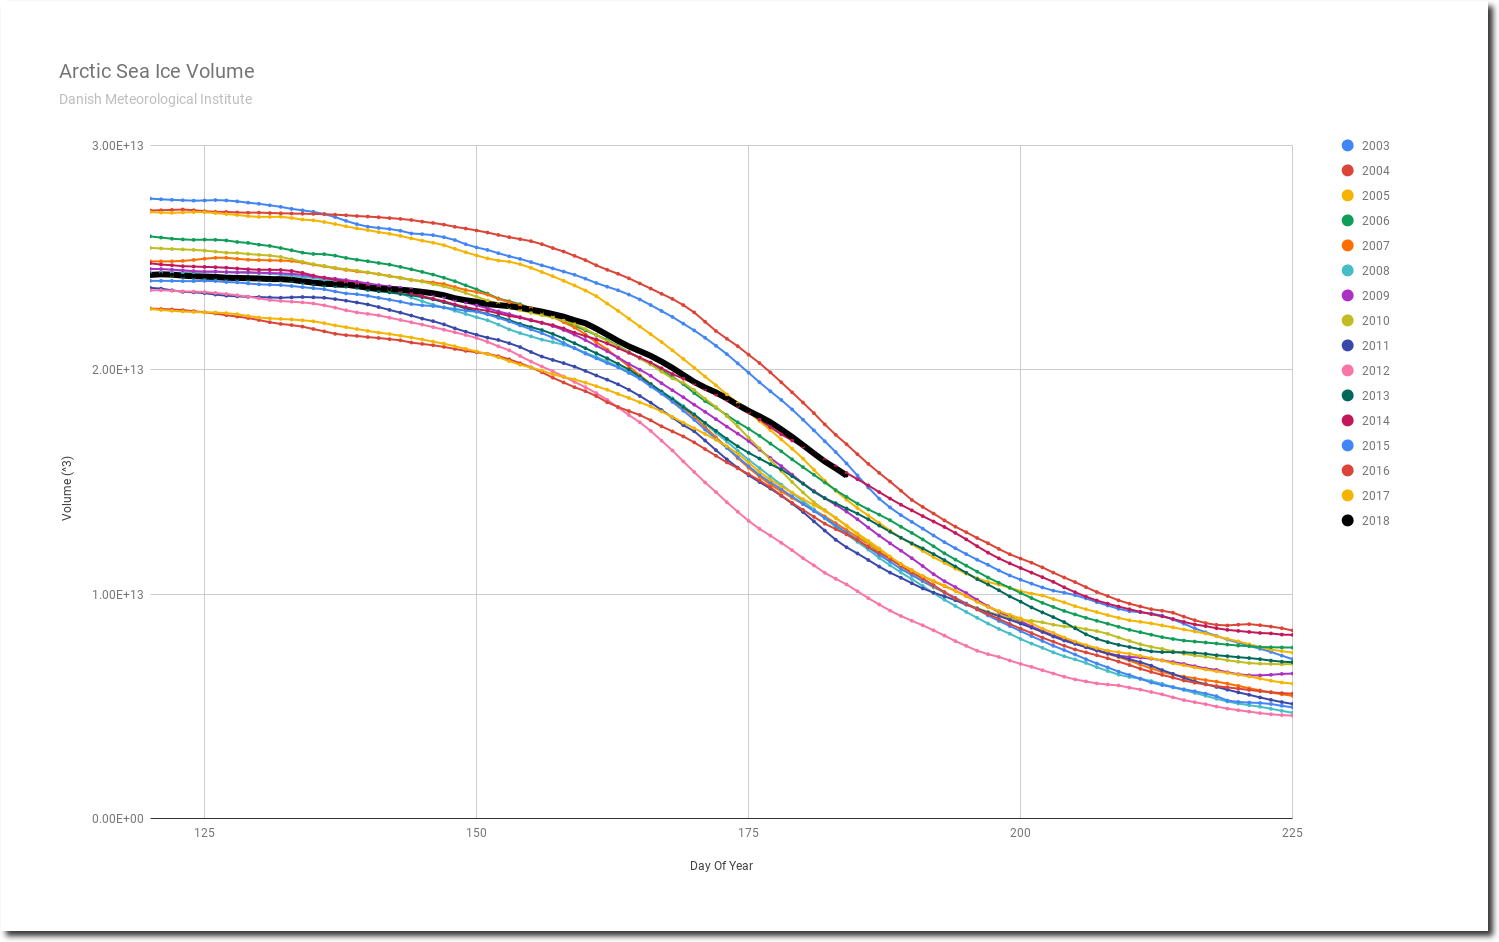
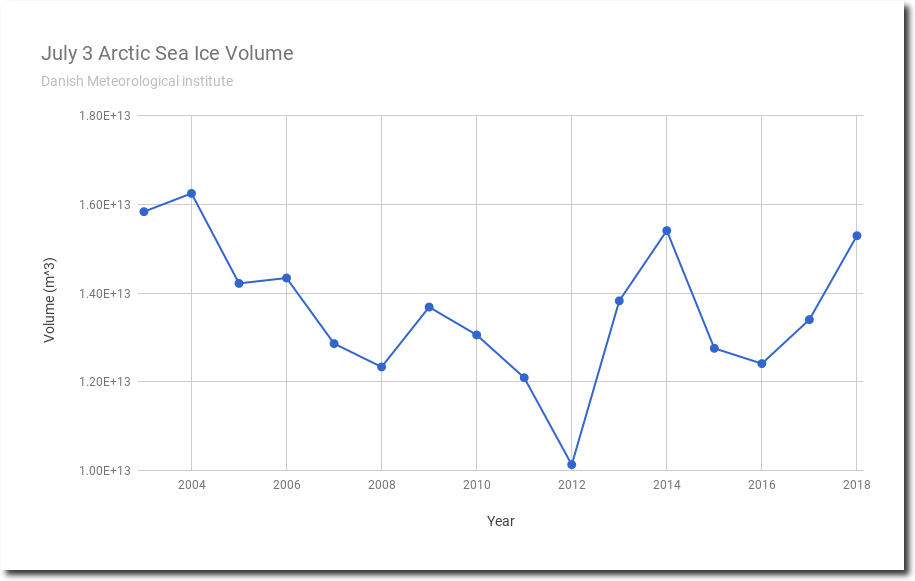
Melt rates have been very slow in recent years.
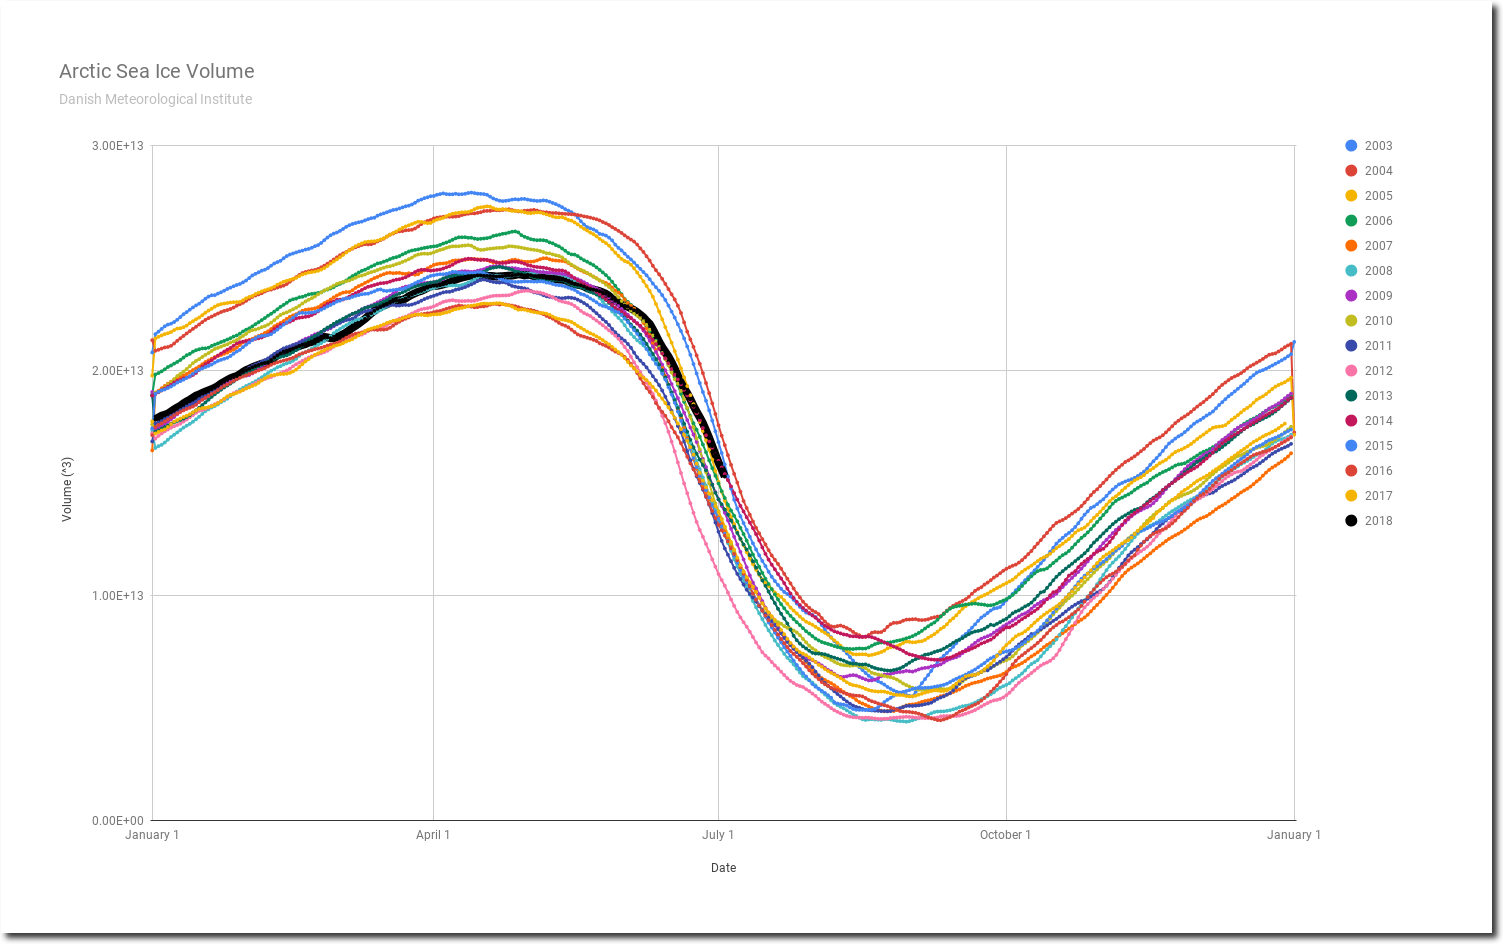
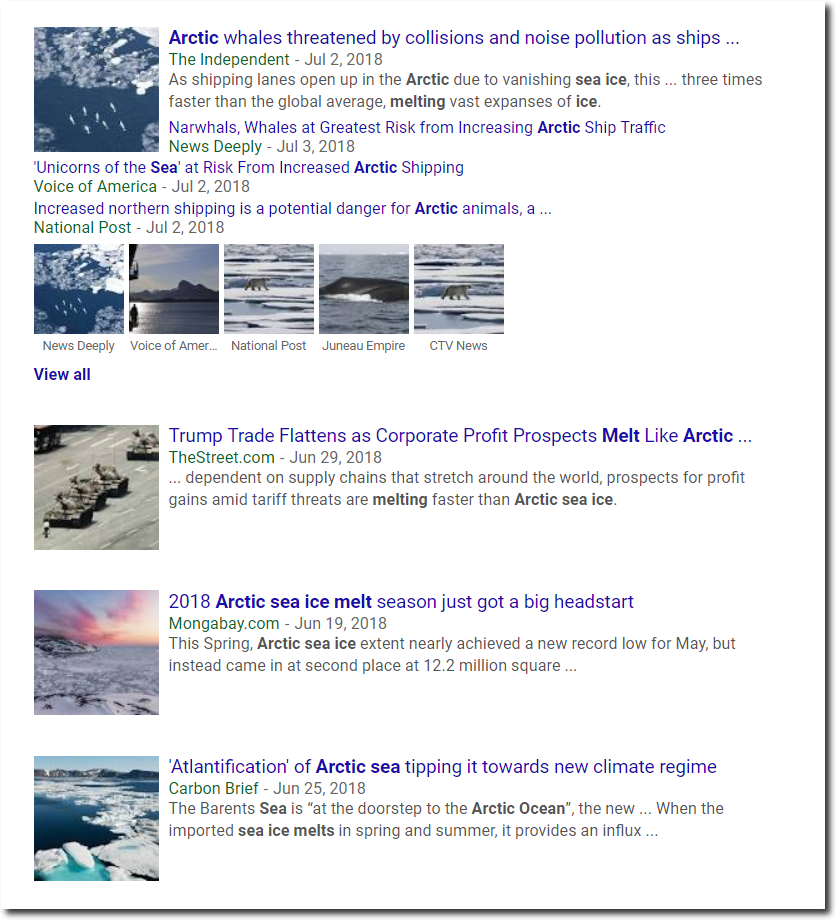
Meanwhile, the usual batch of criminals and liars in the press and scientific community report the exact opposite.
Republicans believe every day is the Fourth of July, but the Democrats believe every day is April 15.
- Ronald Reagan
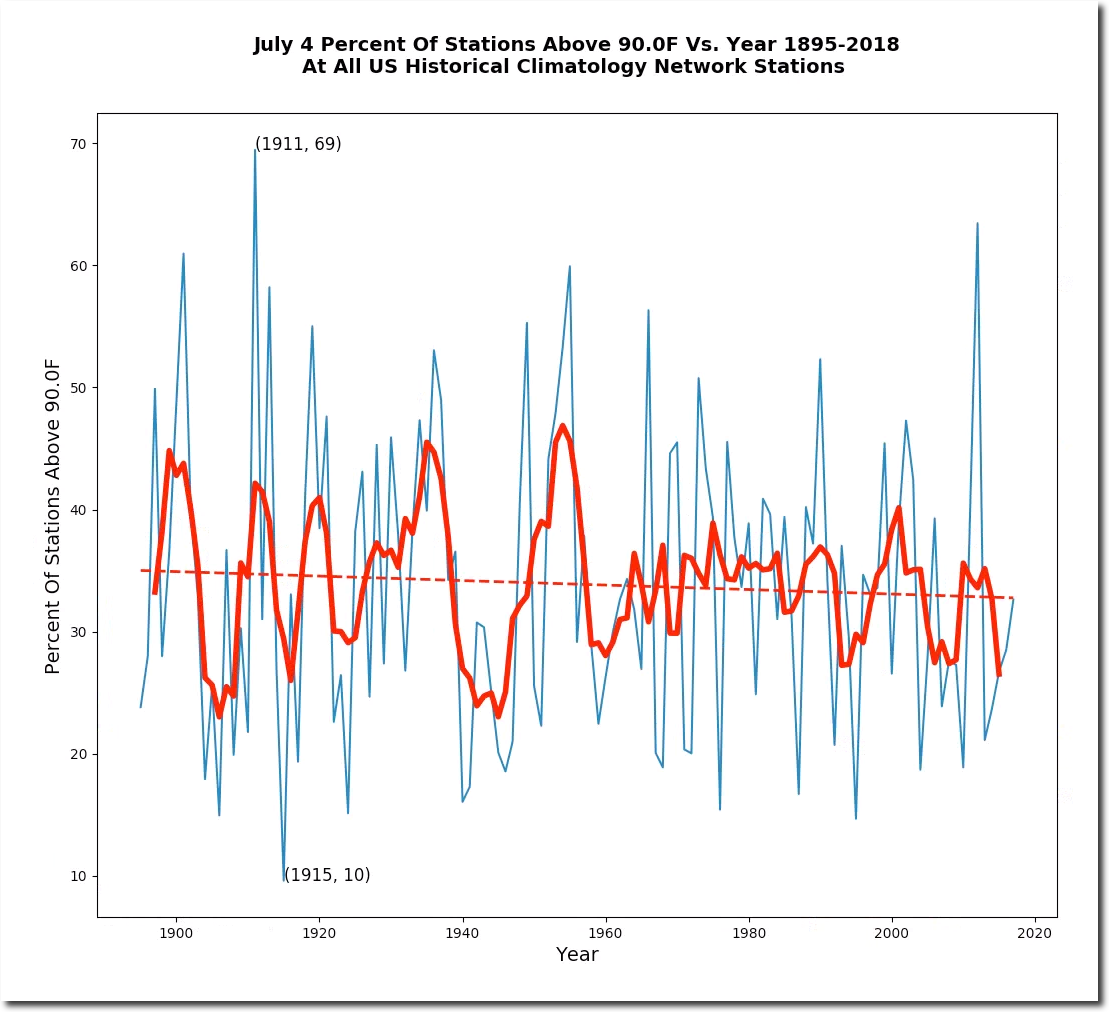
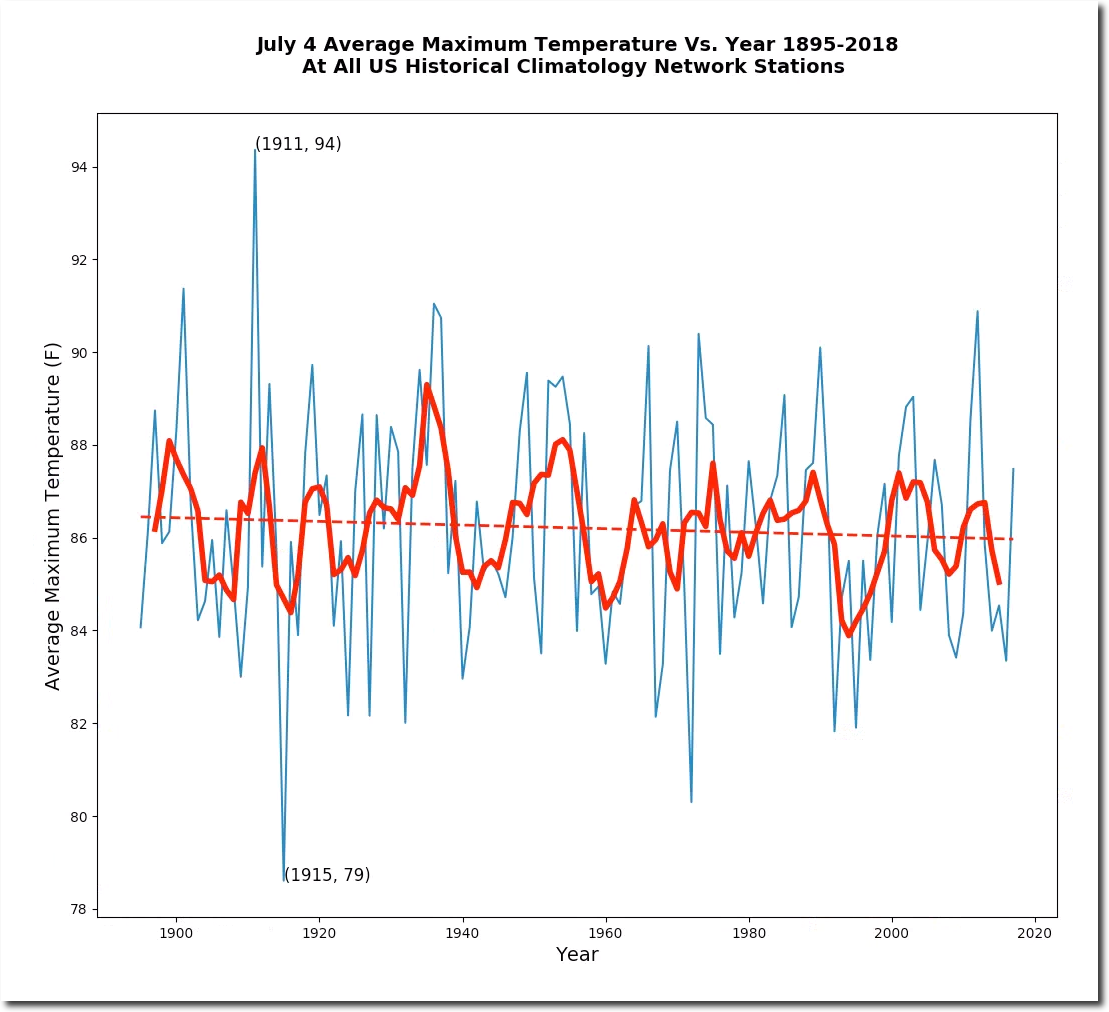
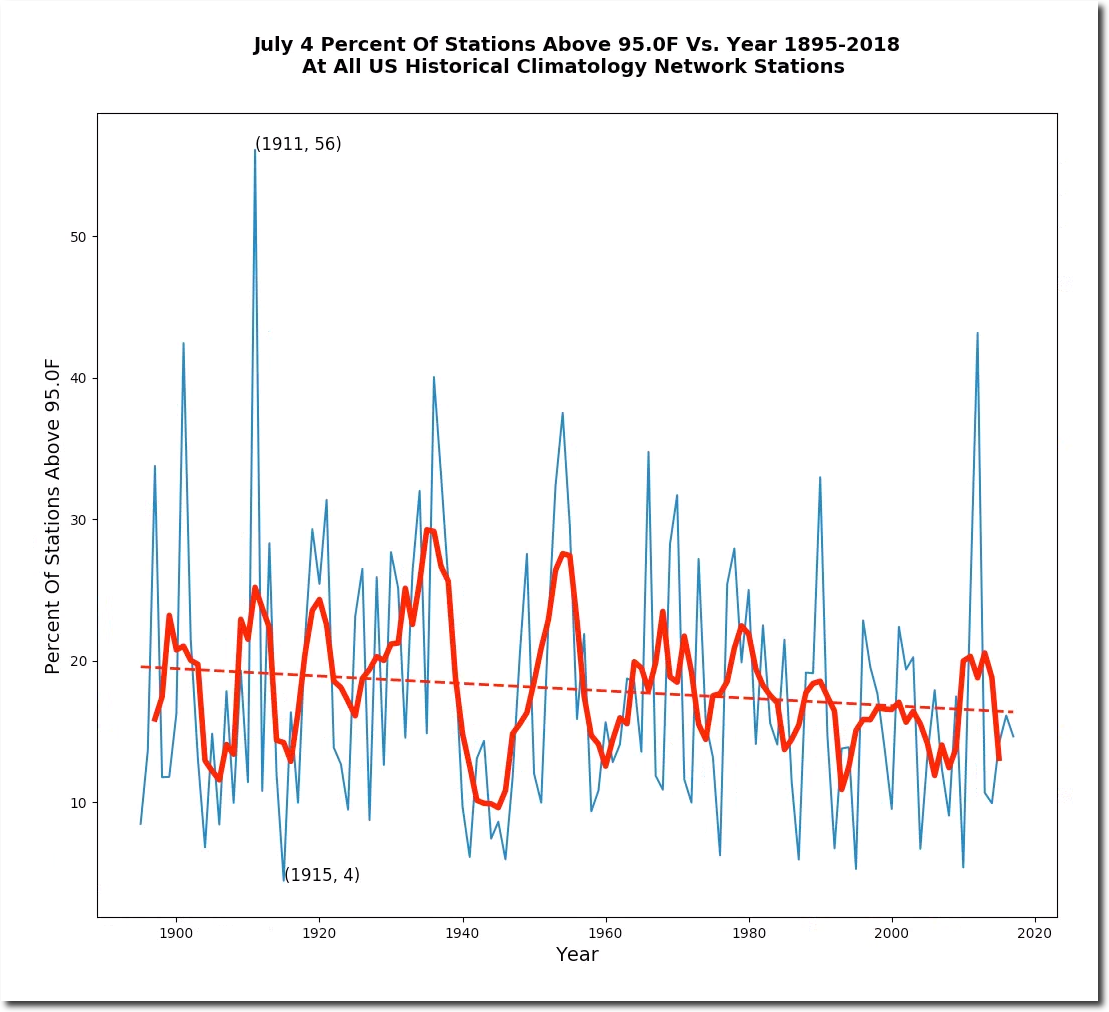
July 4th afternoon temperatures have been declining in the US since the 19th century. The hottest July 4th occurred in 1911, and the coolest occurred in 1915, back when James Hansen said the climate was stable.
On July 4th, 1911 there were 100 degree temperatures from California to Maine.

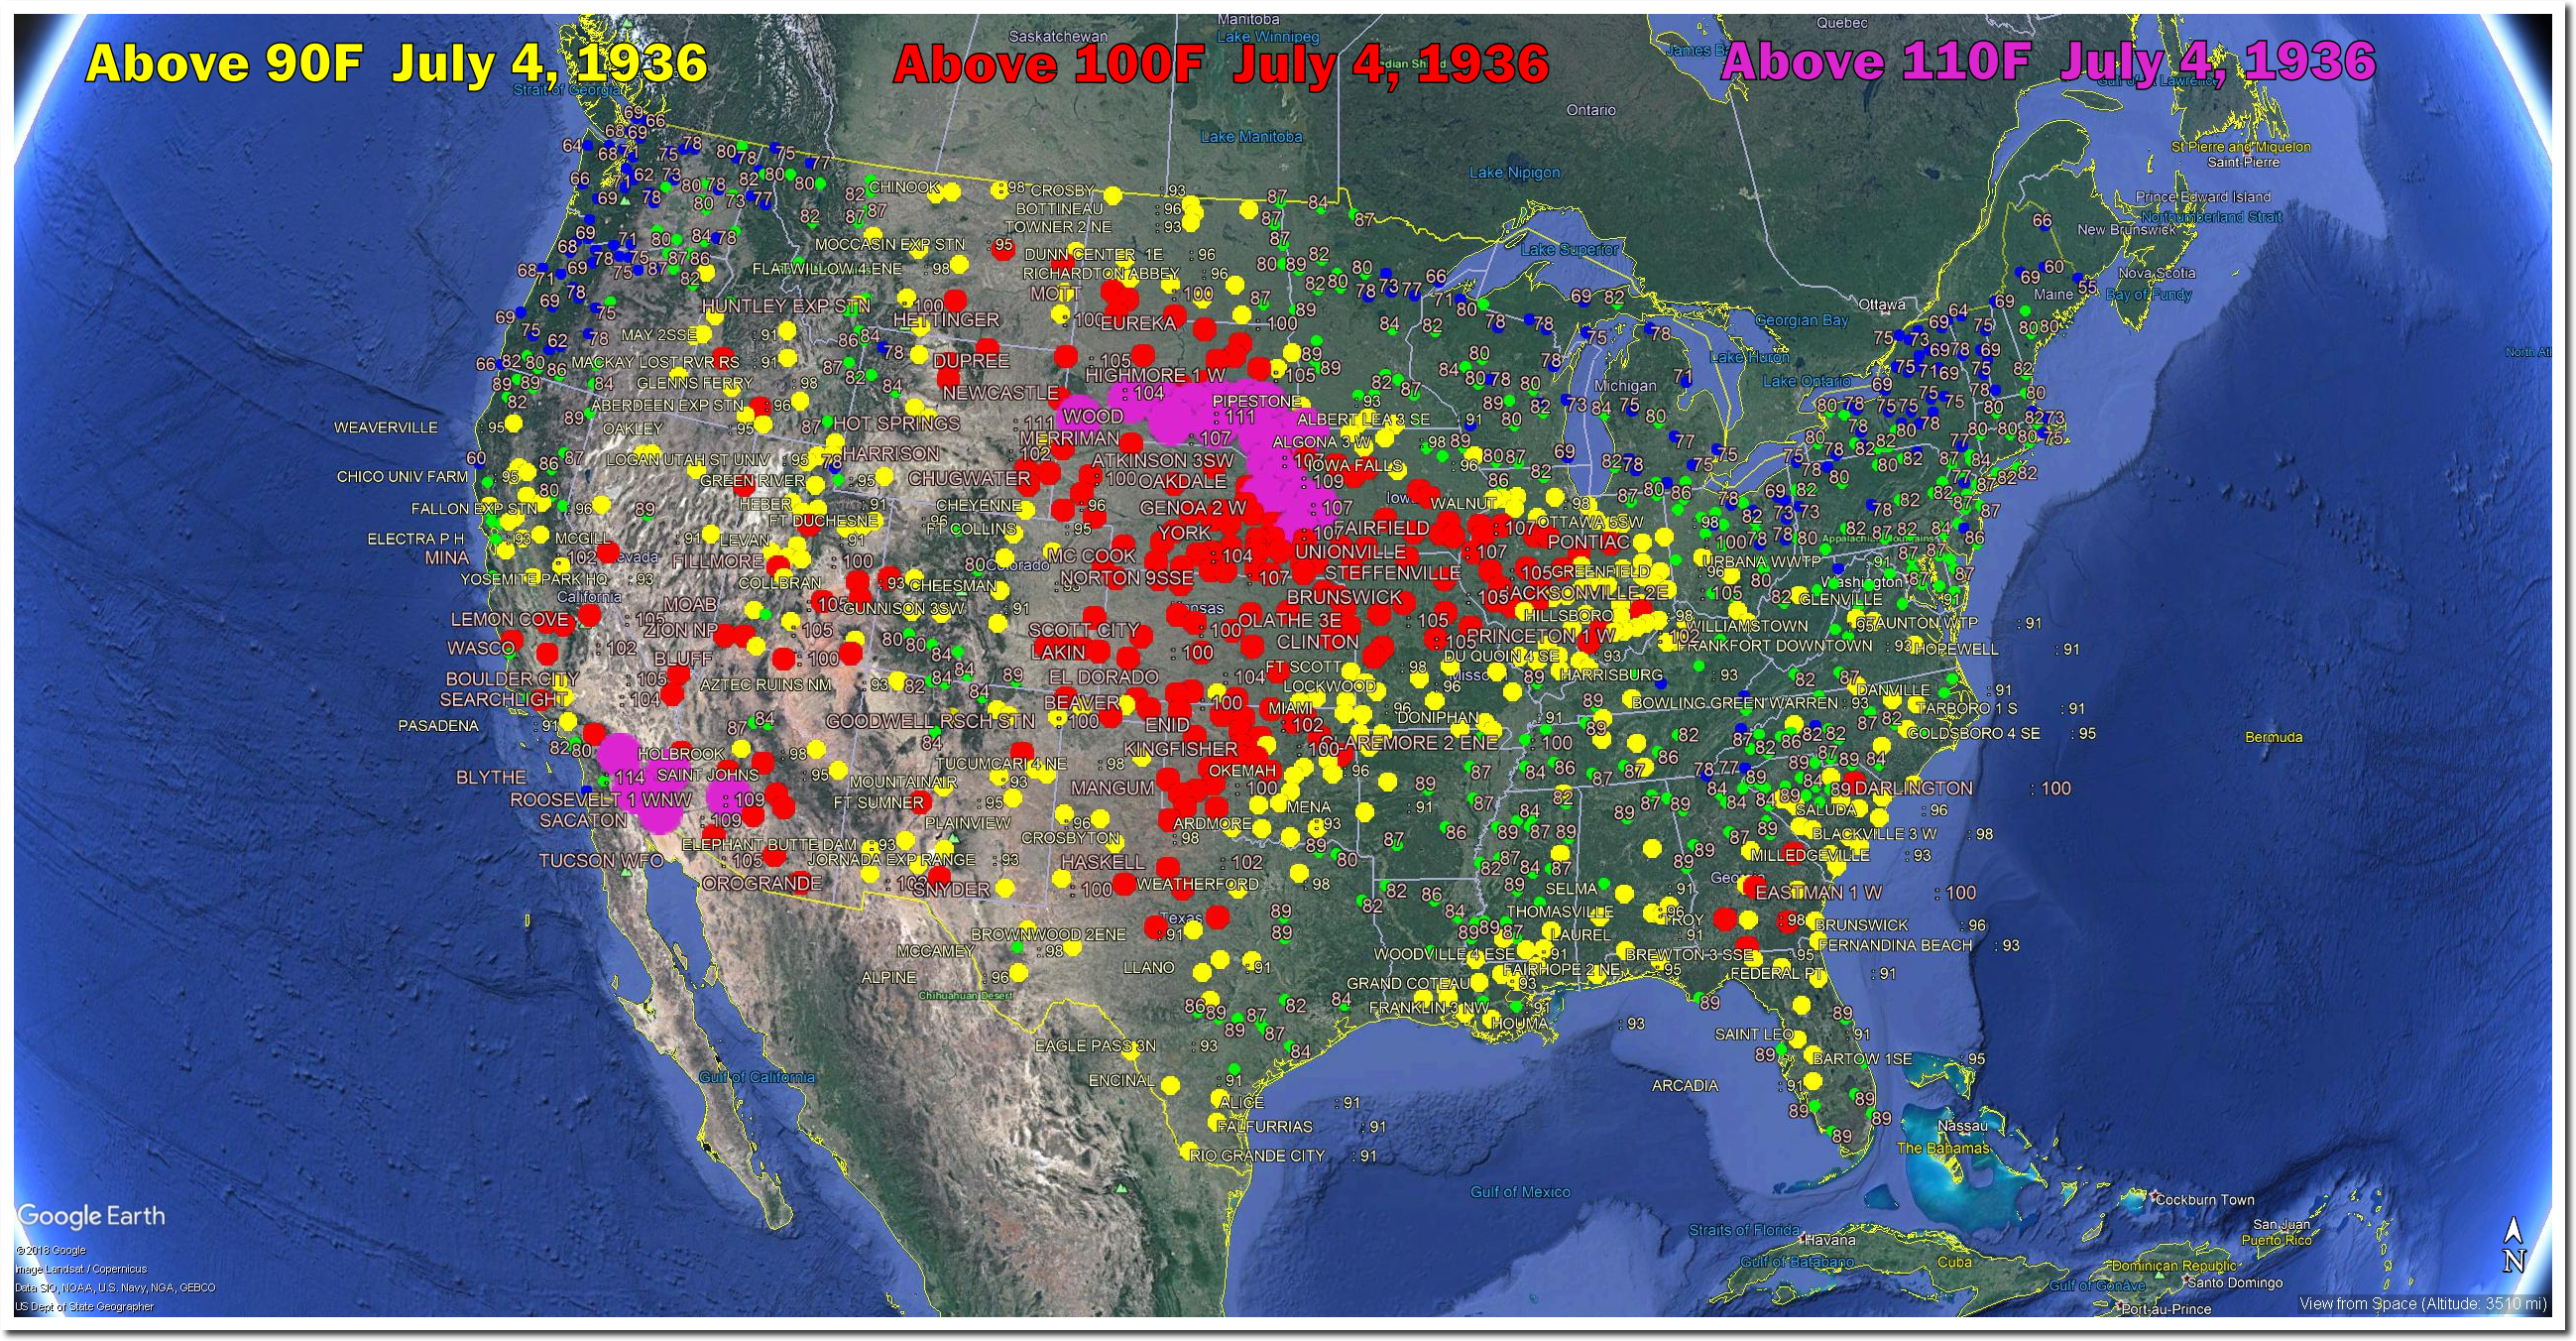
On July 4th, 1936 the heat wasn’t as widespread, but there was a large area of 110 degree temperatures in the Great Plains.