
 Bill Gray tells me that the current El Nino is the largest since 1998. I was in Northern California during the 1997-1998 El Nino, and it almost never stopped raining. Huge amounts of snow fell in the mountains. A repeat would end the drought, and cause climate experts to talk endlessly about the unprecedented spike in temperatures – caused by global warming.
Disrupting the Borg is expensive and time consuming!

Google Search
-
Recent Posts
- 45 Years Ago Today
- Solution To Denver Homelessness
- Crime In Colorado
- Everything Looks Like A Nail
- The End Of NetZero
- UK Officially Sucks
- Crime In Washington DC
- Apparently People Like Warm Weather
- 100% Wind By 2030
- It Is A Nice Idea, But ….
- Climate Grifting Shutting Down
- Fundamental Pillars Of Democracy
- An Inconvenient Truth
- Antarctic Meltdown Update
- “Trump eyes major cuts to NOAA research”
- Data Made Simple II – Sneak Preview
- Attacks On Democracy
- Scientists Warn
- Upping The Ante
- Our New Leadership
- Grok Defines Fake News
- Arctic Meltdown Update
- The Savior Of Humanity
- President Trump Explains The Stock Market
- Net Zero In Europe
Recent Comments
- conrad ziefle on 45 Years Ago Today
- Disillusioned on UK Officially Sucks
- Disillusioned on 45 Years Ago Today
- Bob G on 45 Years Ago Today
- Independent on 45 Years Ago Today
- dearieme on 45 Years Ago Today
- Crispin Pemberton-Pigott on 45 Years Ago Today
- arn on 45 Years Ago Today
- Solar Mutant Ninjaneer on 45 Years Ago Today
- arn on 45 Years Ago Today
Reblogged this on The Grey Enigma.
NINO index # 5 (5=3.4) from CPC, interpolated from weekly to daily values, SSTa [Celsius].
http://climexp.knmi.nl/data/inino5_daily.png
The temperature of the eastern Pacific.
http://www.opc.ncep.noaa.gov/Loops/GRTOFS/sst/GRtofs_sst_Wcst_03_Day_flash.shtml
http://earth.nullschool.net/#current/wind/surface/level/overlay=temp/orthographic=-109.42,2.10,454
I don’t see any El Nino, yet.
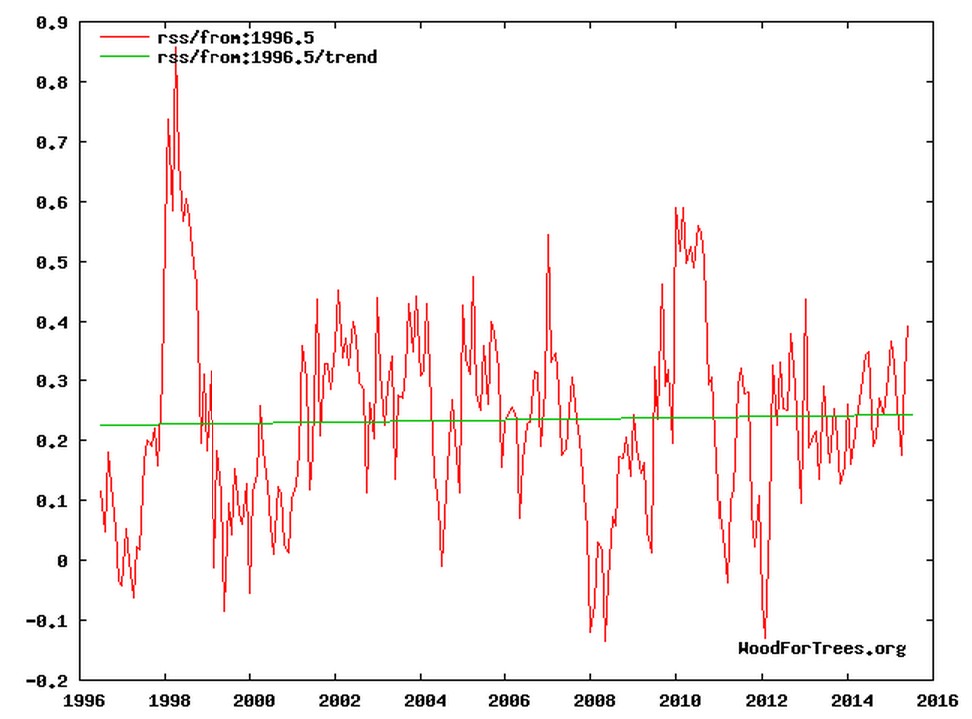
http://woodfortrees.org/graph/rss/from:2001/to:2016/trend/plot/rss/from:2001/to:2016
OFFICIAL Forecasts
Jul-Aug-Sep 2015
http://www.cpc.ncep.noaa.gov/products/predictions/long_range/lead01/off01_temp.gif
Circulation inhibits the Central Pacific and has no effect on the weather in North America. Due to the meridional Jetstream El Niño will fall to winter.
http://earth.nullschool.net/#current/wind/isobaric/850hPa/orthographic=-109.42,2.10,454
https://www.longpaddock.qld.gov.au/seasonalclimateoutlook/southernoscillationindex/30daysoivalues/
The Blowtorch must be working overtime in the Arctic, with every day showing big heat (82 degrees today)…
http://www.lawrencevilleweather.com/wx.php?forecast=pass&pass=intlcondmaps&hwvRegion=nam&hwvMap=temperature&hwvunits=english
On land it gets that hot, I was in Inuvik and Tuktoyaktuk in 2009 for the summer and it was regularly in the 80’s.
At sea,…Not so much.
Yes but how often does that happen during the year? A few days of 80-degree weather isn’t climate.
I’m getting really tired of normal temperatures being painted RED on every F’ing Weather Map these days… even in the Winter..
Who is Bill Gray and is he important?
Bill is a somewhat aged and revered meteorologist, considered by many to be the pinnacle in the area of weather and particularly hurricane forecasting. Read more..
https://stevengoddard.wordpress.com/2014/09/16/guest-post-from-dr-bill-gray/
Meanwhile Arctic ice is now above 2009 for this day.
https://sunshinehours.files.wordpress.com/2015/07/arctic_sea_ice_extent_zoomed_2015_day_185_1981-2010.png
As TH notes, even though we seem to have a strong El Nino,(according to Bill Gray, Bob Tisdale, and several others) ……
……where is the usual temperature spike ?
Is Jim on vacation or just unable to share any bad news?
Assume so. Apparently there are worse statistics than DMI’s, and you can choose between different extent per cents, volume (measured and modelled) and area, and of course you can start talking about individual parts of Arctic You can also choose your start year or choose to follow all year or maxs or mins.
Jim is waiting for that one speck of News which Supports his View…
He doesn’t give a shit about the TruTH… the Arctic is Melting in his mind.. disaster up there no matter what the facts and evidence shows..
CO2 trace gas perspective thought experiment:
Co2 is about 400 ppm or about 1 part in 2,500 parts.
Imagine if it were a fluid like water.
That would be 1 cup of water to 2,500 cups, or 156.25 gallons of water.
Sitting in the sun, suppose that this 1 cup of magic “carbon” water is able to gain 10 degrees in temperature above the 156.25 gallons of “plain” water due to its peculiar nature.
Now we mix all the waters together and find that the combined temperature has increased the 156.25+ gallons by .004 of a degree.
If we calculate the effect of the additional “dangerous” 50ppm above the “safe” 350ppm, it comes to an astounding .0005 (5 ten thousandths) of one degree as additional heat caused by “man’s use of fossil fuels”.
These increases in these representations are profoundly insignificant.
CO2’s magic ability to dramatically raise earth’s temperature does not pass the “smell” test in my book. Imagine 1 warm person in a crowd of 2,500 freezing people, being able to warm them all up significantly. It’s not plausible, even less plausible, 1 person in 20,000 (representing 50ppm out of 400ppm). Claiming that man-made CO2 is the driver of a global warming is just “a cold con-fusion” imposed on the public around the globe.
“Safe” level is around 350ppm? Maybe correct….
Anything much BELOW that puts the Earth in danger of running out of CO2 for food production. !!
Better thought experiment. CO2 is 400 ppm at sea level, and H2O is typically 10,000 to 40,000 ppm at sea level. And H2O is a much stronger absorber of IR.
So, we have maybe 20,000 heat absorbing molecules per million. Add CO2 and we get:
20,300 before humans
20,400 after humans
es macht nichts
I am eager to see how his prediction plays out. Based on my belief that solar insolation is a more powerful heater of tropical waters, and that it is now declining, I would have bet that our next big El Nino would be slightly less than the 2010 spike.
Talking with ornithologist in Chile, based on the biological response, they thought the warm waters of El Nino hit last year. That led to my speculation that we are experiencing a long, drawn-out El Nino, that will not spike temperatures unusually high.
I agree. Solar activity systematically declining.
http://www.woodfortrees.org/plot/sidc-ssn/from:2008
PDO is in the growth phase.
http://www.woodfortrees.org/plot/jisao-pdo/from:2011/trend/plot/jisao-pdo/from:2011
From about July 15 to cool the Northeast US.
http://www.cpc.ncep.noaa.gov/products/stratosphere/strat_a_f/gif_files/gfs_z100_nh_f216.gif
It is already cool in the Northeast. We have had nonstop rain/fog/barely warm temperatures. I don’t open windows at night at all! 4th of July: rain all day, high of 65 F.
It is unbelievably green right now. Weeds growing like crazy. My trees in the forest love it.
Look at the forecast jetstream.
http://earth.nullschool.net/#current/wind/isobaric/250hPa/orthographic=-109.81,55.09,688
It was hot here in mid NC for a couple of weeks (90F to 100F if you believe Jeff Masters) however my white clover says the weather is just fine and is growing and blooming like crazy. This is the third summer I have had this:
http://www.uaex.edu/farm-ranch/images/forages_plantid/legumes/white_clover1_jpg.jpg
instead of crispy critters.
My soil when I started in 1994 was 98% pure mineral clay yet my clover has persisted for 20 years.
(Stolon are the undergrown runners that allow plants to multiply without seed.)
(Unfortunately the pointers goes to dead PDFs)
Spent Thanksgiving week in Phoenix with son and his wife. They are expecting a baby girl in May, their first child and our first grandchild.
One of our fun activities is visiting used book and thrift stores. On a previous trip I found a couple of interesting books on weather and climate. This trip among others I found “El Nino – Unlocking he Secrets of the Master Weather Maker” by J. Madeline Nash. Wow, fascinating reading. How the science behind el Nino developed, the scientist and organizations. Bjerknes, Leetma, CPC, PDO, AMO, Kelvin and Rossby waves, Rio Nido, etc. Published in 2002, 13 years after I first encountered AGW in 1989.
It’s El Nino, La Nina, PDO, AMO, wind and water vapor that drive the weather and climate, GHGs contribute nada, bee fart in a hurricane. But then many of you already knew that.