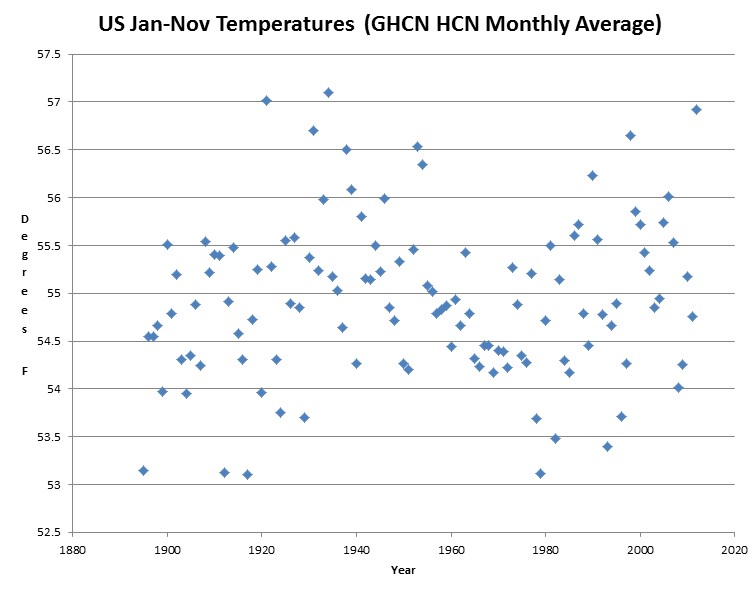
With just more than three weeks left in the year, it’s virtually certain that 2012 will displace 1998 as the warmest year on record for the contiguous U.S. according to NOAA. The agency’s monthly State of the Climate Report, released on Thursday, shows that temperatures across the lower 48 states averaged 44.1°F for November — 2.1°F higher than the 20th century average.
Balmy November Virtually Assures 2012 to Be Hottest Year | Climate Central
The actual data NOAA is using shows that 2012 is third warmest after 1934 and 1921.
Index of /pub/data/ghcn/daily/hcn/
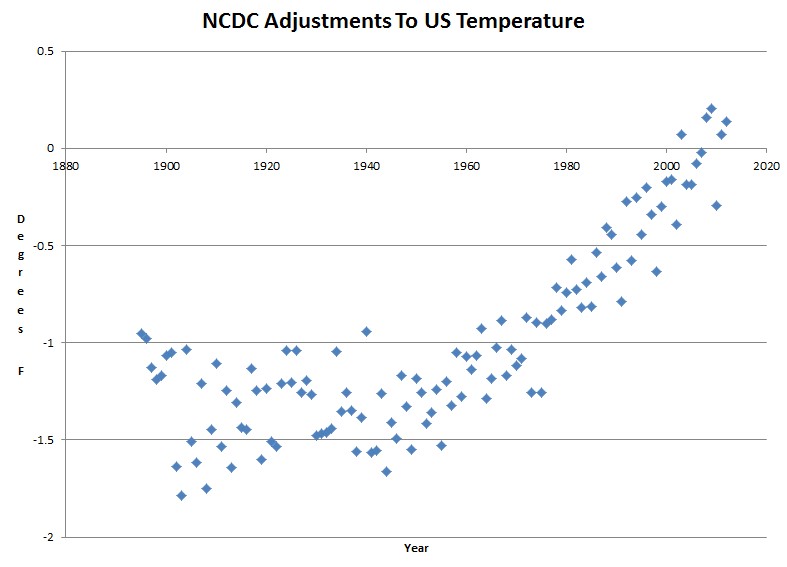
NOAA adjusts older temperatures downwards and recent temperatures upwards. The total adjustment is more than 1.5 degrees.
CONTIGUOUS UNITED STATES Climate Summary
Index of /pub/data/ghcn/daily/hcn/
They issue press releases claiming unprecedented heat – while failing to disclose that they have altered the data.
If Enron did this, people would be prosecuted.
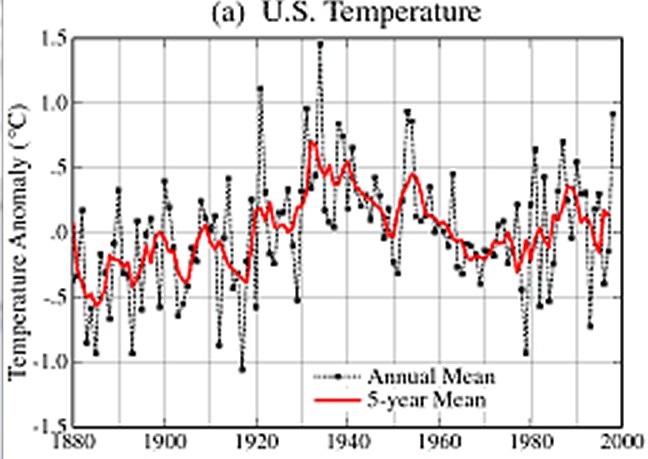
As of 1999, Hansen showed 1934 almost a full degree Fahrenheit warmer than 1998. How did 1998 retroactively become the hottest year ?


So I grabbed the NOAA data myself for the second time, as I’d done some analysis on it last month and wanted to get the updated data that included November. I wasn’t too surprised to see some of this year’s numbers change by a few hundreths of a degree, but I was curious and scrolled back to the 1895 data. I was unhappy to see that many of those values had changed too. I’ve heard of similar things happening with the GISS data, but does anyone know why this is? Are the methods used for homogenization etc that dependent upon the newest month’s temperatures? I’ll probably put it through my testing of the “trends of the differences” to see if even the small changes made since I last downloaded the data (Nov 27, I believe) show a significant bias.
I’ll also go ahead and update my “trends of the differences” analysis between NOAA and RSS/UAH. Last time I was seeing 2-3 sigma positive bias for NOAA versus equality with RSS/UAH and a 3-5 sigma positive bias when you factor in that the satellites should show a larger warming trend than the land data.
I’ll do these analyses when I get some more time, maybe later tonight.
-Scott
Look forward to it Scott!
Even without considering the highly suspect adjustments, imagine if a sceptic was silly enough to declare that a US record cold was evidence against AGW. First, the disbeliever would be told that the US is only a few % of the globe and 1 year is too short a time period anyway to say anything meaningful.
Wasn’t this related to the Y2K GISS-temp code “fix” that Steve McIntyre found to be problematic? After having his nose rubbed in it, Hansen reluctantly demoted 1998 to the 2nd warmest year of the century, by a few tenths of a degree.
Talk about your tempests in teapots . . .
After the Y2K error was found, Hansen continued to adjust his adjustments until the warming became so great over that time period that the Y2K issue became basically irrelevant.
That came after Hansen adjusted 1998 up. As of 1999, 1998 was still #5.
That is what is called “making a mountain out of a mole hill”. The only problem is that there is not even a mole hill.
If you spend a few minutes reading my paper and at least the abstract of the paper published by the American Institute of Physics (cited in reference (8) in my reference [13]) you might understand what happens in the atmospheric physics of both Earth and Venus.
I’m still waiting for a satisfactory alternative explanation from anyone in the world regarding the Venus surface temperature.
Pressure does not maintain high temperatures all by itself, anywhere, not even on Venus. So forget that “explanation.”
My paper is up for PROM (Peer Review in Open Media) for a month, so feel free to publish a rebuttal or debate it with some of these members of PSI. Such a review system far outstrips the “peer-review” system used for typical pro-AGW publications.
Doug Cotton
Convection.
Actual physics disagrees with you. Convection occurs but it’s not nearly enough to explain the temperature of Venus. A planet’s surface temperature is created between the rate of energy that goes in and the rate that goes out. If you have no atmosphere, the temperature will be very hot in sunlight, and very cold without it. Mercury is a good example. However, Venus is HOTTER than mercury. So, it is taking in heat more than it is losing it – until the point it reaches equilibrium. It’s obviously the atmosphere that is driving the hot climate, and it’s obviously the content of the atmosphere.
We’ve sent probes to Venus. We know what’s there. We can measure it. We can also measure greenhouse gases and how they behave in solar radiation.
For you to deny that the greenhouse effect even exists is just denialism of the highest order. It’s like saying there’s no such thing as greenhouses, since if the material has the right properties it will create a net warming effect in solar radiation – just like a greenhouse. Gases can have this same property just like gases can.
Leave the physics to the actual physicists. You’re dead wrong, Steven.
You have no idea what you are talking about. The lapse rate on Venus is the same as Earth and is equal to the adiabatic lapse rate of dry air.
“It’s obviously the atmosphere that is driving the hot climate, and it’s obviously the content of the atmosphere.”
What’s obvious to me is that Wallace is an AGW parrot who is incapable of forming his own thoughts.
Hi Steven,
I’m glad I found your site. The bogus hottest year “news” has been blaring around the media and I’ve been looking for the real story.
Phil H.
Don’t take the governments green pill!
http://www.youtube.com/watch?v=sAni0q-fN-8&feature=player_embedded#!
It took about 2 weeks for Hansen for GISS to “readjust” 1998 ahead of 1934 after Steve McIntyre found the Y2K “problem”.