
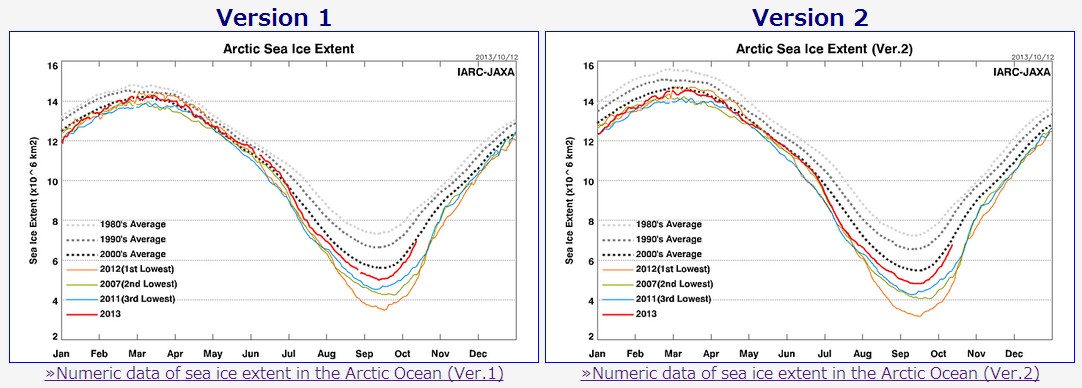
A few weeks ago, JAXA adjusted the Arctic sea iced data downwards in version 2. But it is much worse than it seems – they are adjusting recent years downwards, and older years upwards. Note that in version 1, current sea ice was at the 2000’s average, and in version 2 it is below it.
www.ijis.iarc.uaf.edu/seaice/extent/plot_v2.csv
www.ijis.iarc.uaf.edu/seaice/extent/plot.csv
Like with temperature and sea level data, government climate scientists are tampering with data to make it appear that the past was colder, had lower sea level, and had more sea ice. Perhaps Hansen has been consulting with JAXA.

Good news…in 2023 the 2013 area will increase
Well spotted !
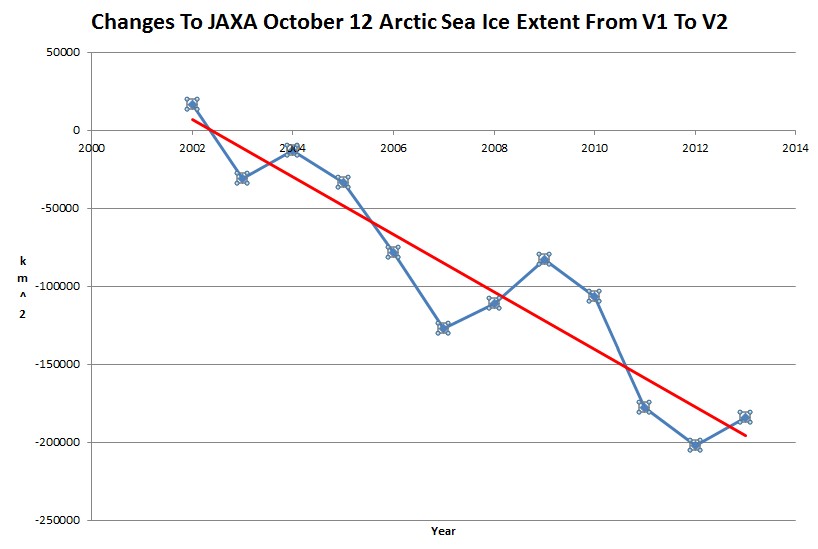
It’s hard to imagine how JAXA can justify raising the 1980s and 1990s average but only at the winter maximum. How could it have taken 23 years for them to figure out that the 1980s average had been previously miscalculated ?? !!
Also I can’t see how they can justify the massive drop in the 2012 minimum along with the smaller drop for 2007 whilst leaving the 2011 minimum about the same.
Surely if a legitimate correction was needed then it would apply to all data
That goes into my ‘Data Tampering’ file, thanks Steve! Good work.
Have you been collecting 8TB drives? 8-D
I’m leasing a wing of the NSA Utah Data Center.
I hear they’ve been firing up a lot of new capacity lately.
It all goes into my “dogma wars” file folder…
these so called climate scientists have dedicated their careers to falsifying data to promote the AGW agenda while chowing down at the big money grant conveyor belt. disgusting!
It will not matter, the “pause” is a peak.
And then we can hang them all.
I seem to remember that the Bremen outfit came out with wildly low figures for Arctic ice two years ago, that of course the media immediately latched onto.
Since then we don’t seem to hear anything from them. Have they lost credibility, as JAXA may end up doing?
The satellite they used failed right after their record press release.
I use a website called Cryosphere today, which plots data from NCEP. They must measure sea ice extent with a different criteria, like 60% or more areal coverage to include a pixle in the data as oppsed to 40% for JAXA because there record trace has sea ice minima for the 2012 at 2.33 and 3.55 million square km, respectively. See
http://arctic.atmos.uiuc.edu/cryosphere/arctic.sea.ice.interactive.html
I am a meteorologist that forecasts for DOT crews across ~20 states