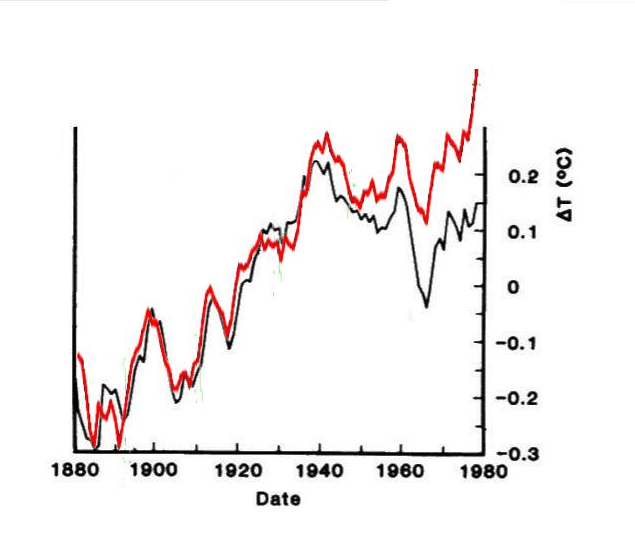
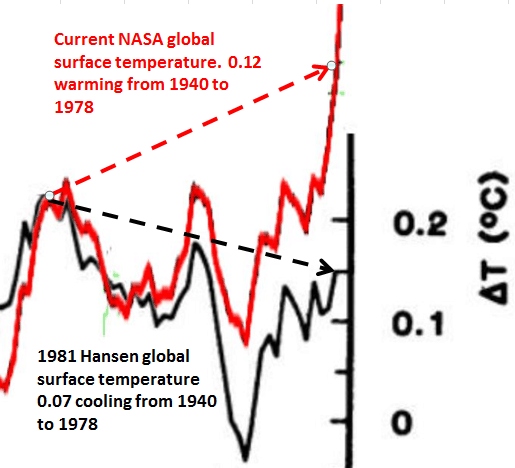
NASA has wiped out the inconvenient global cooling scare, since Hansen’s 1981 graph – which showed it. Red is current GISS, black is Hansen 1981.
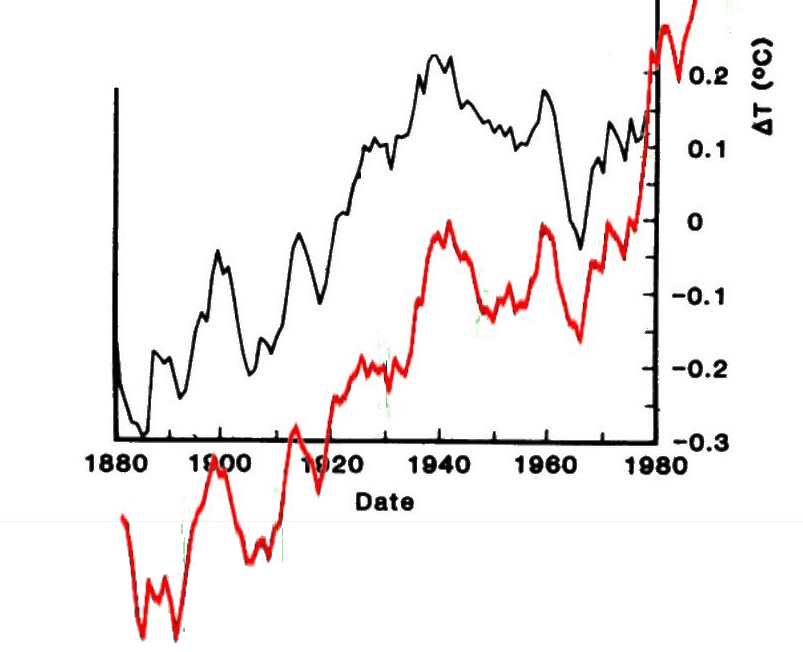
A different way of looking at this is to normalize the two graphs to 1978, showing how they have massively cooled the past.
This next graph normalizes to 1895, and shows how until 1940 it was just a fixed offset. But after 1940 they started seriously messing with the data.
Each different view provides some insight into the thought process behind the tampering.
So why would they do this?


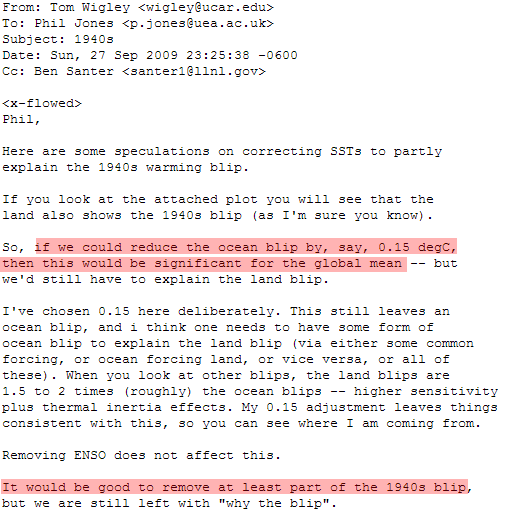
This is very interesting…
“date: Mon Apr 28 13:14:35 2008
from: Phil Jones
subject: Re: FW: Talk on Understanding 20th C surface temperature
to: “Sear, Chris (CEOSA)” , “David Parker” , “John Kennedy”
Chris,
David Thompson is giving a talk here tomorrow on this.
The essence of his talk will be in Nature in a few weeks time.
The skeptics will make a meal of this when it
comes out, but if they did their job properly (I know this is impossible!) they would
have found it. It relates to a problem with SST data in the late 1940s. The
problem will get corrected for at some point. SSTs need adjusting as there must be
from buckets for the period from Aug45 by about 0.3 gradually reducing to
a zero adjustment by about the mid-1960s. The assumption was that after WW2 they were
all intake measurements and didn’t need adjusting.
This will reduce the 1940-1970 cooling in NH temps. Explaining the cooling
with sulphates won’t be quite as necessary. It won’t change century-scale trends.”
http://www.ecowho.com/foia.php?file=0953.txt&search=1940s
Good pick up, Nik. Here’s a couple of contemporary articles from Anthony discussing the issue:
http://wattsupwiththat.com/2008/05/30/buckets-inlets-ssts-and-all-that-part-1/
http://wattsupwiththat.com/2008/05/30/buckets-inlets-sst%E2%80%99s-and-all-that-part-2/
Steve McIntyre was also onto it at the time:
http://climateaudit.org/2008/05/29/lost-at-sea-the-search-for-windowed-marine-de-trending/
Of course, what none of us had back then was the Climategate emails, which puts this neatly into context. Back in 2008, there was no evidence that this was anything other than just scientists trying to improve the record. We now know that it was a considered and conscious fraud.
And then there is this:
From: Jenkins, Geoff
Sent: 03 April 2007 11:42
To: Mitchell, John FB (Chief Scientist)
Cc: Pope, Vicky
Subject: RE: Awful Ch 4 programme
Phils last point is interesting. Is he saying that if the skeptics
realised how fragile the bucket/intake corrections were they could go to
town on them? As I understand it, they all stem from Chris and David. Do
we need more work to get them on a firmer footing?
Geoff
http://www.ecowho.com/foia.php?file=3858.txt&search=intake
All sorts of interesting stuff when you search for “intake” here:
http://www.ecowho.com/foia.php?search=intake
http://www.youtube.com/watch?v=WMqc7PCJ-nc
In a word: Fraud.
Dirty rotten scoundrels….
And it’s a full time cushy government job.
@”Why this blip?” AND “But after 1940 they started seriously messing with the data.”
Tom Wigley et.al never paid any attention to the fact that SST measurement during war time (1939-1945) was, regardless of bucket or engine, very different from peace time. SEE:
PDF 10 pages : Atlantic here: http://www.oceanclimate.de/English/Atlantic_SST_1998.pdf
PDF 8 pages Pacific here: http://www.oceanclimate.de/English/Pacific_SST_1997.pdf
Whatever Wigley, Jones and colleagues say about SST in the 1940s is mere speculation.
The really interesting thing here is the plots above do not include ocean temperatures. The climate criminals just took them along for the ride.
Take a look here at just how far they were prepared to go:
[i]The adjustments immediately after 1945 are expected to be as large as those made to the pre-war data (~0.3 ºC), and smaller adjustments are likely to be required in SSTs through at least the mid-1960s, by which time the observing fleet was relatively diverse and less susceptible to changes in the data supply from a single country of origin. The new adjustments are likely to have a substantial impact on the historical record of global-mean surface temperatures through the middle part of the twentieth century.[/i]
http://www.worldclimatereport.com/index.php/2008/06/04/the-sanctity-of-climate-models/
The problem is that in the real world temperatures are what they are. So a large part of humanity is preparing for the wrong stuff investing in the wrong things. This is not fraud but a crime against humanity. There must be a reason for militarizing the police and impoverishing the population. We know Government is preparing for something.
I agree.
There is no way the top guys are not aware that we are at the tail end of the Holocene and since they are the moves being made are to make sure most of us die off very quickly while causing the least amount of problems. Getting rid of the USA strategic grain reserve and then burning all excess grain as biofuels is one example. The UN small arms treaty to disarm the masses is another and removing equipment from state National Guards is a third.
As William McClenney a Geologist stated in a reply to a Warmist
In a comment to another Warmist:
I do enjoy William’s wit but I am afraid it goes right over the head of most Warmists because they are either blind followers or bought and paid for enablers or worse.
In a nutshell he is saying we are at a very low solar insolation and very near the tipping point into glaciation. We are going to stay at that very low solar insolation for the next 4,000 years and if Dr. Brown (Duke Univ) is correct the earth’s climate chaotic and bi-stable (maybe multi-stable) and we are in the instability band between the two stable ‘Strange Atractors’ – Warm Interglacial and freeze your rump off Glaciation.
The IPCC actually said in the Science Report in TAR:
“In climate research and modeling, we should recognize that we are dealing with a coupled non-linear chaotic system, and therefore that the long-term prediction of future climate states is not possible.’ – I 2001 section 4.2.2.2 page 774
Dr. Richard Alley found in his ice core analysis “…that the last ice age came to an abrupt end over a period of only three years”
Even Woods Hole Observatory warned about wide temperature swings a few years ago and that politicians maybe barking up the wrong tree:
The only possible ‘Tipping Point’ is into glaciation not GoreBull Warming.
ARRGHhhhh, my last comment (February 9, 2014 at 2:43 pm) got kicked into the Polar Vortex!
WordPress really does not like me. { :>(
HOLY CROW!
I thought Europe was having a mild winter.
Newest on Ice Age Now
Avalanches could be the biggest problem because the same amount of snow fell on the nearby mountain slopes.
I think it is a bit milder than the last few years. But still colder than it was ten years ago.
The first graph is the best. You should be using that one.
Pig dog bastards.
Sorta came back to bite ’em, tho’. They “cashed in” the supposed anthro rise in advance, and then were left with nothing when more carefully documented records became the norm.