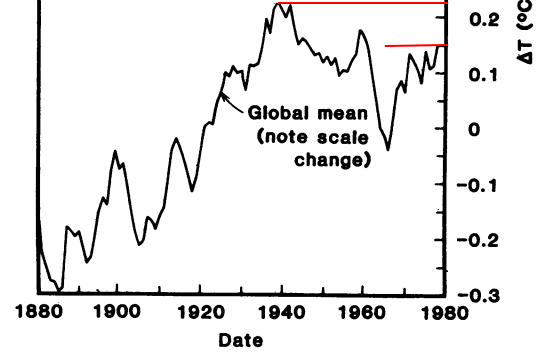
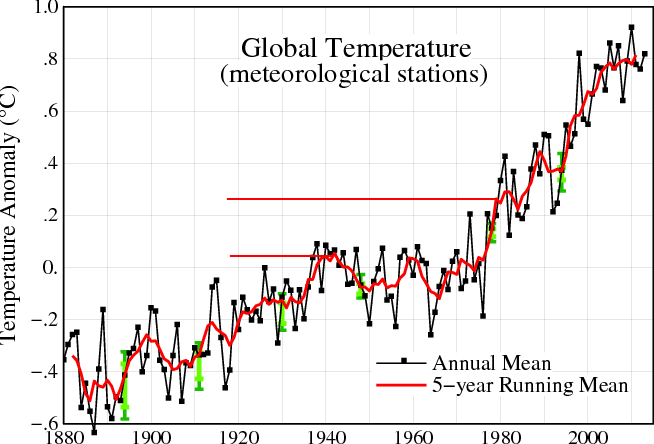
Hansen wrote this in 1981
A remarkable conclusion from Fig. 3 is that the global temperature is almost as high today as it was in 1940.
At the time, he showed 1980 temperatures about 0.15C cooler than 1940.
Now, NASA shows 1980 temperatures about 0.2C warmer than 1940. They made a relative shift of 0.35C, far exceeding Wigley’s hoped for 0.15C


in many years from now, when Continental Glaciers start covering N America, we will still get reports of the ‘hottest’ year ever reports…and that the glaciers are rotten…
I “recommented” this at hotair, as:
James Hansen’s 1981 Remarkable Conclusion
This speaks to blatant warmist data manipulation, and that the warming, even in the 20th century, was actually minimal, as the 1930s were likely hotter than today!
James Hansen (from NASA, and Chief Fear Monger) wrote this in 1981: “A remarkable conclusion from Fig. 3 is that the global temperature is almost as high today as it was in 1940.”
At the time, he showed 1980 temperatures about 0.15C cooler than 1940. Now, NASA shows 1980 temperatures about 0.20C warmer than 1940. HUGE! They made a relative shift of 0.35C. See graphs at link: http://stevengoddard.wordpress.com/2014/02/20/hansens-1981-remarkable-conclusion/
A link to an explanation of “Wigley’s hoped for 0.15C”
http://stevengoddard.wordpress.com/2014/02/07/motherlode-part-iii/
Perhaps some capable person could author a paper showing all those examples of data fiddling that have been shown here over the past few years. There were quite a few examples of individual stations that showed complete reversal of trends — going from cooling to heating.
OT but with same theme:
The Australian Climate council’s drought alarmist hysteria drowned by best rain in 100 years! Parts of Queensland had their annual rainfall in a week.
http://m.couriermail.com.au/news/queensland/rivers-flowing-again-in-record-breaking-wet-spell-but-drought-not-busted-yet/story-fnkt21jb-1226833164277
All these records must be getting to them and the chicken little’s in BOM who were predicting disaster a few weeks ago.
-Record eastern Australian rainfall.
-Record Antarctic Ice Extent
-Record US cold and snowfall
-Record UK rainfall and Scottish snowfall
-Record ice recovery in Arctic
-Record Alaskan ice breakup date in 2013
Three days ago the Crimate Council ran their latest alarmist hysterical press release.
http://m.brisbanetimes.com.au/comment/heat-is-on-to-combat-climate-changes-silent-killer-20140217-32w6h.html
Good timing.
Meanwhile the BOM reckons the chance of rain is average to low.
http://www.bom.gov.au/climate/ahead/rain_ahead.shtml
Wake up boys! It’s pissing down rain across the Australian outback!!
Even WA had record rains across the state last week.
Swan Hill (Australia) had its coldest February night in over 15 years. Sub zero temperatures in summer!!!! Why doesn’t CO2 work in summer? Is it broken? Could it be that CO2 has nothing to do with air or ocean temperatures or climate??
http://m.weatherzone.com.au/vic/mallee/swan-hill/past24hours
Oops. Not sub zero. Thats dew point. But Swan hill did have coldest feb temp in at least 15 years.
Well done, Steve!
The NASA GISS server no longer has this:
http://pubs.giss.nasa.gov/docs/1981/1981_Hansen_etal.pdf
Worse, GISS has configured a robots.txt file to block archive.org from saving it:
http://wayback.archive.org/web/*/http://pubs.giss.nasa.gov/docs/1981/1981_Hansen_etal.pdf
yields:
Page cannot be crawled or displayed due to robots.txt
http://pubs.giss.nasa.gov/robots.txt contains:
User-agent: *
Disallow: /books/
Disallow: /cgi-bin/
Disallow: /docs/
Disallow: /gfx/
Disallow: /supplement/
But I found this one on the same server:
http://pubs.giss.nasa.gov/docs/1981/1981_Hansen_etal_1.pdf
Is it the same paper, or different? Does anyone have a copy of 1981_Hansen_etal.pdf, to compare the two?
Note: Steve McIntyre also touched on this, some years ago:
http://climateaudit.org/2007/02/23/hansen-then-and-now/
Thanks Dave. That is the same paper I am using.
Clearly, archive.org is a threat to the Minitrue memory hole.
Per Phil Jones in 2005:
This is from an Australian at BMRC (not Neville Nicholls). It began from the attached
article. What an idiot. The scientific community would come down on me in no
uncertain terms if I said the world had cooled from 1998. OK it has but it is only
7 years of data and it isn’t statistically significant.
http://www.ecowho.com/foia.php?file=1120593115.txt
Please give a citation for Hansen’s comment and for Wigley.
We can’t very easily make use of your discoveries without citations.
http://pubs.giss.nasa.gov/docs/1981/1981_Hansen_etal_1.pdf
Some of the more notable ‘adjustments to the Australian HQ (that’s high quality.. lol) record, as used by Giss.
These are the areas that have given us the “hottest heffer” this year .
In the original record, note particularly a peak in the late 1930’s and especially the early 1900’s
Wangaratta http://imageshack.com/a/img62/8606/ryi8.jpg
Dubbo http://imageshack.com/a/img841/5209/um31.jpg
Echuca http://imageshack.com/a/img801/638/wo47m.jpg
Darwin http://imageshack.com/a/img197/821/9p4q.jpg
Maryborough http://imageshack.com/a/img560/1208/41mu.jpg
Wagga Wagga http://imageshack.com/a/img812/8859/ap4y.jpg
Ballarat http://imageshack.com/a/img837/1914/w92l.jpg
Benalla http://imageshack.com/a/img585/7364/sh6l.jpg
ps.. once that post with all the links gets through moderation.
The pics are from this site.. I’ve just grabbed some obviously really bad ones
http://kenskingdom.wordpress.com/2014/02/