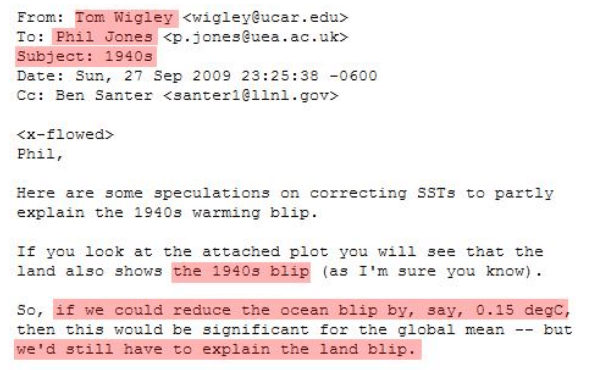
NikFromNYC sent over this climategate E-mail, which discussed knocking 0.15 C off the inconvenient 1940 temperature.
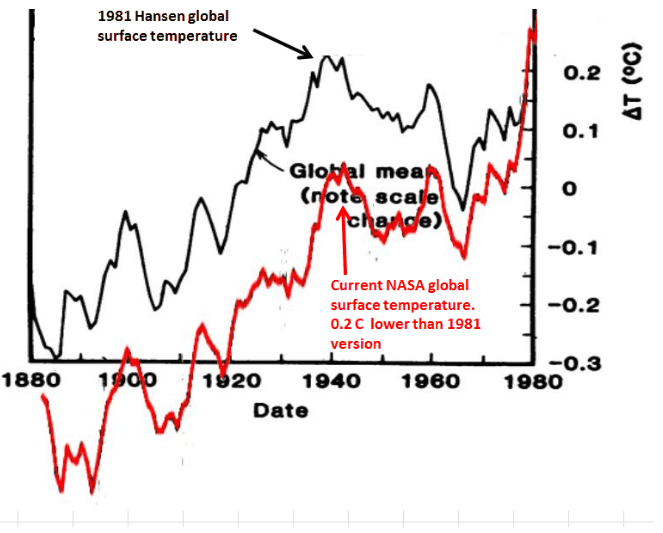
But the scientists delivered even better, knocking 0.2 C off 1940, and eliminating that nasty 1940-1970 global cooling – which wrecked their credibility.


Found this amusing Steve, as referenced in the above email; http://www.magicc.org/ “MAGICC:
The climate system in a nutshell.” Maybe we are in Oz after all 😉
Ooo! Dr Ben Santer.
Ranked 12th in voodoo science worldwide.
Favourite child of the corrupted WMO!
Inconveniently conspiring to adjust scientific data?
He must be innocent of course.
Lots of nasty things hiding in the deep oceans.
Well you should certainly know Gator. Or at least your cousins the Salt water crocs should.
Possibly the worlds biggest story on global corruption hidden right there in plain sight – and the ‘authorities’ do nothing, nor do the media raise so much as a questioning eyebrow.
Quite. Astounding.
If the BBC / Guardian discovered Quadrilla had manipulated shale gas data to prop up the case for fracking they’d be all over it. But flag up a ‘green’ racket influencing almost the entire western world governments $multi-billion energy policies? Nada. The silence is deafening.
Dear Mr. Goddard, Here is another graph that doesn’t appear in Al Gore’s talks. Notice the striking resemblance to the graph of CO2. There is a lot of carbon in the earth’s crust. When exposed to oxygen at high temperatures as in volcanoes CO2 is formed. Earthquakes also encourage the release of CO2 from the oceans by shaking them as when a soda is shaken. The extra slope on the graph can also be accounted for by CO2 released from the oceans by warming. Have you seen any studies that disprove global warming by showing no warming trend on graphs of rural temperature readings? Sincerely, John Smith
That’s damning.
Criminal.
I always keep Jo Nova’s Hansen/GISS chart handy
http://jonova.s3.amazonaws.com/graphs/giss/hansen-giss-1940-1980.gif
I hope James Inhofe is following Steve’s work.
The rationale for adjusting away the ocean peak is a switch away from buckets to ship intake thermometer readings in the 1940s. However, Steven McIntyre dug up a chart that showed that the actual switch away from buckets was much later, in the 1970s, with insulated buckets also being introduced before that, too. The big dodge though is how they suggest adding a correction for sea temperature all based on buckets that the exactly matching land temperature variation falsifies as being a valid reason for the 1940s peak, and that is outright fraud at work.
https://www.google.com/search?q=buckets+site%3Aclimateaudit.org&ie=utf-8&oe=utf-8&aq=t&rls=org.mozilla:en-US:official&client=firefox-a
No, that is the public story line that they sell as a rationale. They were coming up with ways, any way they could, to make the trend look as bad as possible. He had a graph in mind that was needed to market the story, then went to adjusting away to get the data there.
Criminal. If it was financial data they would be in jail.
Wow! Not even a modicum of science about that. “See that bump – I don’t like that bump. Take it out.”
The 3 consecutive winters 1977-1979 were almost as cold as any other single winter in history! Our own modern day “Little Ice Age” that climate scientists don’t like to talk about. Chicago, Buffalo and Boston snowed in for weeks at a time. Snow down to Miami!
There`s a youtube video from the hadley centre giving out their inexcusable reasons to raise ww2 sea temps and the temp climb up and away from hadcrut3.
Who would think a gallon of water gets cold so fast.