
US July maximum temperatures have plummeted since the 1930s.
Over the same period, US July minimum temperatures have increased.
The difference between maximum and minimum temperatures has dropped by more than 15%.
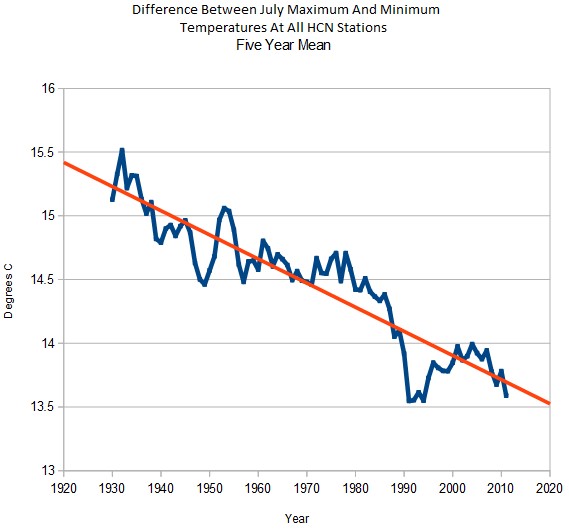
This is very indicative of urban heat island contamination. Paved roads, snow removal, irrigation, and other factors cause nighttime temperatures to be elevated, and all have increased sharply since 1930. We have seen nearly 2C (3.6F) summer UHI since 1930.
So how much does USHCN correct for UHI? less than 0.1F
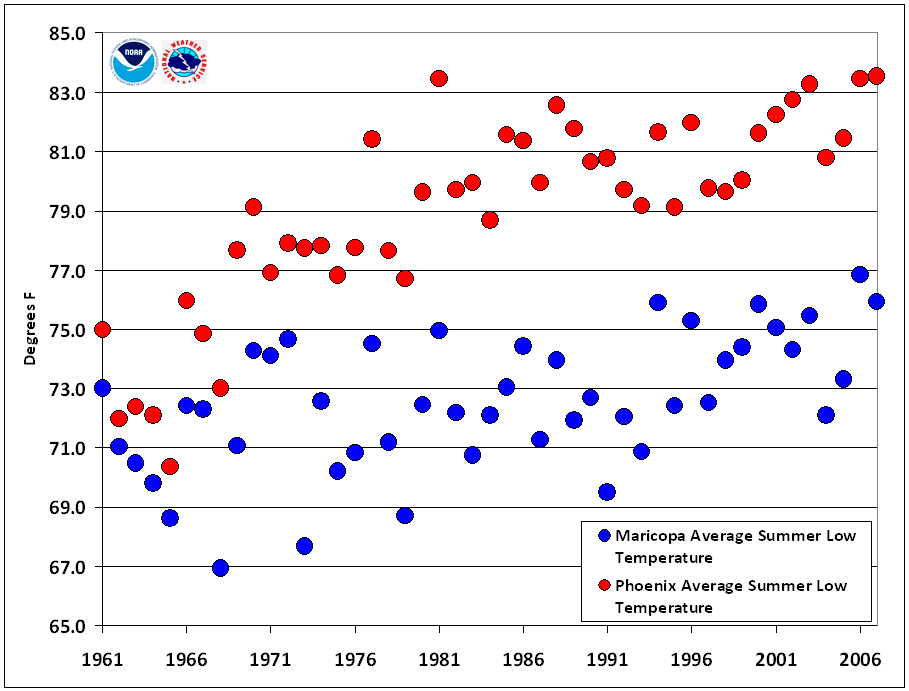
NOAA has documented more than six degrees of UHI in Phoenix.
At the same time they exaggerate TOBS and FILNET, USHCN massively undercounts UHI. If they did their adjustments properly, they would increase the cooling trend since the 1930s, rather than reverse it.
As a result of data tampering, they have made a complete mockery of the US temperature record.
Zeke blows this all off as “changing station composition” This is not credible for many reasons. Zeke needs to come up with a physical explanation for why the changes since 1930 have caused daytime temperatures to plummet, while nighttime temperatures have increased. And remember that the station loss didn’t begin until 1990.

OT, but you must know about this from Oz:
http://blogs.news.com.au/heraldsun/andrewbolt/index.php/heraldsun/comments/al_gore_advises_clive/
Note the first ‘Update’.
So what does Watts say about this data ? Bureaucratic error ? Earnest hard working gov’t union workers who just confused the data ? Honest mistakes ? Maybe an imbecile might believe that. It is clear that data fraud is a key component of the scam. See Mikey’s nature trick and the hockey hooey for more info.
The premise may have a basis in reality. The actions do not.
Hey philjourdan! Yes, the trick seems to be to offer some sort of superficially plausible reason for a minor adjustment — then adjust the data by an amount MUCH, MUCH, greater than what your reason justifies. The result it that most people will simply point to the plausible reason for a minor adjustment and stop there. “Adjusted data? Gosh! NOAA showed you why they had to fix the data!” They will not look a little deeper and see that the stated reason only justifies (at most) a minor or temporary tweak.
And then they adjust the UHI by a teeny tiny amount just to be superficially plausible the other way. It’s a major con job.
And it works – as most people do not pay attention – they just love the slight of hand from the magic show.
I question that reality enters into their thinking at all. They consider such things as beneath them. It is their cause first, last, and always. If it were otherwise, they would make their process transparent and available to those who are forced to pay their salaries by the taxes extracted from them.
Yet, as it is with all who attempt fraud, a clear trail of their effort is left even as they attempt to hide what they have done. Their actions against the interests of their employers, we the taxpayers, is being exposed. Soon, they will have no place to hide.
I agree with your assessment of their considerations. However the ‘reality’ enters into it in order to convert more to their cause. “Because I said so” works with the brainless sheep, but they are looking to expand to the ones that ask “why” and then say “Huh?”
Keep slaying the dragons Steve (T***). 😉
But the dragon has all the political power and might be appeased with an “olive branch” http://chiefio.wordpress.com/2014/06/04/lenr-year-of-answers/#comment-58580
The dragons must be confronted, not placated.
+1
Never back down from a bully. He will just keep beating you.
Are the first three graphs raw or final data?
Your second and third have the exact same titles though the Y scale and data are different. It would be nice if the third had the word Difference in there somewhere.
It is the average of all July daily temperatures per year, so it is the entire raw data set.
Steve, the 2nd and 3rd graphs have the exact same title. I agree with jmr that one of them must be mislabeled. Also, I thought that one of the “predictions” of GHG theory was that night time temperatures will increase in many places?
Fixed, thanks.
Bill, they also predicted the Hot Spot with raised Tropopause and a cooling Strat, accelerating warming and sea level rise, loss of ice at BOTH poles, worsening droughts, floods, hurricanes, tornadoes, hot spells cats sleeping with dogs etc.
So you pick one prediction that has come true for a different reason. Two possibilities. 1) they got lucky 2) they actually learned enough about what was happening that they made it up to cover themselves.
Their prediction was also that there would be higher high temps. I pick 1.
We need Congressional hearings about data tampering with our own resident expert, Steve Goddard, testifying!!
We need to blow these phonies out of the water, now that we unmistakably have the data on our side. There is potential to do great political damage in the process.
Lower highs and higher lows. Sounds the opposite of extreme.
Andy, but then they would put Zeke, Watts, Lucia and Mosher on the same panel. Maybe that would be fun to watch. In the end, it would probably confuse everyone but the guys on the panel. I mean, why use actual temps? That’s just plain crazy talk, right? 🙂
who in their right mind would make such a big deal out of a fraction of a degree in temp change, in either direction
You could not even see global warming on a thermometer
Especially after you add the error bars…. Notice how no one ever adds the error bars?
I wonder if any of these graphs/charts show up in one of the weekly or daily meetings of the ‘technical staff’ at the NCDC or NOAA … would be interesting to know if any NOAA-resident domains have made access to the website here pulling graphics off-line for said meeting …
.
Could lower highs and higher lows also be indicative of more cloud cover?
As a result of data tampering, they have made a complete mockery of the US temperature record.
And Steven remember what you said on the radio with Dick Morris a couple of days ago. The US temperature record is the most complete and reliable. And global record is so spotty that with slight manipulations and bias in station selection the warmists apparently can pull any trend they want out of hat. With the US record being the most reliable, and showing a decline in temperatures since the 1930s, it is logical to infer that very likely the global reality is actually closer to that found in the US.
Consistent with this is what I found yesterday: 6 out of the 7 continents set their record for their coldest day after their record for the hottest day. There’s just very little chance that that would the case if the globe had been in runaway warming, or any warming, for a century. What’s more, I checked *all* the hemispheres: the Northern Hemisphere, the Southern Hemisphere, the Western Hemisphere, the Eastern Hemisphere, and ALL the hemispheres set their record for their coldest day AFTER their record for their hottest day. Source. As I said before, what this means is simple: something doesn’t add up, as far as the Chicken Little Brigade and their temperature “data.” Global warming my rear. This is a total charade. A century of runaway out of control hockey stick warming? Nope.
NASA and NOAA’s goal is not to produce an accurate temperature record; it’s prime directive is to create a warming signal even when one doesn’t exist. (Demonstrating one’s loyalty to the AGW “consensus” offers the extra benefit of a steady paycheck).
Creating a global warming bogeyman is hard work. It requires all sorts of igenious data fixing, adjusting and manipulation (e.g., TOBS, homogenization, interpolation and, no doubt, a few brainstorming excursions into the realm of tarot cards, crystal balls and Oija boards). The bosses in both agencies should submit their Twilight Zone temperature-interpretations for an Oscar nomination in the science fiction category.
Lol on the Oscar nomination idea! Of course the problem is that, in general, the people don’t know that it’s fiction, “science” fiction.
Has Zeke actually demonstrated his assertion of “changing station composition”, or is he poking in the wind?