
Several people on both sides of the debate continue to criticize my averaging of the entire measured USHCN data set.
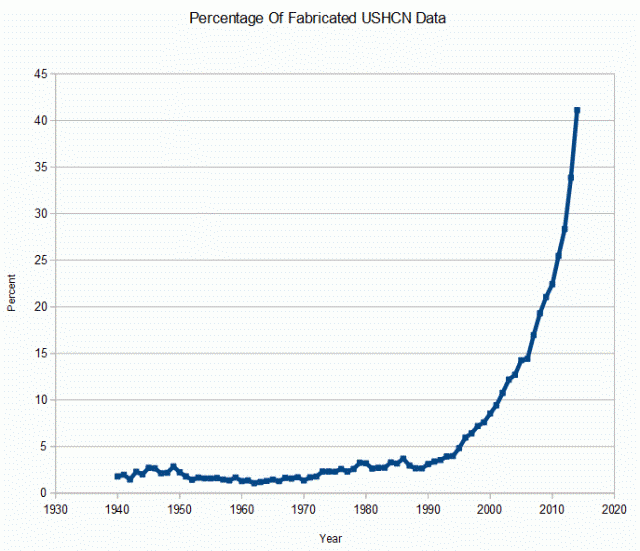
The graph below shows the average of three different USHCN groups of data since 1990, which was the year they started exponentially losing data.
The raw data is green. It shows a small warming since 1990, all of which occurred before 1998. The final adjusted data is blue, and shows much stronger warming. The fabricated data (temperatures marked with an “E”) shows a very strong warming, and is the component of the final data which creates almost all of the difference between final and raw.
According to the USHCN V1 documentation, there is no additional adjusting needed after 1990, and according to the USHCN V2 documents they use the same TOBS algorithm as V1. So other than infilling, final should match raw after 1990.
I don’t see how this could be any clearer. Infilling of fabricated temperatures is causing the vast majority of reported warming since 1990. The reason I see this and others don’t – is because I use the actual data reported by USHCN exactly as it is reported.
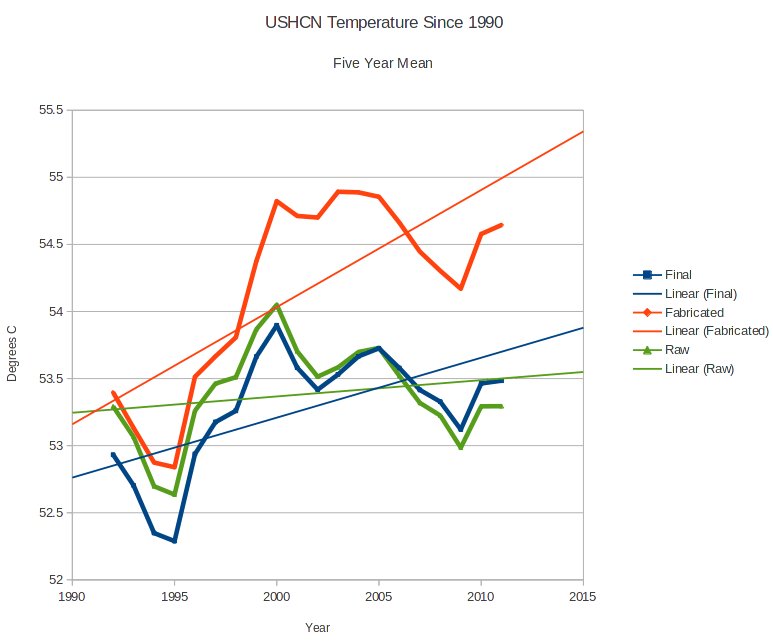
Note how the divergence coincides with the beginning of wide scale station data loss.

I just don’t know how you could make the story any plainer to people. Heck, I think even my tom cat could understand this issue if I could get his attention. 🙂
Interesting that the final temperature was colder than the raw data up until around 2005. The fabricated data was always warmer than the raw data. So what made the final temperature lower than the raw data? Looks like another adjustment was made to cool the past.
Hmmmmm. Should not be possible if all other adjustments are upward. Better check that one Tony before the climate police throw a tantrum.
That would already be difficult in a free country so in the police state they call the USA it will be impossible.
The GHCN data set also has problems.I post this comment over at Lucia’s last night, but I see today no one has posted a single comment anywhere on her site since mine at about 7.30 last night.
———————————–
Here is an animated gif of 8 stations within 500 km north of Key West. Data is from GHCN. I think it demonstrates just how schizophrenic the adjustments are. This is all individual station data and shows only those station years with 12 months data in both the raw and adjusted datasets. As it is full years no one can complain about averaging the twelve months to create a yearly value.
In most of these cases the raw set has 20-30% more 12 month years. In many cases the adjustment process has not simply removed a single month here and there from a year in raw dataset. In many cases it has removed 6-12 months of data. Gives an idea how much is likely being removed in other years which may not have even had 12 months raw data to start with.
You will notice in some cases there are stretches of 5-10 years where the adjustment remains flat. I don’t know, but I think those periods are dominated by the TOBS adjustments. 5 of the 8 stations show adjustment toward cooling the past, the others show warming.
Runs continuously at about 7 seconds per image. Arranged alphabetically.
Note: The temperature scale is not the same for all images. The software auto-adjusts according to value range.
http://i57.tinypic.com/34edkb6.gif
PS
These all happen to be USHCN stations. GHCN starts with USHCN raw and creates their own adjusted. Doesn’t do the estimated thing.
Gridding the data first changes trends slightly if you use a 1×1 Lat/Long grid.
For example, TMax 1998 to 2013 – Month of December only
Gridded raw = -1.14C/dec and not gridded = -1.1C
Gridded tob -1.09 and not gridded -1.05
Gridded Final = -0.84 and not gridded -0.78
The ratio from raw to tobs to final barely changes by gridding.
Exactly. The orthodoxy obsession with gridding USHCN is absurd. It is just noise compared to the infilling nonsense.
Can you say “Obfuscation and Distraction” ???
I could be way off base, yet I am of the opinion that those obsessions (with gridding and infilling) exist purely for the purpose of making it difficult to determine the magnitude of the “adjustments”…..
Of course the priests in the high temples of CAGW will shout blasphemy at the whisper of such an opinion…
🙂
Momentum seems to be swinging your way, WUWT has a bit of a mea culpa post in which Anthony not only admits you were correct, but also nukes that horrible Politifact piece..
To any small degree my own independent validation contributed, I’m glad to have helped 🙂
Well on the bright side.. its seems others are coming to the same conclusions as you..
Watts just has a post yesterday that all but said you are correct.. The NOAA data is FUBARED..
(And who knows what other data s screwed out there?)
Now i wonder if polito’fact’ is going to retract its “pants of fire:” ruling ..And say .. Whoops there hasnt been any global warming .. our bad.. Obama is wrong and going to kill the economy for nothing …
(sound of large thump and laughter) … that was me falling out my chair laughing at the previous thought.. not a chance..
Anthony Watts will regret that he shot first and asked questions later. His original rebuttal as garbage as it was will be held up as the final verdict against sceptics for several years. Nothing he can say or do will change it.
These words by Omar Khayyam in the 11th/12th century should be in his (Watts) memory forever..
The Moving Finger writes; and, having writ,
Moves on: nor all thy Piety nor Wit
Shall lure it back to cancel half a Line,
Nor all thy Tears wash out a Word of it
Well i do have to commend Watts that he admitted the mistake… it happens…
(Waiting for curry and other as well )
The important part is not only admitting it; ; you have to be as vocal in correction as you were in denunciation ..
The Problem is the ‘fact check’ sites are out of his control..
So the likely hood of them doing : “Our Bad.. AGW is bunk because all the numbers are bunk”.. is somewhere between zero and -infinity …
Here’s some Omar Khayyam for the warmists:
Indeed the Idols I have loved so long
Have done my credit in this World much wrong:
Have drown’d my Glory in a shallow Cup
And sold my Reputation for a Song.
You are winning. Way to go.
NOAA Reinstates July 1936 As The Hottest Month On Record
Read more: http://dailycaller.com/2014/06/30/noaa-quietly-reinstates-july-1936-as-the-hottest-month-on-record/#ixzz369MCcXMg
Saw Drudge posted the following: http://dailycaller.com/2014/06/30/noaa-quietly-reinstates-july-1936-as-the-hottest-month-on-record/
Steven, I have been doing my own research as a result of taken several courses on climate science and energy. Since I was interested in knowing if the weather had changed in an area I grew up, I went directly to the Illinois climatology office to obtain data.
One question – what is the definitive data site for raw historical temperature records that I should use in my research? With all the discussion about poor siting, I am not sure what to use…
Use the raw USHCN data
ftp://ftp.ncdc.noaa.gov/pub/data/ghcn/daily/hcn/
Steven, wouldn’t it be better to use the actual Station Forms if available, just in case someone at USHCN made an accidental or not typo?
The actual station forms would be a good starting point, but as of now there are so many that the resources required to plow through them are formidable. It is a shame that NOAA does not and did not have a robust process in place to do this as they came in. Their quality control algorithm points out problems that could be fixed easily with manual inspection. For example, a summertime temperature of -74 gets kicked out and replaced with an estimate, whereas a human inspecting the form would see the surrounding temperatures and conclude the smudge on the form was not intended to be a minus sign, and replace it with a simple 74.
Of course the process of keeping a temperature record at NOAA would not allow this. They do not keep a static historical record and then add to it as new data comes in. Instead, each month they treat the data as if they are seeing it for the first time, and run their quality control programs on it anew. They could solve a lot of their problems, IMO, if they had a static record that they appended to.
In the words of Ronald Reagan: “Don’t let the turkeys get you down.” Keep up the good work. It looks as though it already is having an effect.
Fabricated Data … its “the New Hockey Stick”……….
If this is the future,
Jeb Bush is catchinig up with Hillary Clinton in presidential polls
http://rt.com/usa/169480-hillary-clinton-behind-bush-poll/
Massively Corrupting the US Temperature Record is not your biggest problem.
I am quite surprised that Steve McIntyre has not taken up this story big time.
In fact I am amazed at how many other Sceptic Forums have not even mentioned it.
For example
JoNova
GWPF
NoTricksZone
to name just a few.
Perhaps one could compare the “estimated stations” to private weather stations located nearby.
The Citizen Weather Observing Program (CWOP) collects data from citizens with personal weather stations. It is distributed via the Meteorological Assimilation Data Ingest System (MADIS). CWOP appears to have grown out of an earlier HAM radio program, APRSWXNET. See links below.
CWOP: http://www.wxqa.com/
MADIS: http://madis.noaa.gov/
APRS Weather Wiki: http://info.aprs.net/index.php?title=Weather
The last link has a good overview of the program.