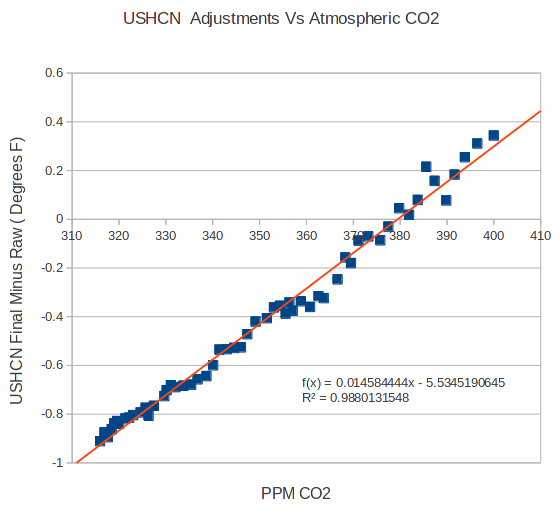
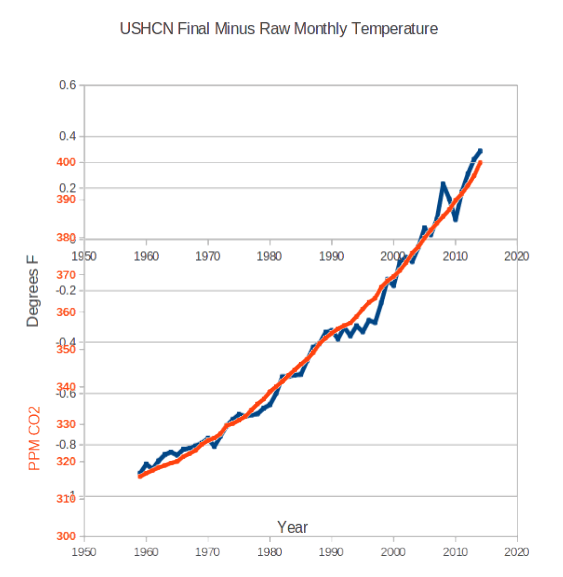
Yesterday I published this graph, showing almost perfect correlation between USHCN adjustments and NOAA atmospheric CO2 numbers.
Raw: ftp://ftp.ncdc.noaa.gov/pub/data/ushcn/v2.5/ushcn.tavg.latest.raw.tar.gz
Final: ftp://ftp.ncdc.noaa.gov/pub/data/ushcn/v2.5/ushcn.tavg.latest.FLs.52i.tar.gz
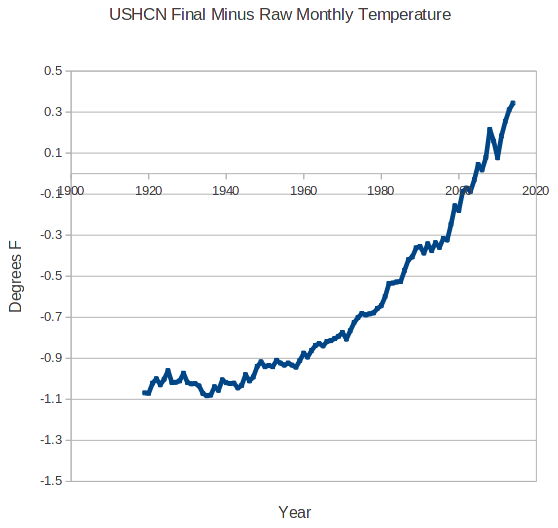
I have long wondered why USHCN adjustments are increasing exponentially. They are now nearly 1.5F total.
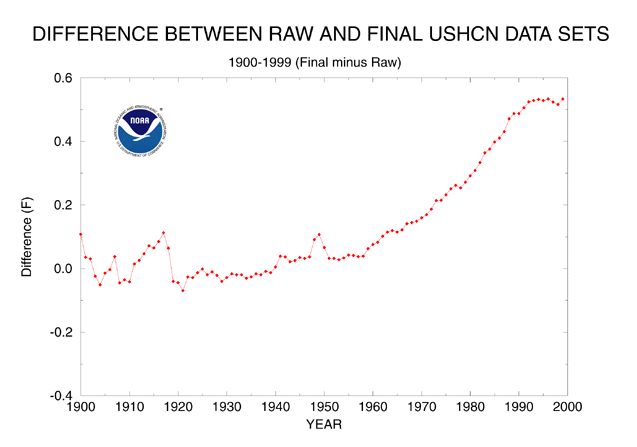
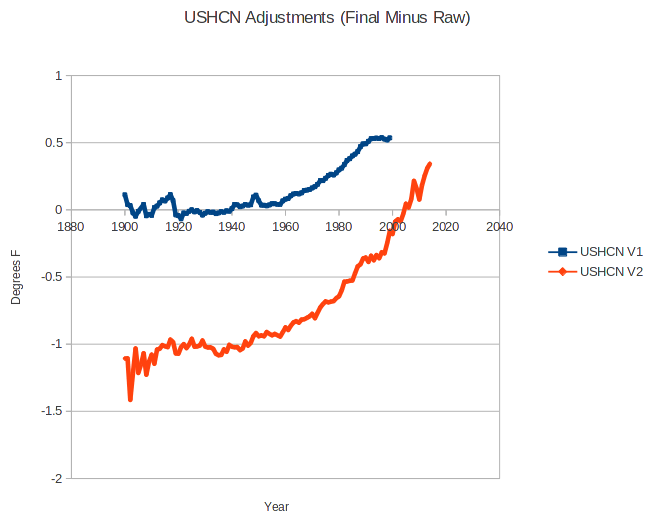
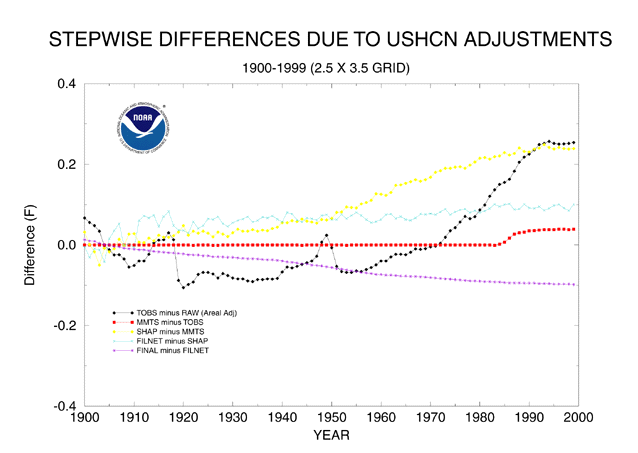
According to USHCN V1 documentation, the adjustments were supposed to level off after 1990 at 0.5F. Instead of leveling off, they have sharply increased and are now almost three times as large as the USHCN V1 adjustments.
Note the huge disparity between the V1 and V2 adjustments, which are supposed to be almost the same.
The USHCN V2 docs say that they use the same TOBS algorithm as V1, yet TOBS was supposed to go flat after 1990. How can the same algorithm produce dramatically different results in V2?
Up until now the adjustments have made no sense, because they didn’t appear to correlate to anything in the real world. But now we can see that correlate almost perfectly with the amount of CO2 in atmosphere. Red below is CO2 and blue is the USHCN adjustments.
This appears to be a perfect example of confirmation bias coded directly into their algorithm.
“Our algorithm is working as designed”
– Recent NCDC press release
“If the facts don’t fit the theory, change the facts”
– Albert Einstein.


Reblogged this on Sage Vals and commented:
I haven’t checked this myself, but if Steve is right – and I have no reason to doubt him – this is very important and serious.
Here, the figures are US only, but if the same adjustments are applied to global figures, without a very very convincing explanation, then it is fraud, pure and simple.
How do you know these figures are US only? I don’t see it stated anywhere on the charts. That could mislead the reader into thinking they are perhaps global temperatures if the reader was thinking at all.
It is that crazy, crazy use of the letters US in USHCN
LOL +1. My first laugh of the day.
…………..if the reader was thinking at all.
ROTFL
Why would it matter if it is US only or not? Either way, IT IS BLATANT FRAUD!
+1 yes!
Steven,
Here’s a different co2 temperature graphic for you to use sometime.
http://i57.tinypic.com/2h6edg8.gif
Somehow, don’t ask me how. Someone took temperature readings at 90N from 1950-1990. First few years and last year are broken records, so I started this graphic in 1960. 12 months each year. with the exception of one missing month(Apr 1966). 30 years is what they claim to need to call it climate.
Enjoy.
Love it!
The only “climate change” is the coming Planet X and the chemtrails that hide it every day globally for the past ten years.
Steve it looks like an Indian Summer in the Arctic
http://ocean.dmi.dk/arctic/meant80n.uk.php
Lasted kinda 12 hours it did…were doomed again 🙂
This has been always my problem with the adjustments. If one assumes the adjustments are valid in the first place (of which I have my doubts), once the temperatures are adjusted, even if it takes a year or two, that should be it. Instead they adjust the temperature on a nearly monthly basis, always cooling the past and warming the present. IMO, It is policy-driven fraud designed to promulgate the global warming/climate change/climate disruption/carbon pollution, or whatever new name they come up with, parable.
I have my doubts about some of these ‘adjustments’ – I don’t suppose anyone knows if there have been any validation tests/scripts/results published? I have a feeling these are created with the grad student level of testing – “looks right”. The NOAA, NCDC and NCEP should be subject to a complete third party quality audit.
Pay no attention to thermometer data. Just look at the RSS and you can’t go wrong.
http://www.remss.com/research/climate
Or UAH. UAH cover more of the poles than RSS.
Stephen, If you look at RSS and UAH, you will see that the major difference is that UAH didn’t show as much jump at the 1998 ElNino, but had caught up by about 2006.
I think I can see how having more “polar” data in UAH would cause this slight discrepancy. ie the effect of the 1998 ElNino sort of lagged behind at the poles..
Any thoughts?
Does the CO2 data in your fourth graph only start in 1960?
Also, is the first graph y-axis mislabeled as C. instead of F. ?
The Mauna Loa data starts in 1959
I see you have now corrected the y-axis to F. from incorrect C. Thank you.
The obvious conclusion is that above the US at least, the addition of extra CO2 to the atmosphere has no effect on raw temperature readings whatsoever.
Who’d a thunk it?
Here zeekie, moshie, Ezekiel, moshie. Come on boys!
I have mashed and modified a Dilbert for the occasion.
http://tinypic.com/m/ibexk1/1
Nice, 🙂
Very nice, very nice indeed 🙂
It doesn’t make any sense since the effect of CO2 is logarithmic 5.35x ln(C/Co). So, even if you believe that equation, the temperature increase should have been roughly linear with an exponential increase in CO2. They’re not even fudging the numbers correctly if they have an understanding of their pet theory.
Hey Michael! True, if CO2 really were warming things, the effect (all other things being equal) should be logarithmic. On the other hand, when looking at a chart that only shows part of one doubling, the effect for that small portion is pretty close to linear. Not that it makes much difference anyway since they are just making up the adjustments for an imaginary effect that is not present in the raw data.
🙂
Logarithmic starting at Zero CO2 right?
Here we end up at 400…. The change from 350 to 400 should be almost nothing since that’s where CO2 loses it’s effect … Has captured all the Long Wave Radiation that it can…
Not quite starting at zero. The doubling effect breaks down for very low concentrations. Let’s suppose that the doubling constant for CO2 is 1 degree Celcius. Imagine a planet with one molecule of CO2. Now add one more molecule to double the CO2. Planetary temperature will not rise one degree. The logarithmic effect is a good of rule of thumb, but it is not universally correct for all concentrations.
Linear is good enough to get the attention and money while not raising suspicions too much. Also it’s over a small run of CO2 increase. Take a small segment of pretty much any curve and it can be approximated with a line. If it can’t take a smaller segment until it can be.
either way this works well enough for the purpose they are doing it.
well, except that log(0) is, well, uh … NaN or Error. Since CO2 is not capable of “warming” anything in this universe, a logarithm of this effect will not compute.
The best part is, they then proceed to build models that hindcast against this “data” and lo! the models predict temperatures will rise as a function of CO2 levels.
Gee, how did that happen?
It’s a perfect self-licking ice cream cone: add the trend, develop a model that hindcasts against it, project the trend forward with the model, receive tens of billions in grants to study this “problem,” rinse, repeat.
All Good Science ™.
…the amazing part is that they still seem to be confused as to why their computer games are so FUBAR
“they still seem to be confused as to why their computer games are so FUBAR”
The reason why they cannot understand the problem is because their pay check depends upon their not understanding. (And I am being very charitable to them in saying it that way. A much simpler explanation is that they are lying.)
There are in fact two things, science and opinion; the former begets knowledge, the later ignorance.
Hippocrates
OK, great info. I follow your concept here that the PTB are fudging the temp data to correlate with the rise in CO2. This is extrodinary and hats off to you for pulling this insight together.
Now for another important opportunity. This information needs to be translated so a much broader audience can readily and clearly understand your message; not only for their own ingestion, but to also enable them to pass this directly on to others.
I’m an engineer, so not a complete moron, but I am admittedly quite ignorant of the various acronymns thrown about on this page. The acronymns make perfect sense for all those who understand them. But for the layman, it’s alphabet soup. Your message is simply too important to be lost in translation. Sure, I can google them, but the average person may decide to simply blow this info off rather than trying to dig a bit more to understand. They should admittedly, but it’s just another barrier that impedes their understanding, which makes them much less likely to share the info further.
Planet earth needs this information understood by the masses for obvious reasons we all can see here. We need something like a Carl Sagan type approach that is able to effectively provide the technical reasoning of the message wrapped in a non-treatening inviting package. We don’t want the masses sitting in the back of the class afraid to raise their hand and ask a question for fear of looking stupid, and then get crucified for asking a stupid question if they actually do muster the courage to ask it.
We need a “climate 101” page somewhere here that the laymen can reference and is highly visible on the home page where the concepts and various acronymns can be defined. I think this would be a great help and lower the entrance level of understanding so more people “get it”. I see you already have portions of these in the list of links at the top, but they’re not really that visible and don’t hit a home run with the acronymns. This is just a suggestion on my part, something to consider. I’d love to see a chart of the number of hits per day over time on you page. I’m sure it’s looking like your CO2 chart!
Again, excellent work here Steve/Tony. I have profound admiration of your work and efforts and only want to harness this as best I can so I can be more effective in spreading the word.
All the best to you!
“Our algorithm is working as designed”
That statement could be perfectly true; i.e. it’s generating exactly the results they want. That the results do not match reality appears to be inconsequential to them.
As a further cross-check, has the USCRN data ever been subtracted from USHCN? This would clearly show the degree of error in the adjustments. It would also basically be irrefutable evidence… Zeke, Mosher, etc., could no longer use the argument that their adjustments “improve” the data. (Assuming there were substantial differences.)
So they have done an upward death spiral thats a selfplaying piano…and they publish this as offical tempreadings …thats kinda illegal,criminal,unconstitutional,big fraud, n stuff like that…its time to take the algorythm choir to court…must be a way or twelve here ??
Under the current administration??? Seriously???
I’m not holding my breath. They prosecute Amish-men who snip beards, yet allow the banking crooks to go free. In that kind of twisted “justice”, the climate charlatans are heroes to the laughingstock-in-chief.
But your Dear Leader hasent taken full “liberal” control over all the judicial system yet has he ? ..I live in Sweden so living with untouchable bureucrats Im born with..but US …You still have some courts thats dissends havent you ?
There are fewer and fewer… and sadly, very few at all in the higher levels.
Okay let’s make this a scientific.
Hypothesis: The USHCN raw temp data set is adjusted using CO2 concentrations to arrive at a USHCN final temp data set.
Implications of the hypothesis: Fraud exposed. Looks very bad even done by a “few rogue employees” at NCDC.
Prediction: The raw USHCN data set will soon become non-public information, i.e. hidden. Then blamed on a few rogue employees.
Rationale: The current Obama administration just makes inconvenient data disappear. Those Lois Lerner emails on her IRS computer hard drive amazingly just disappeared along with hard drive “crashes” on other co-worker computes, including the Chief of Staff to the Commissioner.
Here’s how the President and The Economist magazine view these facts:
Mr Obama: And the same I think goes for a whole range of other issues like climate change, for example. There aren’t any corporate CEOs that you talk to at least outside of maybe—no, I will include CEOs of the fossil-fuel industries—who are still denying that climate change is a factor. What they want is some certainty around the regulations so that they can start planning. Given the capital investments that they have to make, they’re looking at 20-, 30-year investments. They’ve got to know now are we pricing carbon? Are we serious about this? But none of them are engaging in some of the nonsense that you’re hearing out of the climate-change denialists. Denialists?
Eric Schultz (deputy press secretary): Deniers.
The Economist: Deniers.
Mr Obama: Deniers—thank you.
The Economist: Denialists sounds better. (laughter.)
Mr Obama: It does have more of a ring to it.
So the point, though, is that I would take the complaints of the corporate community with a grain of salt. If you look at what our policies have been, they have generally been friendly towards business…
http://www.economist.com/blogs/democracyinamerica/2014/08/barack-obama-talks-economist
Wow, Debt Bro seems to have a rotten old time with the sh*trag!
I checked, the quote really is on the Economist webpage – couldn’t believe it, thought you were making it up. Thanks for the link.
GEE, Obummer didn’t bother to talk to SHELL OIL Execs did he?
A Shell Oil President, Marlan Downey, “Former President of the international subsidiary of Shell Oil, founder of Roxanna Oil; former President of Arco International” is on the Advisory Board of Richard The Liar* Muller’s consulting firm, Muller & Assoc.
Ged Davis, the Shell Oil VP who wrote the Sustainability Scenarios for the IPCC shows Shell Oil’s vested interest in the “Sustainable Development (B1)” part of the February, 1998 Climategate e-mail which asks for comments on the attachment: “Draft Paper for the IPCC Special Report on Emissions Scenarios” by Ged Davis
To quote from the Sustainable Development (B1) section:
You must be kidding. To the extent that our policies are ‘business friendly’, that only seems to be the case for corporate cronies, aka government agencies.
Temperatures in Australia are at near record lows. Where would they be if UHI were accounted for correctly?
https://au.news.yahoo.com/a/24623580/adelaide-wakes-to-its-coldest-august-morning-in-126-years/
Reblogged this on cosmoscon and commented:
The AGW cult has tampered data to the point that it is criminal. There is a reason why only their data sets show warming but untampered satellite data show no warming for the past 17 years.
Criminal was several years ago…this is way beyond criminal, now.
Coup d’etat?
I’m just curious. At what point does “tampering” become criminal? If I tamper with my tax return data, at what point is it criminal? If I tamper with my bookkeeping, at what point does it become criminal?
I think for me, the clarity here is “tampering” … ANY tampering is criminal!
So where is Watts ??? Where is McIntyre ??? Where is Judith ??? Where is Roger ??? Where is Jo ??? Where is Roy ???
One hopes that they are just checking their ammo before jumping in to the fight.
One hopes.
Are you kidding me? … Those folks are all facilitators … They’re not going to do anything that could possibly lead the the demise of their proverbial gravy trains … give me a break…
Looking around and realizing that what they are standing in has a rather foul odor and is getting deeper by the minute.
And in other breaking news, a new climate change study shows that climate change is so powerful it can cause the climate to stop changing.
‘Hiatus’ in global warming caused by Atlantic Ocean’
“The warming of the Atlantic Ocean created high pressure zones in the upper atmosphere over that basin and low pressure zones close to the surface of the ocean, resulting in the wind increases.”
http://theconversation.com/hiatus-in-global-warming-caused-by-atlantic-ocean-30089
More Hot Air from the Climate Experts. They seem to specialize in it.
‘Hiatus’ in global warming caused by Atlantic Ocean’
Notice that oceans or other natural forces may cause the ‘hiatus’ but may never have caused warming in the first place. In the 4 Billion year history of the planet there was never any warming before man-released CO2 did it starting in the 1950s. Well, at least that is the Team’s story and they are standing by it.
No no, the official story is there were two completely different kinds of warming: one caused by natural effects which happily went about its business since the dawn of time… and then, for no particular reason, just stopped doing anything. At that point a whole new kind of warming caused by humans and CO2 took over.
Only a true climatologist can tell one from the other.
+++brilliant
http://www.newsli.com/2014/08/03/washington-post-obtains-leaked-memo-giving-away-democrats-extreme-weather-talking-points-on-global-warming-budgetary-impact/
Plotting CO2 vs temperature only shows correlation. If you want causation you need to plot temperature vs dollars wasted from the public purse.
That isn’t what the plot is. Perhaps you should read before you comment?
Steve, have you looked at the 2 Graphs that Zeke created using Raw Actuals, they are
https://wattsupwiththat.files.wordpress.com/2014/06/goddard-and-ncdc-methods-1895-2013.png
http://rankexploits.com/musings/wp-content/uploads/2014/06/Averaged-Absolutes.png
They don’t look anyhting like the slow steady trend you would get with a slow steady rise in CO2 do they?
They are trying their best to make the temps fit the CO2 trend and mann’s Hockey Stick.
Zeke captures the magic of infilling with 45% imaginary data.
can steven or someone tell me the justification or how the USHCN adjustments are calculated?
has the al gore rhythm been analyzed or anal-ised? or are we asked to accept the adjustments on faith?
There isn’t any. They don’t even know what they are doing.
https://www.youtube.com/watch?v=11Ee02WLxGk
Propaganda never stops…
https://plus.google.com/u/0/102904770762217826123/posts/hcLbMezj6HE?pid=6043724968319616882&oid=102904770762217826123
Why is NOAA still worrying about run-away global warming, wierding, whatever? Didn’t Team Zero recently take credit for global tranquility?
This is another post that lays it out plain and simple that the government data sets are now just acts of fraud and propaganda. And yet there seems to be little concern on the part of the public. There seems to be little concern even on the part of the activist skeptics. I wonder why that is. Is this too plain and simple? Would everyone prefer some complicated and unforeseen mistake on the part of the minions of the state?
You know I’m afraid the public accepts lies and are quite happy with it. It’s only a few seemingly odd people who have long enough memories to remember things like integrity and truth, that’s why we’ve railed against the AGW shrill propaganda agenda. Now we all agree there’s been some warming and we all agree that Co2 is a GH gas but I’ve got to the stage I’m so fed up to the teeth of the whole stench around AGW that I would not care less if it did happen. For me science of the 20th century has become a religion in itself, people like Dawkins are worshipped and the so called known science is now irrefutable and worthy of worship. I heard Radio 4 ‘infinite monkey cage’ yesterday afternoon as I drove home and oh boy Brian ‘pretty BBC boy’ Cox and right on Robin Ince talk in left wing proclamations of knowing everything there is to know, with almost an arrogance as they’ve been cloned on the university conveyor belt. There seems to be a remarkable amount of warmists like Cox, Mooney, Cooke all you know it all young rock ‘n’ roll dudes who know it all
All of course have no shadow of a doubt about AGW and that the holy rules of ‘consensus’ science are written forever. This are such arrogant , pop posing times for science, I mean even that twat Russell Brand is a scientist now.
There are innocent explanations of apparent correlations such as this.
For example, any 2 unrelated quantities that both just happen to vary approximately linearly with time can be made to appear related by plotting one against the other. In fact, I think the rule is that any 2 quantities with approx the same time variation can be made to appear correlated by a plot such as the first one shown above.
So, the question is (assuming there is no deliberate fraud): why does the temperature correction have roughly the same time dependence law as CO2 concentration?
Whats the odds for that innocense ? Less then struck by lightning twice in clear wheather i think.
Obama is busy promoting new markets in Africa now. Did even ONE “journalist” ask about the climate change conflict of interest in that effort?? Nope.
Even greentard Mayor Bloomberg was on PBS, and they all had global warmnesia. http://www.pbs.org/newshour/bb/u-s-africa-summit-resets-focus-tapping-burgeoning-markets/
Expect lip service to greentard voters about how they’ll make Africa the next Asia without fossil fuels.