
Red shows ice loss over the last three days, green shows gain. Melt has almost stopped for the summer.
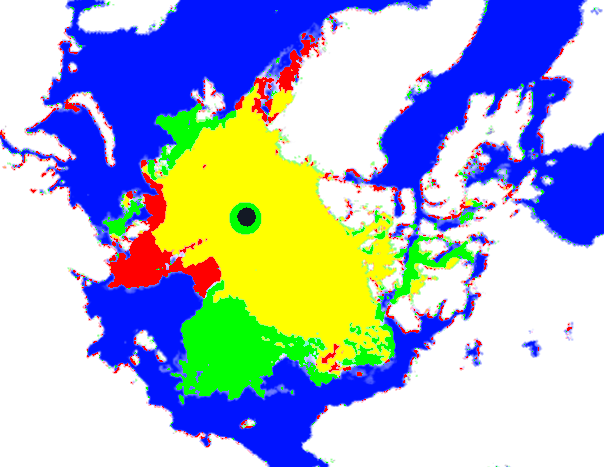
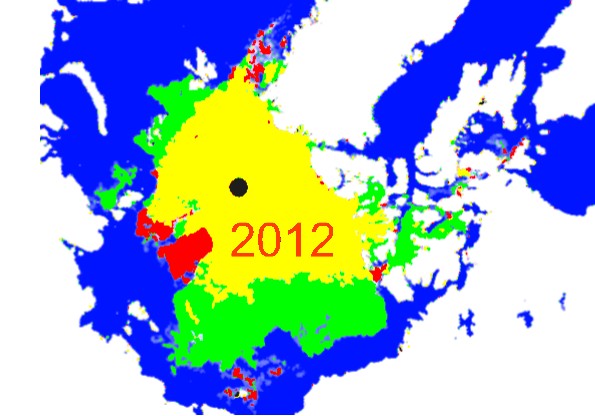
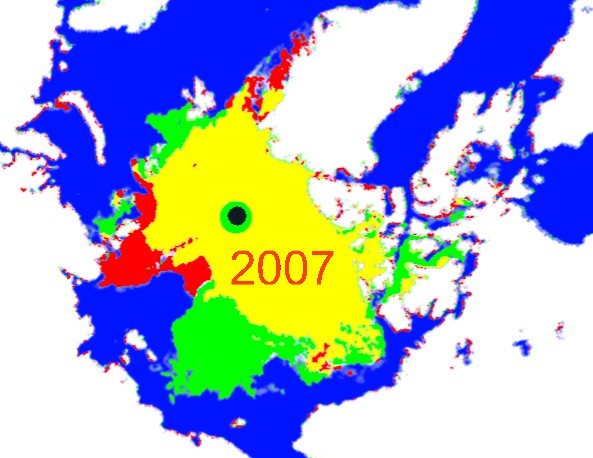
The next two maps show the increase in ice since 2007 and 2012
Red shows ice loss over the last three days, green shows gain. Melt has almost stopped for the summer.
The next two maps show the increase in ice since 2007 and 2012

Steve,
have you seen this?
http://notrickszone.com/2014/08/21/piomass-data-analysis-unparalleled-3-sigma-low-arctic-sea-ice-melt-in-july-lowest-on-satellite-record/
July is a very important month during the melt season: In the Arctic the sun shines 24 hours per day, irradiance there exceeds that of the tropics as a result. The sun is also high above the horizon and so only about 15% of the sun’s radiation in the water is reflected. The open water absorbs large quantities of energy, which can melt the ice from the side and from underneath. And this year something completely unusual happened: while since 1979 approx. 6500 km³ melted in July, this year only 5100 km³ melted.
Wait for the GISS adjustment.
… and the adjusted sea level rise from the “record” melt.</sarc>
And I’m almost certain the swine are playing with the algorithms for the water on sea ice that they used to use in early summer but now is played with multiple times through the year so the data stays on the death spiral promote.
My guess is that it was a lot cloudier. It sure looked that way, subjectively watching through the cameras up there.
Interesting that this effect seems to be compensating for the relatively high intensity of solar radiations in comparison with the same period of 2013. The ice extent data (e.g. from DMI) shows 2014 almost repeating 2013, even in the NP temperatures.
The possible cause of this phenomenon could be greater cloudiness, as Caleb said, and I’d add the quick flip of the AMO into negative mode for a few months, while in 2013 it was always positive.
I will repeat myself. Storms, ocean currents, the current phase of ocean oscillations have every thing to do with the quantities of sea ice. All of these things change and so does the quantities of sea ice.
“The next two maps show the increase in ice since 2007 and 2012”
The next two links show the decrease in ice since 2007 and 2012:
https://www.youtube.com/watch?v=s4VTWEVvkIU
http://www.climate.gov/news-features/understanding-climate/2012-state-climate-arctic-sea-ice
The next two links show the decrease in ice since 2007 and 2012:
Now that’s just funny!!!
pesce-fetente has done some quick google-fu without comprehending the results!!!
Read the date of that report….. July, 30 2013 and reporting on the 2012 Arctic season.
Now, pesce-fetente, please check the current date. Unless I miss my guess, you might discover that it is now 2014. And 2014 is the Arctic melt season being discussed…
With a fail like that, you should hang your head in shame and turn-in your white troll belt.
We’ll miss Fish when classes start for 8th grade. (Maybe he will pass this time.)
Shazaam! You are a turkey! It’s your reading that’s sloppy! I checked the dates carefully so they would exactly correspond to Steven’s dates. You didn’t notice Steven’s maps, 2 & 3 are dated 2007 and 2012 respectively. You probably didn’t notice either that if you compare the yellow portion only of the two maps that Steven provided the 2012 map shows less cold ice extent than the 2007 map.
So what’s really funny is you thinking you “got me” when it was you who failed to read the post carefully. You didn’t notice that Steve’s map show a decrease in ice extent from 2007 and 2012, or that my links show the same decrease or that the time periods were chosen to be the same. SHAME, SHAME SHAZZAM!! I suggest you post a “selfie” of yourself with your foot in your mouth.
And if you read carefully, you might notice that Toto nor I claimed that 2012 was a larger extent than 2007. Your reading comprehension needs some serious work.
The point of Toto’s maps pesce-fetente, was to show the increase in extent in 2014. Toto choose 2012 and 2007 as recent minimums to compare against.
I suppose you will now attempt to claim that there is less ice in 2014 than either 2007 or 2012?
You are starting to make fence posts look intelligent by comparison with yourself…..
(Note that is not considered a good thing to most trolls.)
More childish ad hominems. I stopped reading as soon as it was evident the level of discourse contained within the comment was on a 3rd grade level.
2nd link: https://www.youtube.com/watch?v=s4VTWEVvkIU
“In 2012, summer minimum sea ice extent was recorded at 3.41 million square kilometers: the lowest of the satellite era, and 18 percent lower than in 2007, when the previous record of 4.17 million square kilometers was recorded.”
http://www.climate.gov/news-features/understanding-climate/2012-state-climate-arctic-sea-ice
The point here is that Ice Extent in 2014 shows substantial increases over the extents in 207 and 2012.
Nobody is doing a direct comparison between 2007 and 2012. These years are both included as previous minima.
These comparisons are important because they provide a priori evidence that the “Arctic Death Spiral” is neither as deadly nor spiralicious as the AGW clairvoyants have predicted.
2007. I have no idea what the ice extent was in the year 207.
The point is that in the first 100 days of 2014 the Artic was in the midst of a heat wave. Then by April a cooling began which lasted until now. All it means at this point is that the spiral has been temporarily halted.
Oh that is rich…… Yes the average temperature was warmer than normal.
I’d love to see you sunning yourself in a swimsuit in such a “heat-wave”. (you’d quickly become a “pesce-fetente-cicle”)
Those “heat-wave” temperatures were still well below the freezing point.
As in, there was lots of ice formation in the midst of your “heat-wave”. And thus 2014 has lots more ice despite those ever-so-torrid winter “heat-wave” temperatures.
Have you considered taking your act on the comedy circuit?
The point is you are 180 degrees off. The Arctic was not in the midst of a heat wave. It was sending record cold down to North America. So at BEST you can say this is not a record cold year! And that is if you ignore the snow in the southern hemisphere in areas that it is rarer than hen’s teeth.
From –
Arctic decadal and interdecadal variability Igor V. Polyakov International Arctic ResearchCenter, University of Alaska Fairbanks
Mark A. Johnson Institute of Marine Science,University of Alaska Fairbanks
GEOPHYSICAL RESEARCH LETTERS, VOL. 27, NO. 24, PAGES 4097-4100, DECEMBER 15, 2000
Their Conclusions
The recent retreat of arctic ice requires understanding an of whether the ice reductionis a persistent signature of global warming due to anthropogenic impact on climate or it is a minimum of a low-frequency natural climate oscillation.
Numerical models Earth climate system of [Vinnikov et al., 1999]and direct observations [Rothrock al., 1999] show substantial ice decline in the recent decades. Vinnikov et al., suggested that the observed decrease of arctic ice extent is related to anthropogenic global warming. However, Vinje [2000]using observations over the past 135 years showed that the recent decrease in ice extent in the Nordic Seas is within the range of natural variability since the 18th century. A combination of century- and half-a-century-long data records and model integrations leads us to conclude that the natural low-frequency oscillation (LFO) exists and is an important contributor the recent anomalous to environmental conditions in the Arctic. This mode of oscillation is related to fluctuations in the thermohaline circulation in the North Atlantic [Delworth Mann,2000]. Comparison of the century-long NAO index time series and half a century time series the polar region of SAT,SLP differences, wind vorticity and index shows existence the the of LFO mode in the latter time series. There is evidencethat the LFO has a strong impact on ice and ocean variability. Our results suggest the decadal and multidecadal that AO LFO drive large amplitude natural variability the Arctic in making detection possible of long-term trends induced by greenhouse warming gas most difficult.
(my bold)
Steve/Tony
My comment is awaiting moderation?
Thanks 🙂
By looking at Steve’s comparative graphs above and NORSEX “analysis”,
http://arctic-roos.org/observations/satellite-data/sea-ice/observation_images/ssmi1_ice_ext.png
it’s clear that there is something very, very wrong with the NORSEX model code.
Looks like the race isn’t over. 2014 is back swimming in the same league as 2007 and 2012.
You can’t possibly be as dumb as you pretend to be.
I wouldn’t place any bets that pesce is smarter than the average fence post. (i.e. marginally smarter than the fabled purple turnip)
In the battle of smarts you are losing with every dumb comment you make.
No, you already lost with every petty pejorative you post.
Yes he can be.
He clearly hasn’t watched these metrics with any regularity if he thinks that the one-day 2014 dip on NORSEX means 2014 is anywhere close to 2007 or 2012. Ignorance at its best.
-Scott
Each warmist camp probably quit calculating the extent a few years ago, and they just draw the line where they want it.
“And if you read carefully, you might notice that Toto nor I claimed that 2012 was a larger extent than 2007. Your reading comprehension needs some serious work.
The point of Toto’s maps pesce-fetente, was to show the increase in extent in 2014. Toto choose 2012 and 2007 as recent minimums to compare against.
I suppose you will now attempt to claim that there is less ice in 2014 than either 2007 or 2012?”
Well little magic man, in your auto-erotic little circle, I was not referring to YOUR claims in my comment but to Toto’s if by “Toto” you mean Steve. You again lost concentration. But that’s OK….stroke away.
Also, less than C student, I did not quarrel with the 2014 map which shows the 2014 INCREASE in extent. I accept that as I accept that the summer here on the east coast has been much cooler than average, and in the Midwest, and all the areas of the earth that were below normal this year. But unlike you, a denier, I also am aware that there have been plenty of areas on land and sea that are above average.
So now for a second time you have failed YOUR reading comprehension in your eagerness to criticize mine. That’s a dopplefutmouther….
Fish, is it possible you are so intent in finding “cherries” to pick you have become entangled in your own nonsense?
That happens often with Warmists….
Another worthless childish insult filled post. I guess when you have nothing to say, you just spew ad hominems.
It’s exceedingly rare in our cynical age to pledge allegiance to a cause larger than life and dedicate all of one’s wits to the betterment of man. Carry on earnestly, pesce.
Little Magic Man sez: “Oh that is rich…… Yes the average temperature was warmer than normal.
Those “heat-wave” temperatures were still well below the freezing point.
As in, there was lots of ice formation in the midst of your “heat-wave”. And thus 2014 has lots more ice despite those ever-so-torrid winter “heat-wave” temperatures.”
Did you have to look that up, little man?
I think it’s comical that you make stupid assumptions.
Do you geniuses actually believe that talking will melt the ice?
Al Gore, John Kerry, Hanson and several others sure did when they declared that the Arctic ice pack would not longer exist or at least the NW passage would be open for navigation by now. I wonder who here believed them then and still now cannot recognize the forest for the trees?
Did the mule kick you in the head when you tried to poke him?
“Shazaam” refers to an exclamation of discovery, not “abracadabra”. Which is probably what you were thinking.
And still with the infantile insults and juvenile pejoratives. You should sue the mule.
Perhaps a little kindness is in order. Given the quality of pesce-fetente posts I’ve seen to date. I suspect that pesce-fetente is just not capable of doing better.
You are expecting to much.
And, I’ve come to associate those infantile insults and juvenile pejoratives with this particularly inept CAGW acolyte. I wouldn’t recognize the intellect behind those handles any other way.
I have come to expect them from any alarmist acolyte. But he “tried” to present himself as a rational person. But as we see, that did not last very long as soon as he was harpooned, out comes the juvenile delinquency.
“Shazam” is what little Billy Batson said that transformed him into Captain Marvel. It is used interchangeably with abracadabra.
Only for a child. Captain marvel was not magical either. But then I guess you never got that far by just looking at the pictures.
A comic-book reference. Color me surprised…..