Disrupting the Borg is expensive and time consuming!
Google Search
-
Recent Posts
- Gaslighting 1924
- “Why Do You Resist?”
- Climate Attribution Model
- Fact Checking NASA
- Fact Checking Grok
- Fact Checking The New York Times
- New Visitech Features
- Ice-Free Arctic By 2014
- Debt-Free US Treasury Forecast
- Analyzing Big City Crime (Part 2)
- Analyzing Big City Crime
- UK Migration Caused By Global Warming
- Climate Attribution In Greece
- “Brown: ’50 days to save world'”
- The Catastrophic Influence of Bovine Methane Emissions on Extraterrestrial Climate Patterns
- Posting On X
- Seventeen Years Of Fun
- The Importance Of Good Tools
- Temperature Shifts At Blue Hill, MA
- CO2²
- Time Of Observation Bias
- Climate Scamming For Profit
- Climate Scamming For Profit
- Back To The Future
- “records going back to 1961”
Recent Comments
- Bob G on Gaslighting 1924
- John Francis on “Why Do You Resist?”
- conrad ziefle on Gaslighting 1924
- Bob G on Gaslighting 1924
- Bob G on Gaslighting 1924
- Bob G on Gaslighting 1924
- conrad ziefle on Gaslighting 1924
- Bob G on Gaslighting 1924
- Bob G on Gaslighting 1924
- arn on Gaslighting 1924
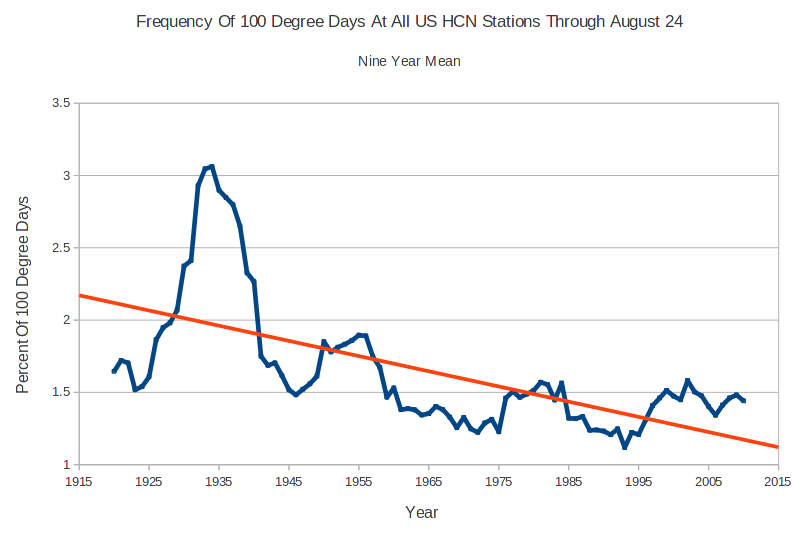
Frequency Of 100 Degree Days In The US Down 50% Over The Past 90 Years
This entry was posted in Uncategorized. Bookmark the permalink.


Keep hammering away, telling ’em once won’t get the job done.
yep, -2 c in aviemore in scotland two nights ago, the cooling has begun.
Not exactly catastrophic warming.
We are working with the same information that was produced on the Cray 1s. The original models were terribly unstable and do not seem to represent observed data in the multiple thousands of years climatic stability in the 750,000 years of the Law Dome, Vostok, and Greenland Ice core data. The climatic instability of the models on the 10,000 year scale is at odds with the actual observations. In scientific method this requires rejection of such a model as invalid. Why are such obviously bad models accepted as truth?
When the gloal warming models were introduced, supercomputers (Cray 1S) were used to produce the models. At the time people who worked on the models said minor tweaks would set the models in widly different directions producing a Venus like atmosphere or a global Ice Ball. I was working at the Physics department of the Airforce Institute of Technology(AFIT/ENP) and had access to a Cray 1S at the time. The old adage GIGO (garbage in garbage out) predominated among programers. Unstable systems to explain stable observations reeks of political agenda.
Ubstable models to explain stable systems is absurd. The acceptance of an absurd model on obsolete computing systems has only one conclusion these people have another political agenda; to control you through fear uncertainty and doubt.
+1
Well said.
“Why are such obviously bad models accepted as truth?”
Depends on your definition of “truth”. There’s definitely way too much confidence in them; there should be zero, especially given their spectacular mismatch with reality.
Anyone who asserts that a computer can usefully model an effectively infinitely large non-linear feedback-driven (where most of the feedbacks are unknown and of even the signs of the ones that are known are unknown – worse, often subject to periodic change) that exhibits all the symptoms of chaos such as a tendency to bifurcation and extreme sensitivity to initial conditions is either a climate scientist or a computer salesman, and that’s before we even mention butterflies.
Very nice!
Until they adjust them for station moves that never happened.
Like this one?
It has supposedly moved about 3 miles, in the past 50 yrs or so. This is primarily a river guage with a weather station tacked on, so it may not be perfect in terms of siting…but it ain’t easily moved.
http://water.weather.gov/ahps2/images/hydrograph_photos/belw2/BELW2Wellhouse.jpg
I forgot…that was in 7 incremental jumps…and Google Maps currently shows its location on a hill (slightly to the left of the station) about a 1/4 mile from the river.
I think they’re washing the latitude and longitude numbers through the same statistical filters that they’re using on the temperature data.
I can account for 4 of the moves…1 was switching from topo map generated coordinates to GPS…and the other 3 were GPS related…but 3 of the others no idea.
And the scary thing is, they just spent a huge amount of money in this county redoing the 911 system and basing it on GPS coordinates….if the track record with a rather immoveable river guage is anything to go by, what happens when you dial 911?
The data whackers (who bang down peaks) can’t keep up.
Whack-A-Temp?
…..And the scary thing is, they just spent a huge amount of money in this county redoing the 911 system and basing it on GPS coordinates….if the track record with a rather immoveable river guage is anything to go by, what happens when you dial 911?
>>>>>>>>>>>>>>>>.
In my case they end up on the wrong side of the river.
We tell everyone DON’T use GPS to find us. You will get lost.
Very true. You’d do better with a sextant and a watch :P.