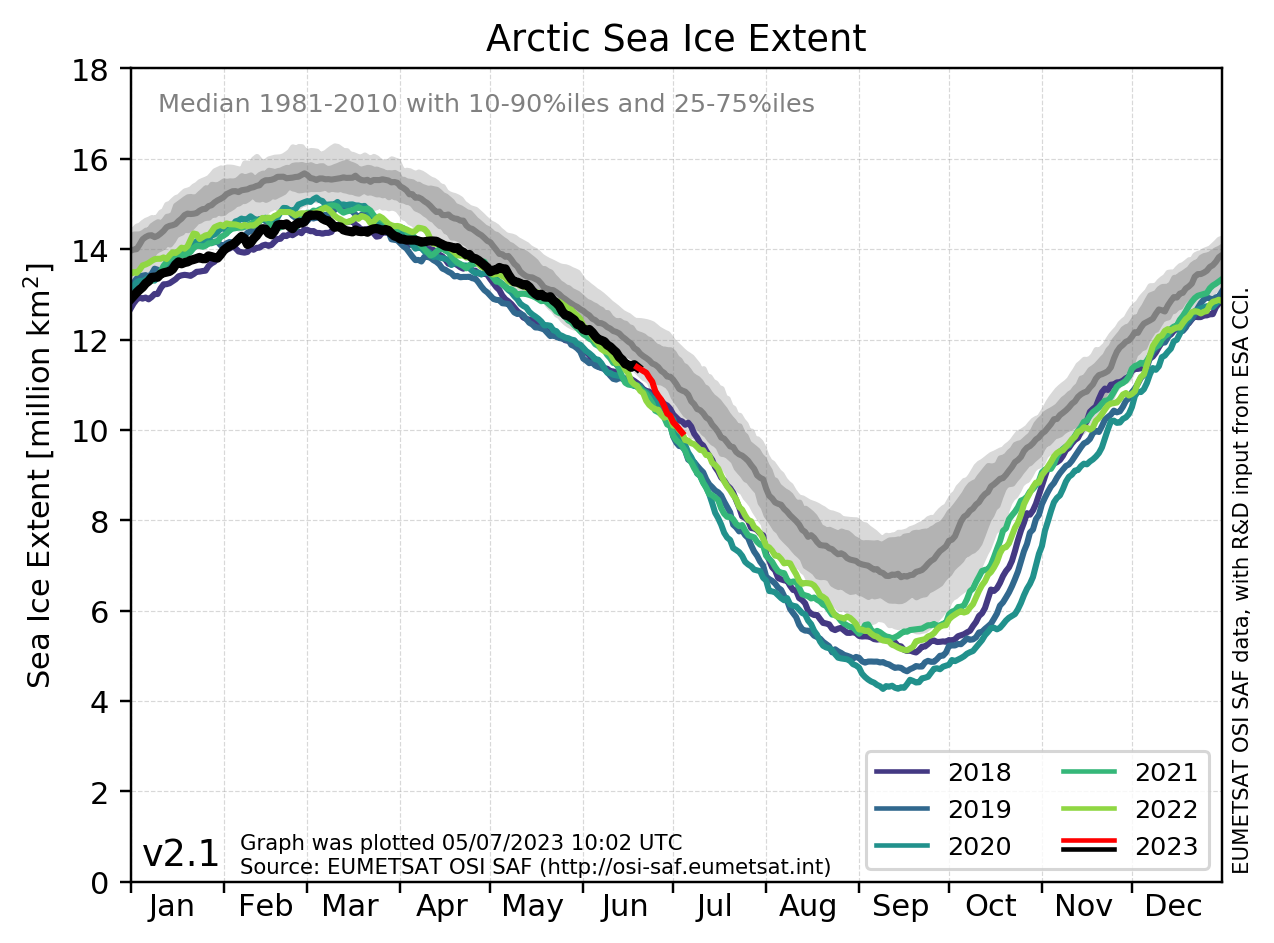
Arctic ice extent will continue to decline for a couple of days, then a cyclone near the North Pole will begin spreading the ice, and the extent curve will turn back towards the median.
The minimum this summer will likely be close to the 2006 minimum, which was the highest minimum of the past decade.


Unless Mark Serreze restars the global tumble drier and sticks it on Death Spiral.
Failing that government agencies will adjust all the figures.
I think it is closest to last year at the moment, not going to predict the summer minina, can’t tell what it will be.
Andy
My latest Arctic forecast is more short term than yours Tony, and rather more precise too.
http://stevengoddard.wordpress.com/2014/07/30/shock-news-breathtakingly-ignorant-deranged-blogger-batting-1000-this-summer/#comment-398196
“CT area decline of around 180 k over the next two days”. I guess that equates to “CT Arctic sea ice area will reverse and then decline for a couple of days”?
You do have a working knowledge of English. Congratulation!
Thanks for your kind words DedaEda, once again.
A new month means some masks have changed, so the GWC patent pending crystal ball is cloudier than usual. Undaunted the CT oracle hoarsely whispers “Expect a couple more 100 k declines next. Around 225 k in total”
144 k down today. 81 k to go. All to play for.
This is your last warning.
Pardon me?
You don’t approve of people posting their own Arctic forecast on a thread entitled “My Arctic Forecast”?
Have I got that straight Tony?
The minimum this summer will likely be close to the 2006 minimum
That will be huge if that happens.
Break out the bubbly!
Gutsy to go with a forecast, but then the great ones risk it to gain the glory.
Many thanks for your kind words Phil.
CT Area has just come in at 44,288 square kilometers below yesterday. The “turn on the proverbial dime” has come to pass, and there is only another 135,712 to go!
CT doesn’t measure extent. This post is about extent. Stop being a moron and wasting my time.
Whoops! The decline was a mere 129,850 🙁
Progressives think continuing to talk will save them from the disaster they face.
regardless of 2 and 3 day predictions…the ice is doing spectacularly well this year! i am looking t the 30% graph and keep being surprised.
http://ocean.dmi.dk/arctic/icecover.uk.php
That link is to the 15% threshold DMI extent Mark. This one is to the extent graph of my so called “Japanese friends”:
http://www.ijis.iarc.uaf.edu/en/home/seaice_extent.htm
Tony didn’t want to play “spot the difference” with me. How about you?
I do appreciate you demonstrating so graphically the dissonance and dishonesty of climate alarmists

The pleasure is all mine Tony.
I’ve asked this before without receiving an answer, but is there any way for commenters on here to include an image?
Failing that is there any way you might be willing and able to display the graph at my JAXA link here?
The Jaxa graph uses coastal masking so comparing it to the above graph is not worth it.
Using the DMI graph that does use masking, the JAXA graph actually shows MORE ice, overall…
Why is taking a look at it “not worth it”? Why is the JAXA graph any better or worse as a measure for Arctic sea ice extent than the DMI graph? I agree comparing one directly with another doesn’t necessarily prove a whole lot, but why not compare JAXA 2014 with JAXA 2006 for example?
Can you specify error bars Tony, instead of “likely be close”?
Which particular flavour of extent metric are you referring to by the way? As has been discussed above and elsewhere recently, there are an awful lot of them!