
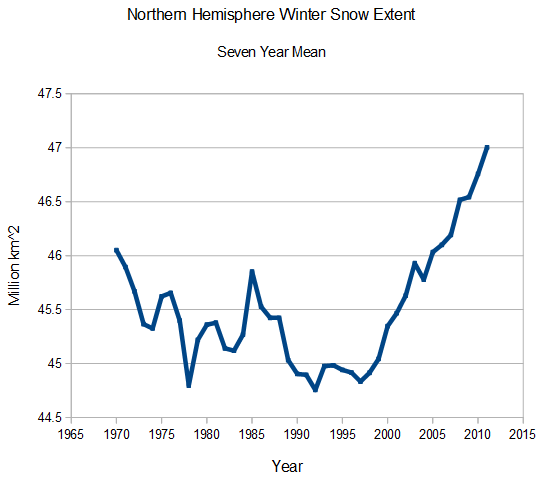
Northern Hemisphere winter snow extent is going through the roof, due to Arctic air pushing further south.
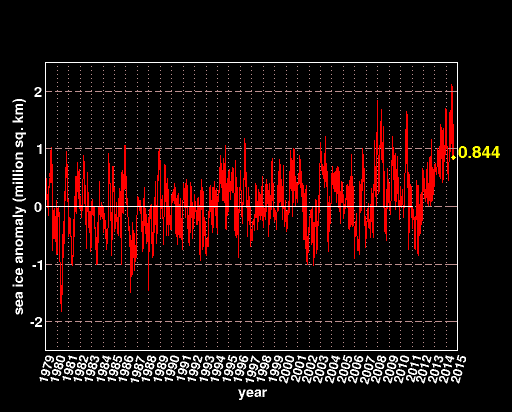
Antarctic sea ice extent is going through the roof
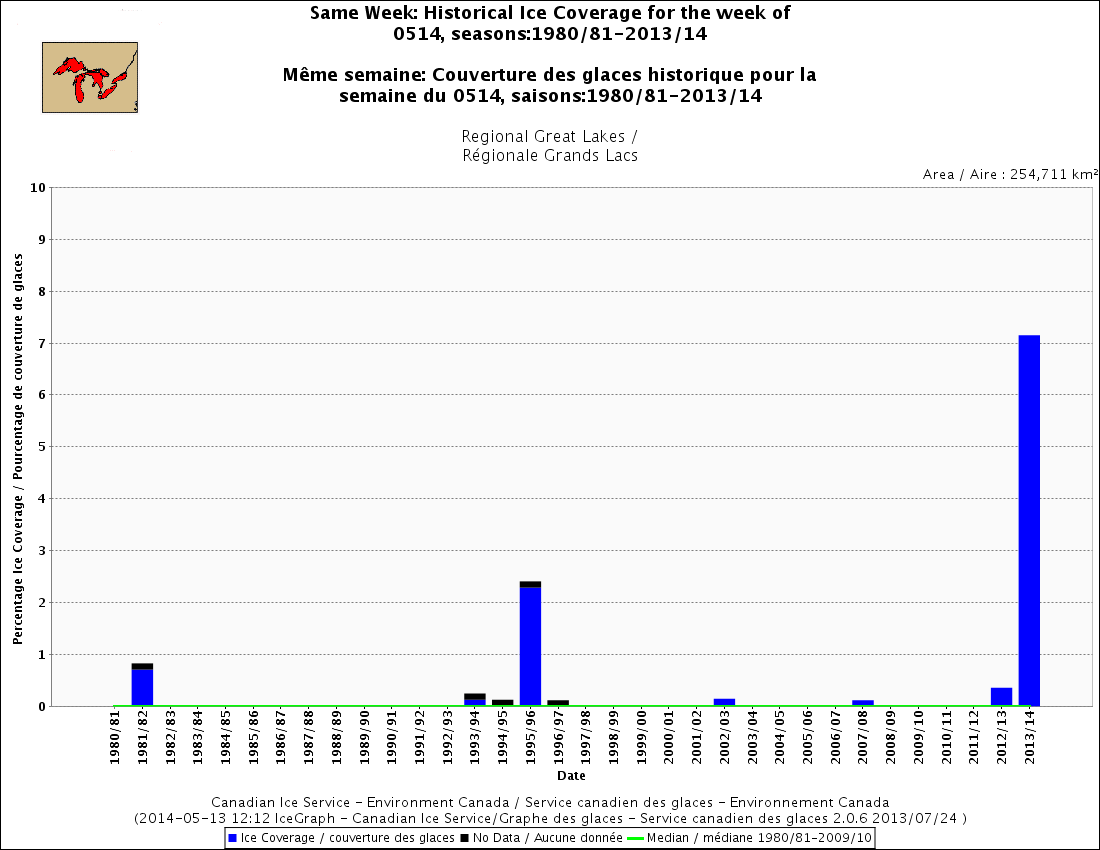
Great Lakes spring ice cover obliterated all previous records.
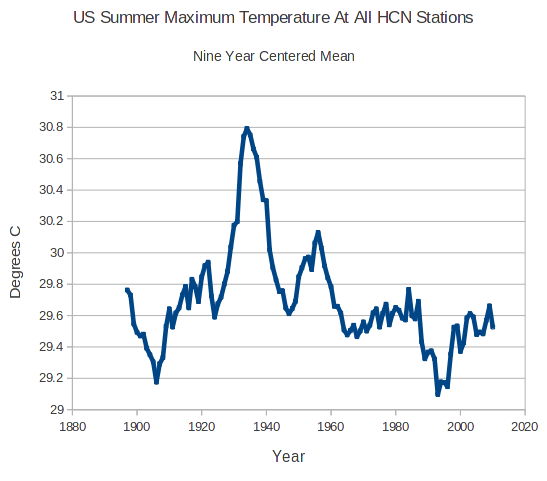
US summer temperatures are plummeting
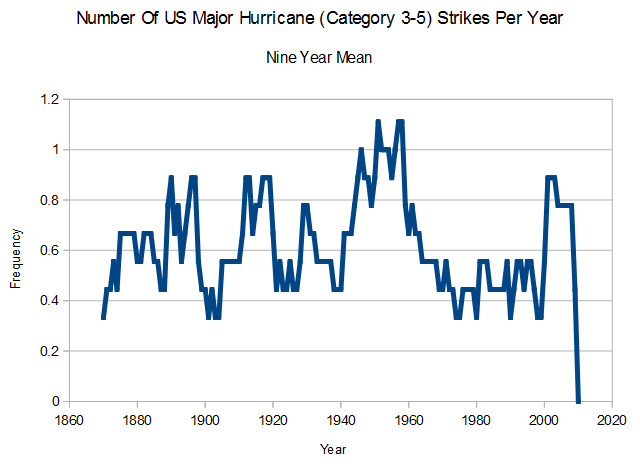
US major hurricane strikes peaked 60 years ago, and are the lowest on record.
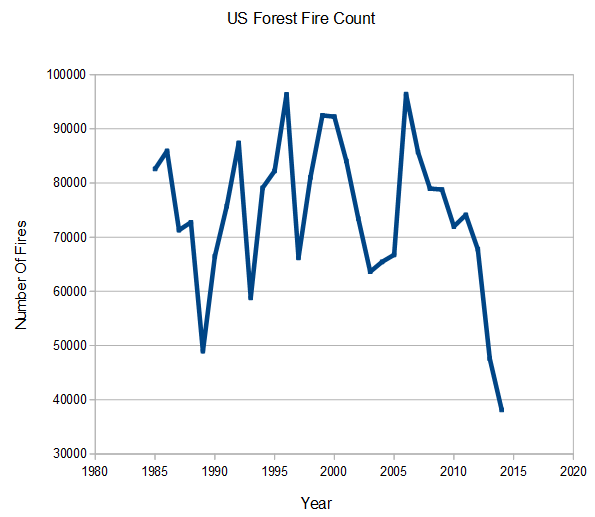
US forest fire count is plummeting, and is the lowest in three decades.
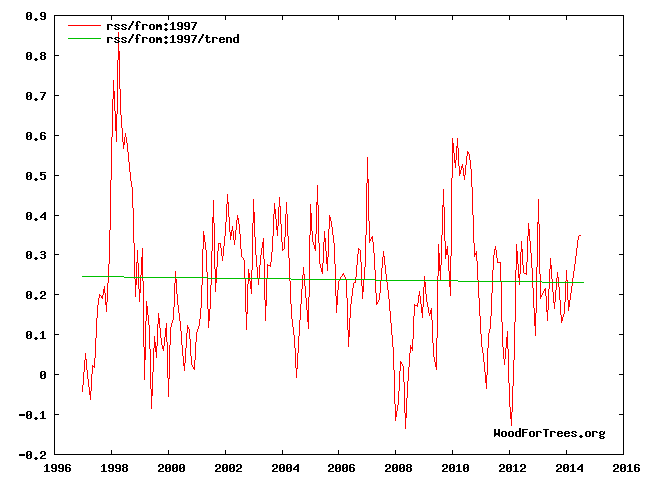
There has been no change in global temperatures during the lifetime of any school child
http://www.woodfortrees.org/plot/rss/from:1997/plot/rss/from:1997/trend
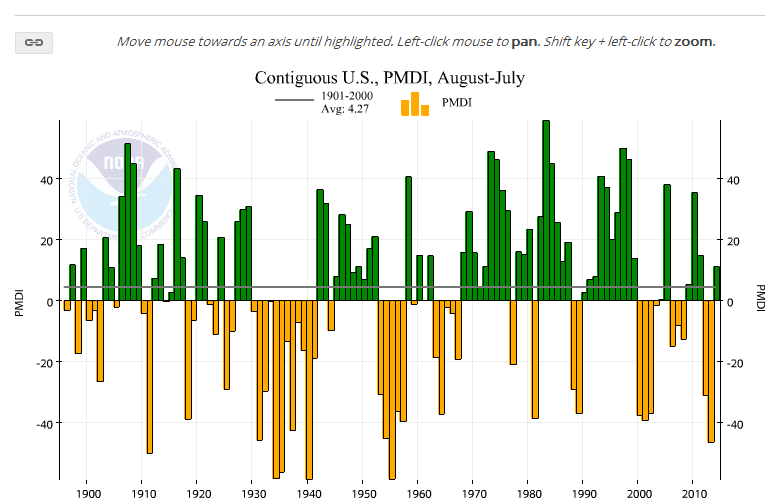
The US is actually wetter than normal over the past year
Climate at a Glance: Time Series | National Climatic Data Center (NCDC)
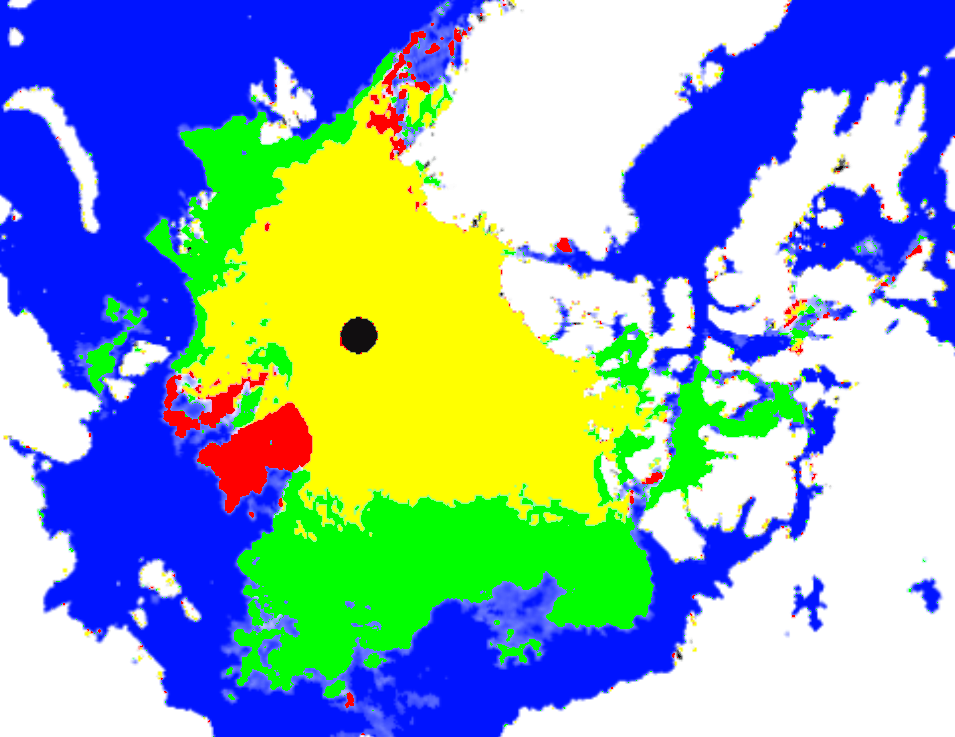
Arctic sea ice has grown by more than 60% over the past two years. Green shows gain since this date in 2012. Red shows loss.
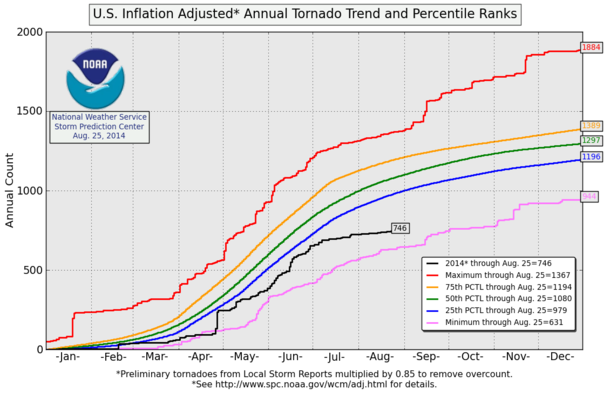
The last two years had the fewest tornadoes on record in the US, and this year is also one of the quietest tornado years.
Pay no attention to all this. Just keep believing the mindless propaganda being spewed by the White House and their minions – which is the exact opposite of what is actually happening in the real world.

The “Warmists” will try to negate all this by claiming it is “cherry-picking”. Well, let’s spend a minute on “cherry-picking”.
The “theory” advanced is that the globe is heating due to AGW, which is caused by CO2 emissions. Soooo, in “real science”, it is the task of advocates of the theory to PROVE it. All Skeptics have to do is present creditable evidence and the theory is debunked. In other words, WE get to “cherry-pick”!
The four graphs above show more ice in SH, more snow and cooler summers in NH, all in the same relative time frame. Combined, they indicate “global” cooling in substantial magnitudes to debunk GW, and consequently debunk AGW, since CO2 levels continue to rise.
(The Warmists must “adjust” historical temps in an effort to support their Bad Science.)
The graphs above amount to a MASSIVE debunk of the AGW “theory”. And, in “real science”, all you need is ONE such debunk.
“No amount of experimentation can ever prove me right; a single experiment can prove me wrong.” Albert Einstein
Of course, their “science” NEVER passed the smell test anyway.
+1
Nice summation.
It is the reason I keep rubbing the warmist’s noses in the fact the earth is two centuries over due for the termination of the Holocene and no one in the last decade has rebutted Lisiecki and Raymo [2005] after they shot down Loutre and Berger [2003.] Their paper also shot down any hope that the Holocene would go long.
Lisiecki and Raymo [2005] produced an exhaustive analysis of 57 globally distributed deep ocean cores reaching back about 5 million years. The paper is a widely referenced landmark paper in paleoclimate science.
This is the perspective. The summer solstice insulation minimum during MIS-11 at 65N was 489 Watt/m2 and it was 474 Watt/m2 in ~2005 (Lisiecki and Raymo, 2005). You need 15 Watt/m2 to get UPto the insolation minimum in MIS-11.
The Intergovernmental Panel on Climate Change [Schimel, 1996] estimated that the change solar forcing between 1850 [start of the industrial age] and 1990 was only •0.3 W/m 2 at the top of the atmosphere vs. 1.5 W/m 2 for forcing anthropogenic CO2 [cf., Reid, 1997]. So anthropogenic CO2 forcing is too small by a factor of ten. So much for Ruddiman’s hypothesis that mankind is keeping the earth out of glacial inception [Ruddiman, W., 2003.].
And that’s granting them, for the sake of their argument, that their premise is correct. What happens if carbon dioxide levels are not a forcing nor a feedback?
A simple real-world observation of my little acre homestead. The late frost of 2013 killed the Oak bloom and no acorns for that year, but Hickory nuts were a bumper crop. This year, the late frost again killed the Oak bloom and this time also damaged the Hickory bloom resulting in no acorns, and a very few severely stunted Hickory nuts. The squirrels have all headed for the deep timber looking for food.
Conclusion: This year winter lasted a little longer.
PS: Corn crops look much weaker due to a very cool summer.
We are in really really deep kimchee.
Ilya G. Usoskin’s A History of Solar Activity over Millennia says:
And then backs up that statement with more than one line of evidence.
The above is in response to cdquarles says:
“What happens if carbon dioxide levels are not a forcing nor a feedback?”
You can also add in that Solar Grand Minimum are linked to increased volcanic activity and probably to more La Ninas and polar vortex- loopy jets.
http://cafe368.daum.net/_c21_/bbs_search_read?grpid=1FBty&fldid=N0WJ&datanum=1898&contentval=&docid=1FBtyN0WJ189820100616141523
(Interesting that the only link left to that NASA article is on a Chinese? Japanese?website)
Thanks, Gail.
Now, can anyone show me where the Professional Climate Scientists actually used the scientific method and do/show work that they’ve done to falsify their own hypotheses/speculations? /rhetorical, but if there are some, please point me to them, for the papers I’ve seen show no such discussion of errors or lines of inquiry that falsify the hypothetical.
For example, take a look at pg.10 of the following work (Jan. 2013)
http://www.leif.org/research/SSN/Svalgaard12.pdf
and the polar fields, lingering around zero “as never before” (no one knows if they behaved similarly during the Maunder or Dalton minimums),
http://www.leif.org/research/Solar-Polar-Fields-1966-now.png
The glacial inception will fatally happen if we enter a new “grand minimum” (of the Maunder/Sporer type)…
OTOH we all know that Leif Svalgaard himself has been collecting proof in the last 2-3 years that this is probably the best explanation of the presently observed anomalies of the solar magnetic fields, both the fields in the sunspots and the polar fields themselves, they’re all behaving *as never seen before*.
Now, all we have to do is add “two plus two”.
IMO, if the grand minimum of the Maunder type confirms during this solar cycle or the next, that should start around 2022 or 2023, we’ll be at LIA temperature levels in the 2030’s, glaciers advancing, etc.
+2
> The “theory” advanced is that the globe is heating due to AGW, which is caused by CO2 emissions.
Essentially, yes. There are other contributors than CO2, But CO2 is the largest single one.
> Soooo, in “real science”, it is the task of advocates of the theory to PROVE it.
Surely this has been done. The relative size of the changes in radiative forcing have are able to be calculated within limits. Clouds throw up some uncertainty, but not so much that we don’t know that CO2 is the big one.
> All Skeptics have to do is present creditable evidence and the theory is debunked.
Sure, if you’ve got “creditable” evidence that the optics of CO2 is different from what has been measured these past 200 years, present it.
> In other words, WE get to “cherry-pick”!
Not to much. The globe is warming. If you could show that the energy balance is in the other direction, you’d have a point. But increased winter snow cover in the USA doesn’t do that. A trend in USA winter snow cover might be slightly related to US temperatures, but not to global ones. We know the global temperatures are rising from temperature measurements. (And sea level rise).
> The four graphs above show more ice in SH
No, more sea ice. The Antarctic ice sheet is losing more mass than that.
> more snow and cooler summers in NH
No, cooler summers in the USA. The USA is only about 4% of the NH. The NH summer has been warming strongly.
There has been more winter NH snow. Increased overall precipitation is expected from global warming.
> Combined, they indicate “global” cooling in substantial magnitudes
No they don’t. To indicate global cooling, you would have to show the globe is cooling, not some 2% of it. The globe is warming.
> Of course, their “science” NEVER passed the smell test anyway.
I suspect your nose is biased.
Essentially, yes. There are other contributors than CO2, But CO2 is the largest single one.
No time to address your entire post but It is hard to think you meant to say the above. Everyone knows that water vapor is the heavyweight in global warming. All other sources are only about 6%. We can’t prove whether the current pause will end in higher or lower temps but the fact that temps are not currently rising should be food for thought.
Rattus, thanks for making my prediction come true!
[[[ The “Warmists” will try to negate all this by claiming it is “cherry-picking”. ]]]
Beyond your “playbook” debate tricks, you mentioned CO2, so here is an important point to consider. The “radiative forcing” of CO2 is Bad Science. A molecule of atmospheric CO2 is NOT a “heat source”. In a system, CO2 can only emit the energy it receives. Assigning a “radiative forcing” to CO2, as the IPCC does, indicates someone does not know what they are talking about, or has some non-scientific agenda. You figure it out.
To illustrate, consider a small rock. The rock has a temperature based on its surroundings. The rock is NOT a heat source. Set the rock in a room at a certain temperature, and after an hour or so, the rock will have the same temperature as the room. A molecule of CO2 behaves the same way. Heat it and it gets hotter. Take the heat away, and it cools. The molecule can NOT add more energy than it has.
The “radiative forcing” of CO2 is just ONE of the major violations of physics by the IPCC.
But… but… Mann-made CO2 has a specific heat 4 or 5 orders of magnitude higher than natural CO2 and as a result can
make energy out of thin air“radiatively force” the rest of the atmosphere, even though it’s several orders of magnitude more massive, to destructive and dangerous temperature levels of, Gasp, 1° or 2°C over thenext51030in the near future and the only way it stops is by taxing all your money away and forcing you to live in a dark, unlit cave and eat grass… but only after the rest of the animals on the planet have eaten their fill… you just get the leftover grass… well not really you can’t endanger the grass so I guess you can’t eat that either. The solution to Mann made global warming is for you to go into a dark cave and die… yea, that’s it. That’s what the UN is doing in Africa right now… see how well it’s working!Sorry bud, but you’ve been brainwashed. CO2 is not the largest. Does it contribute a lot at first? Sure. It does indeed help get the globe to a warmer state than a black body. But CO2 has a logarithmic effect. You need to double the amount every time to get the same effect. We’re well past the point where we can easily double the amount.
Also, water vapour is the main greenhouse gas. Everything else is minor by comparison.
Finally, the globe is cooling. Sorry to burst your bubble, but saying that it’s warming is an out and out lie.
MrX, you’re going in the right direction, but slightly off track.
You state: “It [CO2] does indeed help get the globe to a warmer state than a black body.”
NOPE. CO2 is NOT a heat source. This is the BS put out by the IPCC. A black body flat surface receiving the same solar flux, WITHOUT atmosphere, would reach a temp of about 360K. Earth’s average is 288K.
IPCC needs to explain how Earth, WITH an atmosphere, cools itself long before they try to explain how mankind is “boiling the oceans”.
But, then you redeem yourself:
“Also, water vapour is the main greenhouse gas. Everything else is minor by comparison.
Finally, the globe is cooling. Sorry to burst your bubble, but saying that it’s warming is an out and out lie.”
Rattus “and sea level rise..” Which if true, proves nothing. Seas have risen before, so your job is to prove that they wouldn’t have risen absent man-made CO2. Good luck.
the contribution by CO2 is supposed to increase the optical thickness of the atmosphere. how do you like the hypothesis that as trace atmospheric gases like CO2 and methane increase ,the main atmospheric gas ,water vapour , decreases by a similar amount to maintain optical thickness of the atmosphere ?
James the Elder says:
A simple real-world observation of my little acre homestead….
>>>>>>>>>>>>>>>
My goat bucks has come into season in June/July instead of in September/October for the last two summers. My equines were shedding their summer coats by the 4th of July yet didn’t finish shedding their winter coats until into June for the last couple of years.
Blue light (or perhaps into the UV) has been found to trigger the estrus cycles in mares and make stallions more fertile. Mares do not cycle in winter and the gestation is 11 months. For goats it is five months so I get November kids again this year. Given I am in mid North Carolina and bucks and rams are sterile if the temp is over 90F, I should not be getting babies in November. Not if there was such a thing as Gore Bull Warbling.
Goats! You have GOATS?
In what now seems like another life time I went through “Medlab”.
Medlab was the final of the three phases of medical training to become and SF medic. Your issued a goat patient. We couldn’t call them goats. We had to call the Caprines (short for Capra aegagrus hircus) or “my patient. The goats were there for us to learn trauma treatment and surgery.
Take Temp, Pulse, and Respiration and record them three times a day. Do a physical every day. Three times a week take urine and fecal samples and you do UA and check the feces for parasites. Treat for shipping fever and Orf or what ever else they may have. No ultrasound or glass bulb available to determine pregnancy in the female patients, which mine was. Record and chart everything in patient notes. This went on for 4 weeks as you attend other classes.
We trainees all smelled like goats. Nobody in the messhall by the JFK center at Ft. Bragg wanted to sit near us.
Then comes surgery. You have been trained to fill every standard position in an OR. When your patient is to be shot then your the surgeon. Others fill the position of assistant surgeon, anesthetist, scrub tech, inside circulator and outside circulator.
I won’t go into more detail but the animals were shot in the hind leg and we had to save them using war wound therapy. Then deal with the subsequent infections and what ever else came along.
That course was 8 weeks of no sleep and constant stress. 40 started and 12 of us graduated.
About 5 years ago I was rummaging in the attic through a duffel bag with my old uniforms in it. At the bottom I found a rolled up military black belt. It STILL SMELLED LIKE GOAT! I went through that course in 1980.
Yes I have goats and I also live near Fort Bragg.
You were lucky you had a female goat. It is the bucks who really stink during rut.
{:>D
It wasn’t a carbine. It was a 1903 Springfield rifle. 30.06 dumdum (bullet turned backwards in casing so the blunt lead end hit first.) The shooting chamber was an old cruiser turret. It was all set up to be super safe (for the people).
But Steve this going to be one of the warmest years on record! At least in the “climate scientist” computers! Notice I put quotes around “climate science” that because I don’t believe the so called “climate scientist” would know either climate or science it if bit them in their rearmost posterior part of their anatomy..
I am a practising goat, and I would like to have it put on record, that I am not smelly.
I hope nobody has thoughts about taking a carbine to THIS caprine…
There is a paper in the latest issue of Nature (10.1038/nature13625) saying warming will not affect snowfall.
Too bad the paper itself is paywalled…if it’s anything like the write up about, it will be all weasel words.
Of course this paper is the results of ‘model projections’…which are the new avian entrails.
This can mean only one thing. We haven’t cooled the past enough yet.
Some years back I read a book by author Brian Fagan that gave a very well researched history into what happened in Europe when the climate went cold around the year 1,300. The one thing that caught my attention (also the same point made form other sources) is that the climatic change wasn’t gradual. The change was rapid (a few years or less). Years a good harvests were replaced by crop failures, weather alternating between years of heavy rain to brutal cold, glaciers advancing threatening mountain villages, etc. Now I am wondering if I will see a new little (or major) ice age in my lifetime. It would be interesting to be able to walk across the frozen Hudson river like was possible during some years of the Dalton minimum.
Yes the change can be rapid and there is a good chance we will see such a change in our life time. Even Woods Hole Observatory warned about wide temperature swings a few years ago and that politicians might be barking up the wrong tree.
Abrupt Climate Change: Should We Be Worried?
Also see: A History of Solar Activity over Millennia
Woods Hole page no longer exists
Try this URL:
http://www.whoi.edu/page.do?pid=83339&tid=3622&cid=9986
This news is likely gonna harsh Al Gore’s mellow.
Takes two massive ice breakers to reach the ice free North Pole
http://www.cbc.ca/news/canada/north/two-canadian-coast-guard-icebreakers-reach-north-pole-1.2749328?cmp=rss
We’re all just failing to understand the Magic that is ManBearPig. All these things are perfect proof that the earth is boiling. When ManBearPig appears in the northern sky on his purple unicorn, raising his Carbon scepter, then his fury will be unmercifully unleashed upon the deniers! Repent ye evil carbon consumers! The end is nigh!
Barents Sea ice extent has been rising all month with the northerly winds. If that continues, ice extent in this sea could very well stay above or near normal this winter into next spring. SST’s staying near normal (a mix of above and below) instead of the well above normal readings the last few years will allow ice to form much more quickly.
ftp://sidads.colorado.edu/DATASETS/NOAA/G02186/plots/r06_Barents_Sea_ts.png
http://arctic.atmos.uiuc.edu/cryosphere/IMAGES/recent365.anom.region.6.jpg
Reblogged this on the WeatherAction Blog.
cdquarles says:
Now, can anyone show me where the Professional Climate Scientists actually used the scientific method and do/show work that they’ve done to falsify their own hypotheses/speculations? /rhetorical….
>>>>>>>>>>>>>
ROTFLMAO!
Rattus Fuscipes says: @ August 28, 2014 at 8:34 am
> The “theory” advanced is that the globe is heating due to AGW, which is caused by CO2 emissions.
#1 ===>Essentially, yes. There are other contributors than CO2, But CO2 is the largest single one.
> Soooo, in “real science”, it is the task of advocates of the theory to PROVE it.
#2. ====>Surely this has been done. The relative size of the changes in radiative forcing have are able to be calculated within limits. Clouds throw up some uncertainty, but not so much that we don’t know that CO2 is the big one.
>>>>>>>>>>>>>>>>>
You are a bit tough to follow but I will tackle what I THINK you mean in the above part of the quote.
First since the conjecture advanced is that mankind has cause a ‘change’ in business as usual aka natural climate. Bbusiness as usual (natural) is called the null hypothesis. In science it is up to the scientist to PROVE there has been a change from business as usual. That is why it is up to the IPCC to PROVE CAGW.
The IPCC even states this is their mission.
The IPCC mandate states:
Humans were tried and found guilty BEFORE the IPCC ever looked at a scientific fact. The IPCC mandate is not to figure out what factors effect the climate but to dig up the facts needed to hang the human race. The IPCC assumes the role of prosecution and and the skeptics that of the defense but the judge (aka the media) refuses to allow the defense council into the court room even going so far as to ban comments and letters to the editor from skeptics.
Who owns the media? The banks, specifically J. P. Morgan.
What is in it for the banks? – the banker’s stake in CAGW
This is a fraud that produces nothing but poverty. It does not produce a single penny of wealth and instead acts as a short circuit across the advancement and wealth of an entire civilization.
…………..
#1 ” There are other contributors than CO2, But CO2 is the largest single one.”
That is incorrect the strongest greenhouse gas is water vapor. Water vapor is 4% of the atmosphere while CO2 is only 400 ppm. Water vapor overwhelms the CO2 spectra at most IR bands. SEE chart
#2. “The relative size of the changes in radiative forcing have are able to be calculated within limits. “
Yes that has been done.
The Intergovernmental Panel on Climate Change [Schimel, 1996] estimated that the change solar forcing between 1850 (start of the industrial age] and 1990 was only •0.3 W/m 2 at the top of the atmosphere vs. 1.5 W/m 2 for forcing anthropogenic CO2 [cf., Reid, 1997].
The problem is that just recently NASA has found that although TSI (total solar insolation) does not vary much the percentage change in different wavelengths does.
Since the IPCC and climate scientists have only been concerned with CO2 and it’s effects on climate other information such as the effects of different solar wavelengths is rather scarce. However there are indications that changes in UV and EUV cause changes in the formation and destruction of ozone and changes in ozone affect wind and in the antarctic changes in ozone/wind affect the current moving around the Antarctic. Changes in the Circumpolar current change the Humboldt current which in turn affects ENSO (El Ninos) (I have a lot of papers on the subject of ozone, wind, current ENSO and Antarctic… somewhere but I am too ust tired to sort them out right now and I do not want to post 30 + pages)
Other interesting NASA papers:
Solar Wind Loses Power, Hits 50-year Low
NASA:Quiet Sun Means Cooling of Earth’s Upper Atmosphere