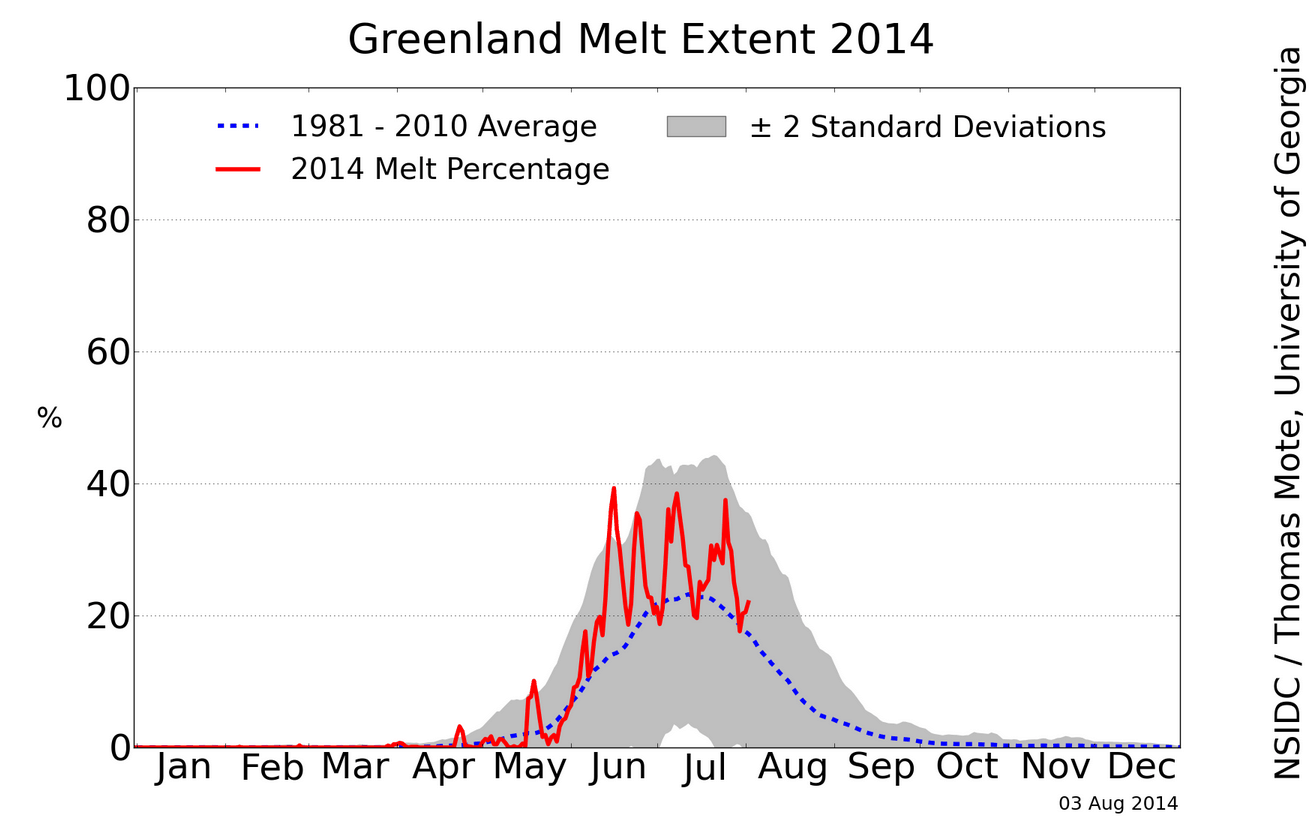
NSIDC shows Greenland melting out of control, far above average this summer.
Greenland Ice Sheet Today | Surface Melt Data presented by NSIDC
This makes no sense, because NCEP maps have showed Greenland temperatures well below normal this summer.
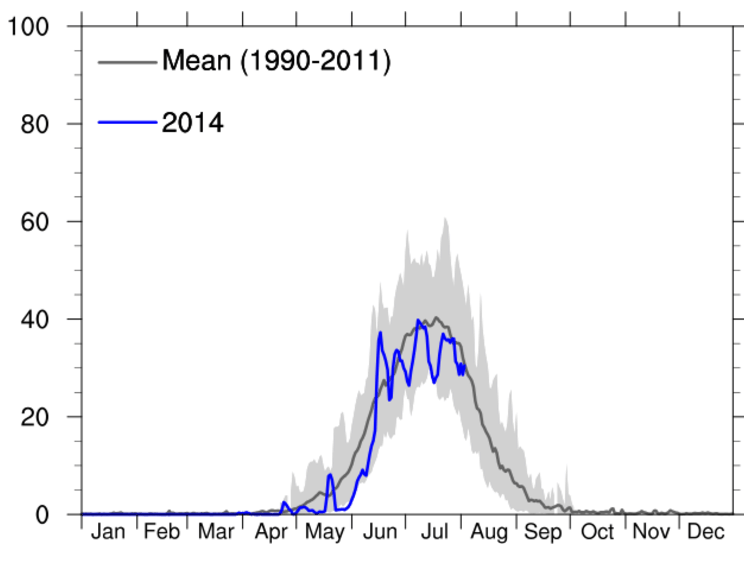
Now lets look at the DMI graph of the same thing. DMI shows Greenland melting well below normal this summer.
How did Mark Serreze’s NSIDC team pull off their Greenland nature trick? They included the cold 1980’s in their average, which was the coldest decade on record in that region.
There was essentially no melting that decade, which dragged the mean line way down. More evidence of why DMI is a better reference than NSIDC. DMI doesn’t have a global warming agenda. The NSIDC graph is extremely misleading, no doubt by design.
h/t to Chris Beal


Makes you wonder if the melting may follow a 60 to 70 year cycle or something.
I wonder what that would be…
The cyclical nature of melting and cooling in the north polar regions is actually well established in the scientific literature. So picking 1981 is highly dubious for Greenland. Actually, “wrong” would be the correct word. On the other hand, 1990-2011 is likely wrong too, *if* the point of the exercise is to put the temperature change in reasonable historical context.
“Not even wrong” is much better. This year observations confirm very high amounts of sea ice in the fjords of Greenland, which means it is so cold that the sea ie takes forever melting..
A little OT, but I found this interesting: http://www.washingtonpost.com/blogs/capital-weather-gang/wp/2014/08/04/death-valley-was-cooler-than-missoula-mont-on-sunday/
What I also found interesting was the colorization of the temperature map. They have gotten so bad with colorizing everything as hot looking as possible, that it has become impossible to discern what areas are hot, and which are not. pathetic…
Death Valley’s fangs have been pulled.
How do you like the colorization of the map? Even blow normal temperatures look as though they are aflame. The display of blatant bias is breathtaking.
When the message is not there, make sure the pictures instill the message that is desired.
One chart produces government funding, the other does not. If taxpayers knew how this worked, they’d be marching in the streets. Instead we have non-taxpayers marching.
It’s just like that weapons of mass destruction nonsense and Iraq.
Based on the paleoclimate record from ice and ocean cores, the last warm period in the Arctic peaked about 8,000 years ago, during the so-called
Holocene Thermal Maximum. Some studies suggest that as recent as 5,500 years ago, the Arctic had less summertime sea ice than today. However, it is not clear that the Arctic was completely free of summertime sea ice during this time. http://nsidc.org/arcticseaicenews/faq/#summer_ice
Along the Arctic Coastal Plain in Alaska, there are indications of summer temperatures 2–3 °C warmer than present.[5] Research indicates that the Arctic had substantially less sea ice during this period compared to present.[6] http://en.wikipedia.org/wiki/Holocene_climatic_optimum
http://theresilientearth.com/?q=content/humanity-blamed-9000-years-global-warming Not satisfied with blaming modern civilization for causing rampant climate change, now a small group of scientists are saying that everything went wrong once humans stopped being hunter-gatherers 9,000 years ago. The hypothesis, first advanced in 2003 by University of Virginia palaeoclimatologist William F. Ruddiman, remains controversial even among global warming true believers. Ruddiman now claims to have proven his critics wrong, much to the glee of the blame-humanity-first wing of the eco-activist community. LOL
When will the lying b*stards be called onto the carpet?
When they run out of weasel room…as long as the media keeps propping them up, never. They can make broad ‘predictions’ with unqualified uncertanties (if, maybe, such and such must contiue and then maybe, possibly, if something else happens) that the media laps up as if gold-plated, etched in stone and do nothing to correct until the time passes, then cry and whine…and move the goal posts all the while claiming that what they said in the first place was distorted by the evil denialists…
WHY does DMI have no AGW agenda, and how long is that policy position likely to withstand the political pressure ?
No AGW agenda because they will all freeze and starve in the cold if temps drop slightly and so they aim for accuracy, unlike the commie light green brigade that is aiming for scaring the simple folk into a one world government of elites.
Where does NSIDC’s Greenland melt data pre-1990 come from? I suggest that DMI uses 1990-2011 for their mean because that’s all the data they’ve got. Has NSIDC made up some ‘data’ for the 80’s?
http://www.dmi.dk/en/groenland/maalinger/greenland-ice-sheet-surface-mass-budget/