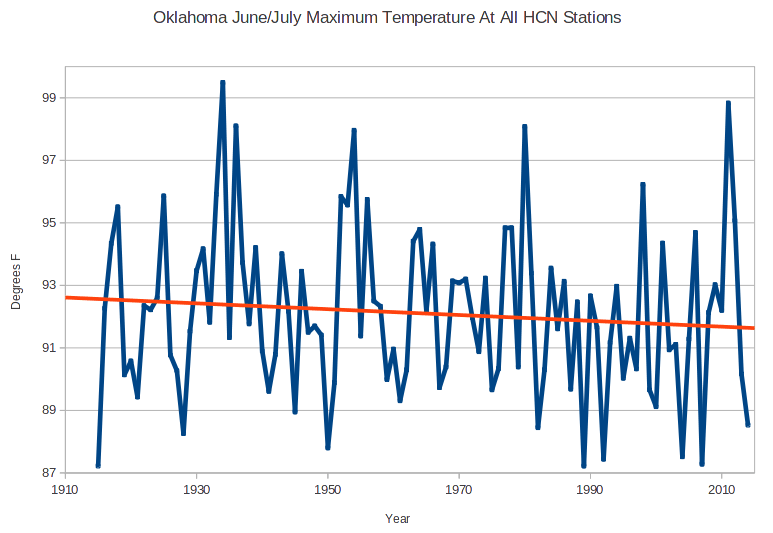
Maximum June/July temperatures in Oklahoma have declined about one degree over the past century, with five of the ten coolest summers occurring since CO2 hit 350 PPM in 1988. Oklahoma’s hottest June/July occurred 80 years ago.
Disrupting the Borg is expensive and time consuming!
Google Search
-
Recent Posts
- Gaslighting 1924
- “Why Do You Resist?”
- Climate Attribution Model
- Fact Checking NASA
- Fact Checking Grok
- Fact Checking The New York Times
- New Visitech Features
- Ice-Free Arctic By 2014
- Debt-Free US Treasury Forecast
- Analyzing Big City Crime (Part 2)
- Analyzing Big City Crime
- UK Migration Caused By Global Warming
- Climate Attribution In Greece
- “Brown: ’50 days to save world'”
- The Catastrophic Influence of Bovine Methane Emissions on Extraterrestrial Climate Patterns
- Posting On X
- Seventeen Years Of Fun
- The Importance Of Good Tools
- Temperature Shifts At Blue Hill, MA
- CO2²
- Time Of Observation Bias
- Climate Scamming For Profit
- Climate Scamming For Profit
- Back To The Future
- “records going back to 1961”
Recent Comments
- Bob G on Gaslighting 1924
- John Francis on “Why Do You Resist?”
- conrad ziefle on Gaslighting 1924
- Bob G on Gaslighting 1924
- Bob G on Gaslighting 1924
- Bob G on Gaslighting 1924
- conrad ziefle on Gaslighting 1924
- Bob G on Gaslighting 1924
- Bob G on Gaslighting 1924
- arn on Gaslighting 1924


So where do you get your data? I go to Climate at a Glance
http://www.ncdc.noaa.gov/cag/
And I generate the same [Max Temp, 2-Month, (June) July, 1910-2014, Oklahoma] graph except that 2011 is shown to be hotter than 1934.
Is there a website where ordinary folks like me can down load the data that you’ve graphed out?
You can used NCDC massively tampered data if you want, but I generate my graphs from the actual thermometer data
http://stevengoddard.wordpress.com/ghcn-code/
Thanks – but over my head.
Oklahoma? – Oh, What A Freezin’ Cold Morning
There’s a dull, bluish haze on the meadow.
There’s a dull, bluish haze on the meadow.
The corn’s not as high as a dalmation’s eye
And it looks like it’s swooning at the overcast sky.
Oh, what a freezin’ cold Mornin’
Oh, what a freezin’ cold day.
I’ve got a horrible feelin’
Nothing is goin’ my way.
All the cattle are frozen’ like statues
All the cattle are frozen’ like statues
They don’t turn their heads as they see me ride by
But a little brown mav’rick has ice in her eye!
Oh, what a freezin’ cold Mornin’
Oh, what a freezin’ cold day.
I’ve got a horrible feelin’
Nothing is goin’ my way.
Apologes to Richard Rodgers and Oscar Hammerstein II and all their fans.
Reblogged this on wwlee4411 and commented:
It can’t do that. The temperatures are getting warmer; or at least that’s we’re being TOLD!
Au contraire, at least by Climate Central Standards … link
http://www.climatecentral.org/news/the-heat-is-on/
By the way, did anyone notice that Jane Lubchenco, NOAA adminstrator from 2009-2013 is on the founding board for Climate Central?
http://www.climatecentral.org/what-we-do/people#founding-board
And on the board of EDF (Environmental Defense Fund)
http://www.edf.org/people/board-of-trustees
Any further questions why NOAA data is screwy?
The summer of 1963, I moved to Tulsa, OK in late June. We had many days that summer hotter than 100F beginning not later than the first days of July.
The summer of 1965, I worked as a geophone placement technician for an oil exploration crew in Oklahoma and we roamed the state quite widely. We had many days that summer over 100F.
The summer of 1966, I worked as a roustabout in a Red River oil field just south of the Red River. There were many days over 100F there and in Oklahoma, to which I returned on many weekends.
The summer of 1967, I worked as a roustabout on a pipeline that went from Tulsa to Liberal, KS in SE Kansas. Again we had many days over 100F that summer.
Each of the summers of 1966 and 1967, I came home to Tulsa from Brown University where the temperature was usually in the 70s and started working in the field at temperatures above 95F most days. One of those summers the temperature was above 100F for 5 weeks straight, hitting or exceeding 105F on many days. Those highs do not seem to even be reflected in the raw NCDC temperature data you are plotting. Perhaps I was just the character out of the comic strip who always had the cloud over his head, except in my case it was an unusually bright sun. But, even as I experienced very hot days roaming central and western Oklahoma, my family in the Tulsa area was experiencing pretty much the same high temperatures. One day earlier this week, the high for the day was 75F in Tulsa, which was unheard of in the 1963 -1967 period.