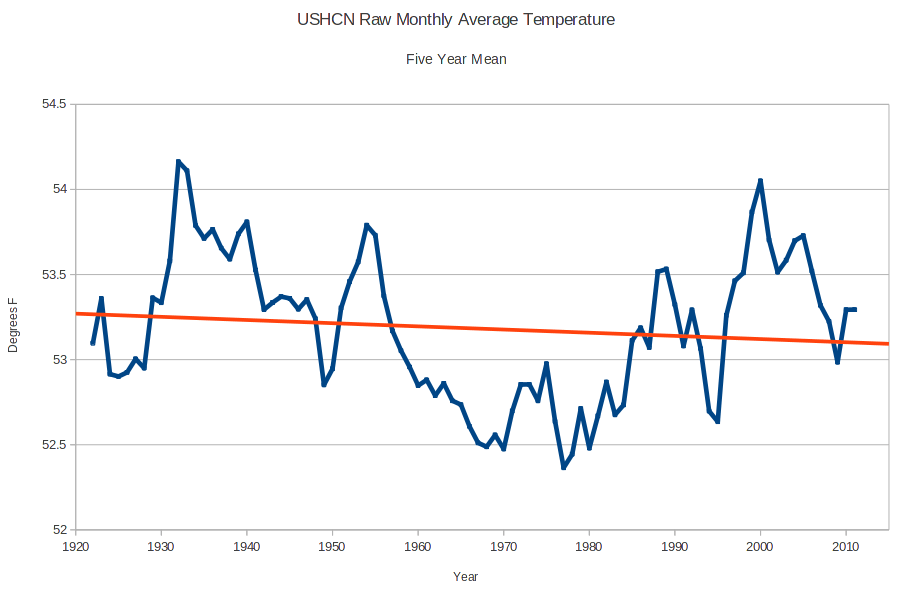
USHCN raw monthly data (which is not really raw and already tampered) shows a long term cooling trend in the US.
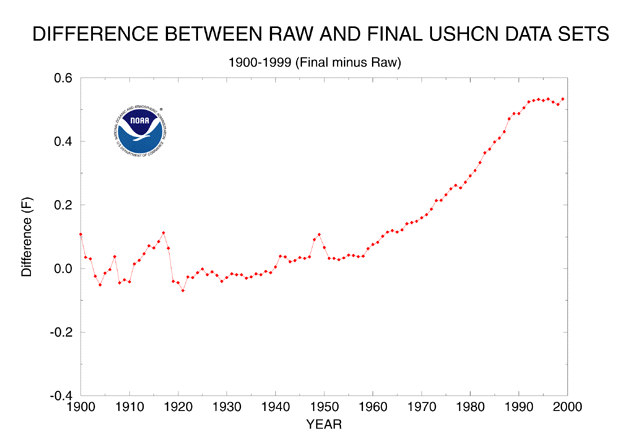
The USHCN V1 adjustments just weren’t getting the job done, and weren’t able to keep up with the cooling trend
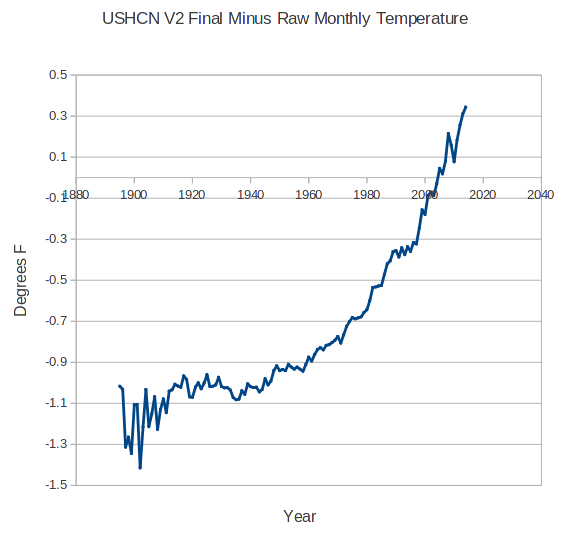
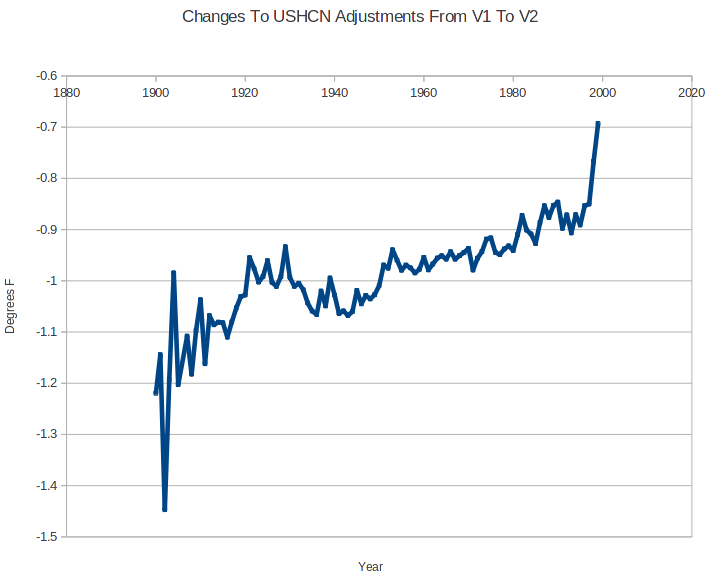
So they invented V2, with a spectacular hockey stick of adjustments – used to create the false impression that the US was warming.
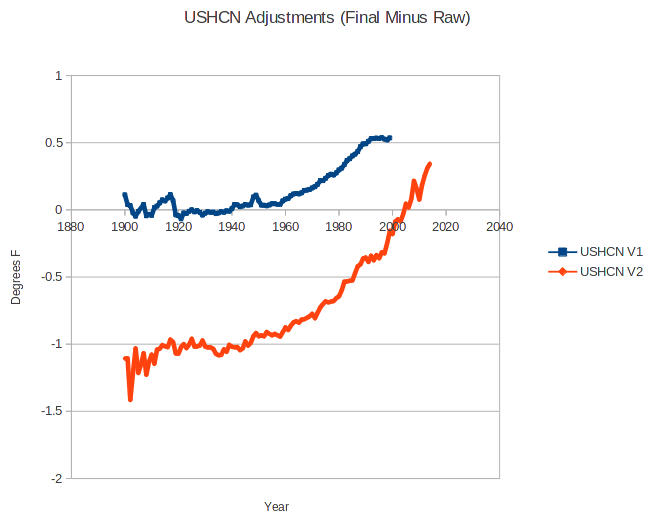
The next graph shows both sets of adjustments on the same scale. It looks like someone forgot to double check their homework before they turned it in, because V2 and V1 adjustments don’t even vaguely resemble each other. They are supposed to be almost the same the algorithms. Close enough for government work though.
The next graph shows the impressive hockey stick of new data tampering they piled on to USHCN V2 – on top of the USHCN V1 tampering.
Climate experts say that this is all golden, and that I should shut up – because I just don’t know what I am talking about.


I see all of global warming….is just adjustments
Why do you think it’s called “Man Made Global Warming”, Steve?
You’ll never make a “Climate Scientist” with your attitude, mate!
He’s mocking the supposed climate scientist Michael Mann….
What attitude is one supposed to take cat? Clearly the outputs hate are quite different than the inputs… Why must one tamper with actual Temp readings in the first place? Seems the more assumptions and adjustments you put in… The more bias is introduced…. The further from the actuals we become… Rendering these Climate Change Models useless…
I think I recognize the USHCN V2 curve. They switched to the Bernie Madoff Return on Investment calculator:
Climategate exposed a cancerous growth that had grown out-of-sight in federal research agencies since the end of WWII.
https://dl.dropboxusercontent.com/u/10640850/Preprint_Solar_Energy.pdf
You can help salvage the reputation of NASA, DOE, NSF, EPA etc by identifying flaws in the above manuscript.
A typographical error in reference #30, that induced an error in subsequent reference numbers 31-54, has been corrected. I apologize..
What I would like to see…is the monthly average temp….plotted as it would be without the adjustments
As previously reported on here …. Let’s also not forget how the Alarmists are reducing the number of USHCN stations …. Seems the importance of the issue here would require MORE… Not less Temp Stations… More spread across the Globe…
But I guess the 50lb heads at NASA know better… Removing the inconvenient stations which show no warming…
Don’t know what you are talking about.—— The graphs are simply facts, period.
Anthony at WUWT writes of the details of the homogenization, which results in the facts illustrated in the graphs. The alarmists cannot argue against there own figures.
If I recall correctly, Michael Mann created his hockey stick by using tree-rings as a proxy for temperature, up until a supposed divergence between the growth of trees and the global temperature, whereupon tree growth was no longer a valid proxy and he utilized measured or adjusted temperatures.
Was this divergence between the assumed measured proxy temperatures derived from tree-rings really from the modern temperature measurements, or was the divergence from the modern corrected temperatures?
If the so-called divergence was a consequence of the falsification of the temperature record by substituting adjusted temperatures for the actual measured temperatures, perhaps tree-rings may retain whatever validity they once had, as proxies for temperature.
Would a temperature record, derived from tree-rings, from the middle ages, until today realy generate the famous hockey stick?
In Steve’s fourth graph, USHCN Adjustments (Final Minus Raw) with USHCN V1 in blue and USHCN V2 in red, note what they have actually done.
The Version 1 graph started at zero and just added a few tenths of a degree while the second version actually cools the past but does not mess with the present as much.
Then remember The GISS Temperature Record Divergence Problem: Divergence Between GISS and UAH since 1980 UAH is Dr Spencer’s satellite data, Univ Alabama @ Huntsville.
Another post to make you smile: Shocker – CRU’s Jones: GISS is inferior