
I located the US HCN daily data in a different directory all/ on the NCDC website. They must have a software problem keeping the hcn/ directory from being updated.
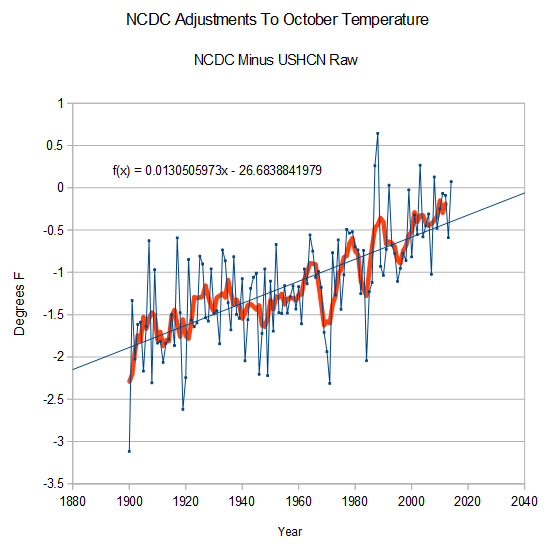
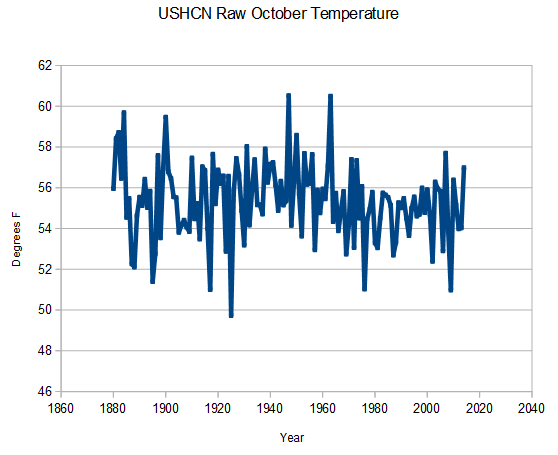
As I previously posted, they are massively cooling the past. The graph below shows the difference between published NCDC October temperatures, and USHCN raw monthly. NCDC claims that October was 4th warmest since 1895, which is complete nonsense. Some years were almost 4 degrees warmer than 2014!
This animation shows the changes from USHCN raw monthly to adjusted monthly
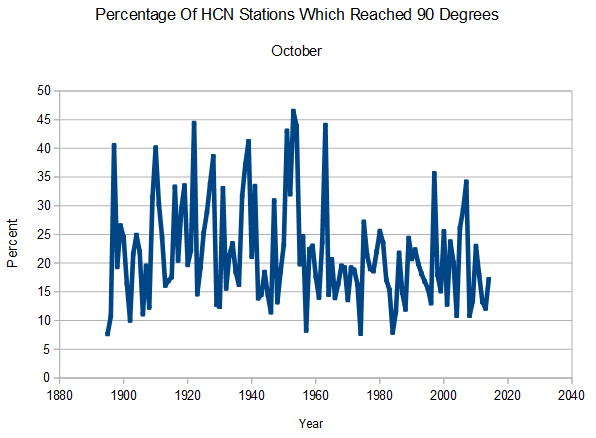
Here is additional evidence that the adjustments are complete nonsense. The percentage of stations which reached 90 degrees was very low.
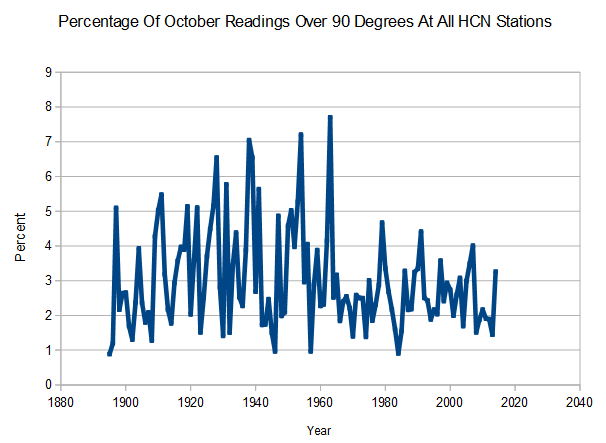
The percentage of readings over 90 degrees was very low
The number of record daily maximums was very low.
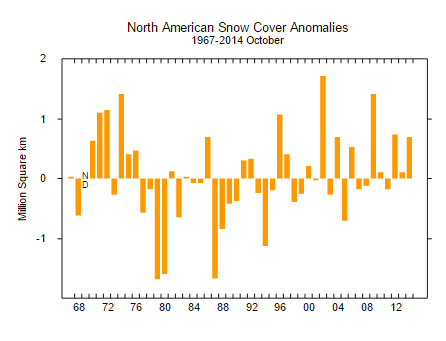
 North American snow cover was eighth highest on record, indicating that there was a lot of cold air in the US during October
The NCDC claims and adjustments are not only wrong, they are completely absurd and defy any rational scientific method.

Simple, clear, and logical presentation. Well done, sir!
So another federal agency becomes completely politicized and corrupt like the IRS and the CDC. That’s encouraging.