
In 1997, NASA showed no global warming since 1980. Other than periods of cooling after the eruptions of El Chichon (1982) and Mt. Pinatubo (1991) – global temperatures were pretty close to flat from 1980 to 1996.
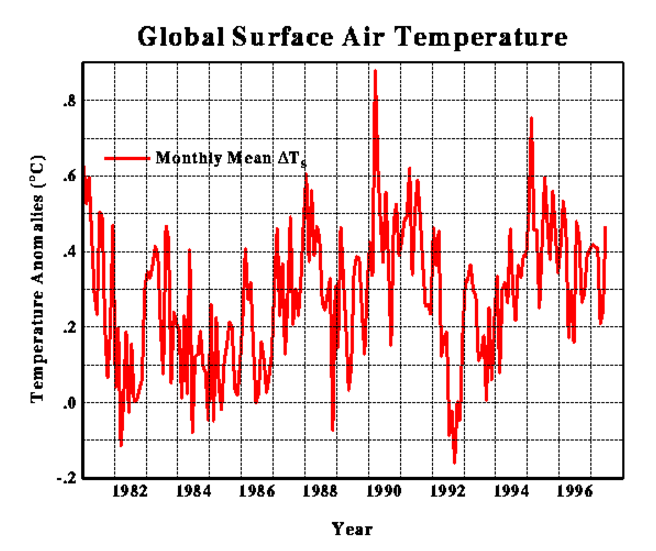
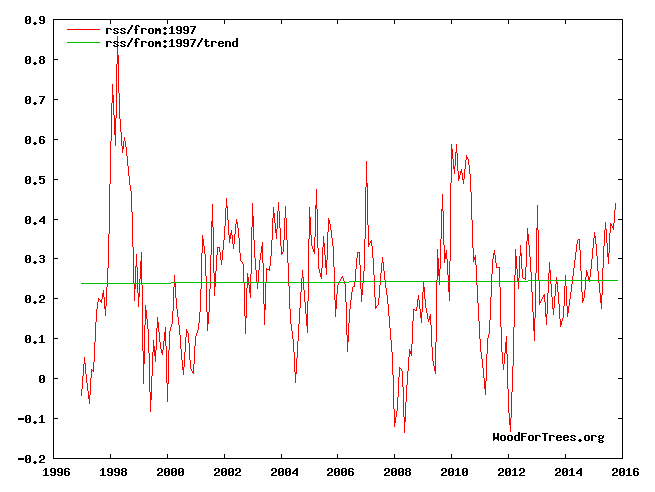
Since 1996, satellites show that temperatures have remained flat.
As far as I can tell, essentially all recent global warming occurred from 1910 to 1940, followed by 35 years of cooling, and another short period of warming after the PDO shift of 1976.
There is little or no correlation with CO2. But NASA’s top climatologists have known this for 45 years.
vademecum.brandenberger.eu/pdf/klima/rasool_schneider_1971.pdf


Martin will be along any minute now.
I asked him a day or so ago for his take on sea level. Off topic for this particular thread, but I would really like to see what he has to say.
Sorry, Steve, but I can’t follow all the requests for reposting of my opinions. Please repeat your question.
My post from a few days ago:
Martin Smith says:
November 28, 2015 at 4:53 pm
https://stevengoddard.wordpress.com/2015/11/25/biggest-fraud-in-history-perpetrated-by-tom-karl-and-gavin-schmidt/#comment-555379
I don’t know what you mean by catastrophic disaster, so I can’t answer your question directly.
What I believe is that there is already enough unavoidable warming in the pipeline so that we can’t avoid having to deal with serious problems of … sea level … that those problems will cause. If we don’t act to drastically reduce burning fossil fuels, these problems will only get worse.
So why not flesh out your concerns about sea level rise? I choose that one because I think it’s the scariest issue you guys have. The vision of inundated coastal cities does strike a nerve, so what are your projections? Numbers and dates would be good?
Steven, you are still trying to compare global surface temperature with global tropospheric temperature. You can’t do that. And the temperature rise caused by increasing CO2 lags the CO2 change.
[SG: Global warming theory is based on troposphere temperature. It is nonsensical to use UHI affected surface data as a measure of the greenhouse effect. Only a complete moron would do that.]
The lapse rate is determined by well documented physics. If the temperature profile of the troposphere no longer follows the surface temperature, what rules of physics have changed?
(Just as a thought experiment, where, exactly is “the surface”? Touching the ground? A meter up? Ten meters up? A hundred? Where do “surface measurements” end and “tropospheric measurements” begin?”
“the surface” is where you can install a thermometer. Satellites can measure surface temperature, but only where there is no cloud cover, and I think the algorithms are more complicated.
No rules of physics have changed.
The trend in UAH USA is almost exactly equal to the trend in the ONLY equally spaced, pristine, untainted surface data in the world, USCRN
That is how good satellite temperature data is.
This comparison absolutely VALIDATES the temperature data extraction used by the satellite system.
Sorry Martin , but your EMPTY opinions are just that of an empty mind.
“Satellites can measure surface temperature, but only where there is no cloud cover, and I think the algorithms are more complicated.”
RSS will be surprised to know that.
“The microwave spectrum (1.4 to 89 GHz) is rich with information about the atmosphere (temperature, humidity, clouds, rain, etc), as well as the earth’s surface (temperature, vegetation, roughness, moisture, etc). Since microwaves can penetrate clouds, surface characteristics can be measured from space even when clouds are present.”
http://www.remss.com/about/who-we-are
Sorry Martin, there’s no correlation between CO2 and Temperature.
Image didn’t take: http://www.geocraft.com/WVFossils/PageMill_Images/image277.gif
That’s the wrong graph to loo at, dog. It doesn’t show the Milankovitch cycles. Here is a representative graph: http://zfacts.com/p/226.html
Amazing how they can tell the manmade CO2 from the natural CO2.(sarc)
from the page @ your graph : “This is not proof of that the CO2 caused the warming.”
Correct, it is not proof that CO2 caused warming, Warming out of the LIA is what has bumped up CO2.
Hey lectrikdog! “Amazing how they can tell the manmade CO2 from the natural CO2.(sarc)”
Yes. I know that the common explanation is that the fossil fuels have a different isotopic ratio — but that leaves out an important point. I guess that most people who visit this site know about the pools of liquid CO2 found on the floors of various deep ocean floors. How long has that CO2 been there? Or, more accurately, how long is the average residence time for a CO2 molecule in one of those pools? What is its turnover rate? If CO2 hangs out there for 40 or 50 thousand years, then any CO2 cycled from the pools would be essentially indistinguishable from fossil fuel CO2. As far as I know, we do not have any info on half-life of deep ocean CO2 residency time.
“…the common explanation is that the fossil fuels have a different isotopic ratio….”
E. M. Smith goes into that fallacy The Trouble With C12 C13 Ratios (The preferences of C3 plants vs C4 plants among other evidence.)
Back five or so years ago when this was discussed on WUWT I dug up a bunch of other material beyond what E.M. goes into. The biggie IIRC was that coal seams are not sealed in some sort of capsule. Instead they are full of bacteria and that changes the carbon ratio assumed. Also there is the Russians abiotic oil theory which they have successfully used to find oil.
Every time the Alarmist come up with a pat answer skeptics shoot it full of holes. What Fun!
Jason Calley, yup! I shared a E.M. Smith posting about Liquid CO2 on the ocean bottom on my blog. Also another one about Abiotic Methane found on the Arctic seafloor: https://lectrikdog.wordpress.com/2015/08/29/abiotic-methane-discovered-under-the-arctic-ocean/ This stuff is seeping out all the time, and in times of no polar ice(i.e. not an ice-age as now), Earth never went into runaway warming. But now somehow we’re doomed, LOL.
No Martin.. the graph you post to uses massively corrupted temperature data, “adjusted™” to specifically match the change in CO2.
It has been shown MANY time that the temperatures “ADJUSTMENTS™” are an almost exact match to the rise in CO2.
R² = 0.998 or something like that. Absolutely deliberate.
Its all part of the FRAUD that you so love to be part of.
“Steven, you are still trying to compare global surface temperature with global tropospheric temperature. You can’t do that.
Actually, he can. If he had provided an image of the mid-troposphere, you would have a valid point. But he provided an image of the lower troposphere, which is the part of the atmosphere in which the surface sensors are.
http://www.drroyspencer.com/wp-content/uploads/version6-msu234-global-anomaly-time-series.gif
“And the temperature rise caused by increasing CO2 lags the CO2 change.”
You got that backwards.
? Changes in global atmospheric CO2 are lagging 11–12 months behind changes in global sea surface temperature. ? Changes in global atmospheric CO2 are lagging 9.5–10 months behind changes in global air surface temperature. ? Changes in global atmospheric CO2 are lagging about 9 months behind changes in global lower troposphere temperature. ? Changes in ocean temperatures explain a substantial part of the observed changes in atmospheric CO2 since January 1980. ? Changes in atmospheric CO2 are not tracking changes in human emissions.
http://www.sciencedirect.com/science/article/pii/S0921818112001658
No, dis, the temperature rise caused by the CO2 we are adding to the system happens AFTER the CO2 enters the system. And here is the explanation for why you can’t compare surface data and satellite data directly: https://www.skepticalscience.com/satellite-measurements-warming-troposphere.htm
“No, dis, the temperature rise caused by the CO2 we are adding to the system happens AFTER the CO2 enters the system.”
So you get your sciencey information from a psychology major and propagandist with an affinity for SS officers and the Third Reich. I’m not impressed. Who is paying you to post that crap?
For 55 years, CO2 empirical measurements show CO2 changes follow atmospheric temperature changes.
http://www.climate4you.com/images/DIFF12%20GlobalCO2%20HadCRUT4%20HadSST3%20Since1958.gif
The CO2 we are adding to that is insignificant.
Hey Disillusioned! Ooohhh… nice chart!
Glad you like.
There is some pretty good evidence that at times in the past that methane did not just seep. Avalanches, slides, and earthquakes have released huge globs of the stuff all at once in the past.
Again Martin enters ZERO science into the discussion.. just mindless propaganda.
Martin, There is NO explanation of any CO2/temperature “lag” at the propaganda website that you linked to. Not surprising, since that site is run by a cartoonist:
But it does explain why you are so mixed up and confused about climate change.
RealOldOne2, it’s worse than that. Kook appears to have some issues distinguishing between what kind of humor is appropriate and which is not.
http://www.populartechnology.net/2012/03/truth-about-skeptical-science.html
Hey Disillusioned! you say “Changes in global atmospheric CO2 are lagging 11–12 months behind changes in global sea surface temperature.”
Very interesting… We also know there is another, much longer term lag between climate and CO2, the 800 year lag shown by ice cores. If there is a 11 or 12 month lag as well as an 800 year lag, does that imply that there are two distinct systems of ocean currents? I would guess that the short lag is from a system of relatively shallow currents overturning ocean water and releasing CO2. The 800 year lag would be from deep bottom-of-the-ocean type currents with an overturning time of centuries.
Do any of you oceanographers out there know whether this is so?
“Hey Disillusioned! you say “Changes in global atmospheric CO2 are lagging 11–12 months behind changes in global sea surface temperature.”
I don’t take any credit for saying that. I was quoting the Highlights of a study from the Department of Geosciences, University of Oslo, on the phase relation between atmospheric carbon dioxide and global temperature.
“If there is a 11 or 12 month lag as well as an 800 year lag, does that imply that there are two distinct systems of ocean currents?”
I think those are two distinct phenomena.
“I would guess that the short lag is from a system of relatively shallow currents overturning ocean water and releasing CO2.”
SSTs are about as shallow as you can get, but I don’t think this is about currents. The authors studied carbon dioxide at Mauna Loa, global surface air temperature, sea surface temperature, and volcanic eruptions. And they observed what changes occurred, and when.
“I don’t take any credit for saying that.”
Then I will give you credit for pointing it out to me. I had not seen that before. Regardless of the cause, it is a very interesting piece of info!
Here is a nice graph that makes the lag very clear:
http://scienceandpublicpolicy.org/images/stories/papers/other/graph2.gif
Martin: “And the temperature rise caused by increasing CO2 lags the CO2 change”
Really? That raises a few questions from inquiring minds:
1) By how much time does it lag?
2) What is the physics and the physical mechanism for this lag?
I thought the CO2 “trapped” the heat radiating from the Earth’s surface on its way to space.
3) Does it let it escape first, and recover it later?
4) Does it hide it somewhere in the atmosphere where it can’t be measured, and then release it later?
And please explain the “simple physics” that allows all these magical properties of the magic gas, CO2.
5) Why does CO2 “trap” the heat and atmospheric temperatures rise in some decades, and not “trap” the heat and atmospheric temperature doesn’t rise in other decades.
6) Does the physics go on hiatus?
7) What happens to the heat in those decades where it doesn’t get trapped an increase the atmospheric temperature?
8) Does the heat go on hiatus?
9) Where does it spend it’s holiday?
10) What are the magical properties of physics & CO2 that causes it to allegedly store the heat directly into some ocean basins without first increasing the temperature of the atmosphere, but that same well-mixed CO2 does NOT store the heat in other ocean basins?
Those are my top 10 question about your magic gas, CO2.
ps. Actually you have it backwards. Temperature increases first, and THEN the CO2 increases. Temperature decreases first and THEN CO2 decreases. A cause must happen BEFORE the effect. You have the alleged cause (CO2 increase) happening AFTER the effect(rising temperature).
This can be seen in this graph of sea surface temperature: http://www.woodfortrees.org/plot/esrl-co2/isolate:60/mean:12/scale:0.2/plot/hadcrut3vgl/isolate:60/mean:12/from:1958
RealOldOne2,
Actually, that graph is of CO2 and HadCrut3. You’re otherwise on target (that changes in CO2 lag changes in temps). Here’s a WFT graph with sea surface temps:
http://www.woodfortrees.org/graph/esrl-co2/isolate:60/mean:12/scale:0.2/plot/hadsst3gl/isolate:60/mean:12/from:1960
CO2 lags behind both air surface and sea surface temps. Humlum et al., Dept of Geosciences, University of Oslo have produced graphs of these phenomena. Since 1960 (1958)…
http://www.climate4you.com/images/DIFF12%20GlobalCO2%20HadCRUT4%20HadSST3%20Since1958.gif
Since 1980…
http://1.bp.blogspot.com/-zCIUZDUvwHk/UFJgo9rZ8LI/AAAAAAAAASs/aqfBtp-QTJw/s1600/CO2+levels+LAG+Global+Temperatures.jpg
Pay Paper here: http://www.sciencedirect.com/science/article/pii/S0921818112001658
Free Paper here: http://www.tech-know-group.com/papers/Carbon_dioxide_Humlum_et_al.pdf
I’ve been thinking that the timing of this Exxon investigation, nearing the end of the Obama admin and with the evidence so clearly opposed to the meme, could be an intentional way out for the fraudsters. Put the whole shebang in front of a judge and blame it on him/her. Even more, let big oil lawyers take the blame for showing the emporer’s birthday suit. By the time it’s over, the trial, the appeals and the spin; the loot will have all been laundered and the culprits old and grey.
Even if CO2 were to create a tropospheric warming, it also creates a corresponding stratospheric cooling. Result? Increased rate of convection to the top of the troposphere. Thus, if the theoretical temperature increase would be 0.8 degrees per doubling, the actual rate would be somewhat less than that. Throw in the major fact that the H2O bands overlap the CO2 bands and the effective doubling rate is lowered yet farther.
Of course, if the current crop of “climate scientists” were honest about what to expect from CO2 effects, they would not have to lie about the actual temperature record.
>Increased rate of convection to the top of the troposphere.
Wouldn’t increased convection to the top of the troposphere warm the stratosphere? I think the point is the stratosphere cools because the increased CO2 and water vapor prevent the heat from getting out to the stratosphere.
I am certainly open to correction if wrong, but I believe you are mistaken. The stratosphere marks the surface where the radiative properties of CO2 actually do predominate over tropospheric convection. In the stratosphere, the air density is low enough that CO2 can radiate off the extra energy from the absorbed infrared. About 50% of that radiation goes to space, cooling the stratosphere. Below the stratosphere the atmosphere is dense enough that radiated energy from CO2 is more likely to be absorbed by another CO2 molecule, or the CO2 will transfer its energy to another molecule (N2 or O2) by collision.
As I say, that is my understanding, but I am willing to listen to other opinions about it.
Yes, it absolutely would warm the stratosphere. And the energy to do so would come from the troposphere, reducing it’s net warming, exactly as Jason said.
Hey Ted! I admit, I find that the heat and energy exchange at the tropopause is perhaps too complicated for me… Yes, the troposphere will be dumping more energy to the stratosphere, which would be expected to warm it — but the stratosphere also has more CO2, giving it an increased ability to cool by IR radiation to space. I was under the impression that in the stratosphere the net cooling due to CO2 was higher than the net warming due to faster troposphere circulation.
Ted, help me out if I have this wrong!
My understanding is the same as yours. My point was only that the increased convection would transfer stratosphere more of the tropospheric heat to the stratosphere than it currently does, not that there would be net warming. I was saying the same thing as you, just not as clearly.
^^^^^^^^^^^^^^^^^^^^^^^^^^^^^^^^^^^^^^
First “stratosphere” should not be there.
Martin Smith says: “… I think the point is the stratosphere cools because the increased CO2 and water vapor prevent the heat from getting out to the stratosphere.”
No Martin that is incorrect.
http://apollo.lsc.vsc.edu/classes/met130/notes/chapter1/graphics/vert_temp.gif
The above is the temperature profile of the Atmosphere. As you go up in height to the tropopause the temperature drops. This is because of the ‘Dry’ or ‘Wet’ lapse rate and is easily calculated. Atmospheric lapse rate explained:
The stratosphere has little to no water and a ‘different cast of characters’ come into play.
Once into the stratosphere, nominally 10 to 11 kilometers up, the character of the atmosphere changes as can be seen in this image from the State University of NY.
http://www2.sunysuffolk.edu/mandias/global_warming/images/stratospheric_cooling.jpg
First note that below the tropopause (the black dotted line) water vapor changes to droplets or ice and gives up the latent heat of vaporization affecting the lapse rate.
The stratosphere is where oxygen (O2) and ozone (O3) and NOx interact with incoming sunlight. The formation of ozone is exothermic, it releases heat and heats the stratosphere. Different wavelengths of sunlight affect NOx and Ox in the atmosphere in different ways. For example the ratio of 240 nm vs 320 nm is important.
http://www.oxidationsystems.com/products/ozone_formation.GIF
Formulas from: http://www.oxidationsystems.com/products/ozone.html
This is also where CO2 dumps the energy it picked up at near the surface as shown.
It is ten times more likely for CO2 to hand off the energy via collision and contribute slightly to convection below 10 kilometers. That is CO2 energy increases (slightly) the temperature of the surrounding gas and increases the rate the hot air rises. At that level (the troposphere) CO2 does not radiate energy to the surface of the earth.
Since CO2 is radiating in the stratosphere. That means almost all the IR emitted has to get past a thick atmosphere full of water vapor that will happily absorb the energy because of the overlap of the CO2 and water signatures. (The physics gets more complicated because the wavelength can change a little with the relative motion of the two molecules and recoil energy that is lost during absorption . – SEE: Mössbauer effect and The Pound–Rebka experiment)
Finally again in the ionosphere we see sunlight interacting with air and heating it up..
excellent post Gail….+1
Climate protestors in Paris destroy memorial to those who died in terror attacks
http://www.americanthinker.com/blog/2015/11/climate_protestors_in_paris_destroy_memorial_to_those_who_died_in_terror_attacks_.html
Thanks again, peeps. Off to the fitness club.
Again, after totally wasting your time and everyone else’s with your moronic non-science posts.
The option always remains to not engage in his banter.
US temperatures at sites away from UHI have been remarkably stable since 1940. If we were getting anything resembling catastrophic or even significant warming, that would not be the case. There would be no need to mess with the data to make it noticeable. It would be impossible to miss. End of discussion.
I notice that the link shows Stephen Schneider as one of the authors, the paper is from 1971. Here’s John Daly looking in more detail at Schneider: http://www.john-daly.com/schneidr.htm
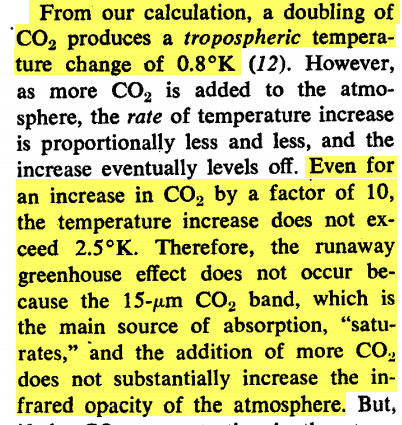
“We report here on the first results of a calculation in which separate estimates were made of the effects on global temperature of large increases in the amount of CO2 and dust in the atmosphere. It is found that even an increase by a factor of 8 in the amount of CO2, which is highly unlikely in the next several thousand years, will produce an increase in the surface temperature of less than 2 deg. K.
However, the effect on surface temperature of an increase in the aerosol content of the atmosphere is found to be quite significant. An increase by a factor of 4 in the equilibrium dust concentration in the global atmosphere, which cannot be ruled out as a possibility within the next century, could decrease the mean surface temperature by as much as 3.5 deg. K. If sustained over a period of several years, such a temperature decrease could be sufficient to trigger an ice age!
I see you did the same ref November 8th, sorry. In fact I don’t there is anything you haven’t covered, brilliant job you do.
https://stevengoddard.wordpress.com/2015/11/08/nasa-has-known-since-1971-that-co2-is-not-dangerous-yet-lied-to-the-public-continuously/
As former UK Prime Minister Harold Wilson almost said, “a week is a long time in climate politics.”
If you want to know WHY Martin is regurgitating some of this nonsense, here is a review of one of the text books that kids were subjected to in 2007. It DELIBERATELY SWITCHES LABELS!!!!
A Fundamental Scientific Error in “global warming” Book for Children
Robin gets into the change from educating to the brain washing of children that is now called modern education at Invisible Serf’s Collar. Collecting Student Data to Practice PsychoPolitics on a Massive but Invisible Scale without Consent
This is why incredible disgusting textbooks are not at all uncommon. Our textbooks are … words fail.
2004 No teacher, but every textbook, left behind
2011 Grade Inflation for Education Majors and Low Standards for Teachers: When Everyone Makes the Grade
my 12 year old comes home from school and tells about what he “learned” in “science”. Drowning polar bears etc. He knows what to say to get good grades, and the difference between that and true science.
I will add this image to get a bigger picture. Quoting from http://oceansgovernclimate.com/self-combustion-schellnhubers-view-of-the-big-picture-really/: “As early as 1978 Schellnhuber talked about a carbon dioxide problem. In 1989, environmental Bill McKibben said humanity was in danger of burning up in “a few more decades” if we didn’t overcome our “addiction” to fossil fuels. Now activist scientist Hans Joachim Schellnhuber insists we’re on track for self-immolation. He pays little attention to the seas, their extreme low mean temperatures of about +4°Celsius, and the much greater danger that the oceans one day may trigger a new ice age again – then we would be happy that the world has been warming since the end of last Little Ice Age about 1850.
We shouldn’t allow the doom mongers to missionary the world, based on insufficient knowledge of how climate ticks.”