
NASA Fraudsters claim that melting of eastern Greenland’s glaciers is caused by increases in carbon dioxide, but there is zero evidence to back up their claim. Glacier melt there peaked 80 years ago when CO2 was very low.
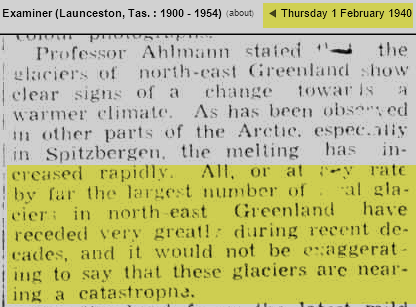
01 Feb 1940 – GREENLAND GLACIERS MELTING
There is no correlation between atmospheric CO2 and Greenland temperatures.
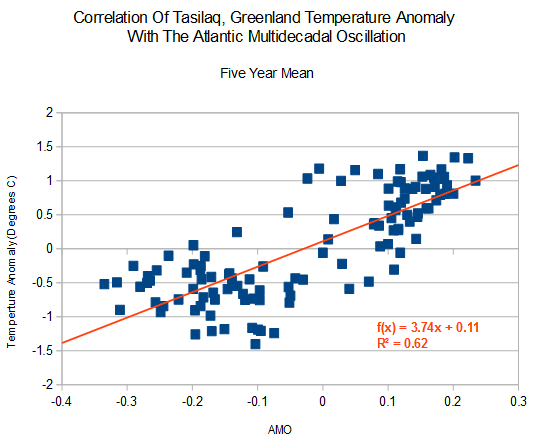
What does drive Greenland temperatures is the Atlantic Multidecadal Oscillation, which correlates nicely.
Amazing that these NASA crooks are willing to take a completely fraudulent story to the press.

I was wondering why the woods are so quiet and how the trees affect wifi transmissions. It seems that there is a war on with trees and chem trail spraying and that wifi towers stand high above any tree line. Perhaps you know of an article that covers chem trail spraying and if it is industry driven to eliminate trees … and how tree loss affects weather patterns http://www.pearsonitcertification.com/articles/article.aspx?p=1329709&seqNum=3
This has nothing to do with what I am talking about
I know, did not know where else to post it.
I think you’re on the wrong website. This is a post about temperatures in Greenland.
I know – but did not know where else to post it – the site is about chemtrails too
No its not.
I have no interest in chemtrails, whatever they are.
Beautiful photographs at your site, Elizabeth, but I’m afraid the only person here interested in chemtrails is you.
delete the comment
Nice… you seem to be an artist with the camera.
Lemon,
You should ease your mind about these so-called chem trails…there is no such thing.
The trails behind planes are water droplets…condensation, not chemicals being sprayed.
They are called contrails.
Whoever spreads this chem trail nonsense should stop, and any one interested in reality should dismiss the subject from their mind.
And why would anyone spray anything from planes to kill trees?
I disagree
Menicholas, the Washington Post agrees with you:
“Meet the “chemtrails” crowd, who posit that governments, scientists and other institutions are using airplanes’ “chemtrails” — basically contrails that are allegedly laced with chemicals — to alter the climate, create extreme weather, poison people, or even control our minds.”
There’s a hint of “climate change” in that description!
Here’s the full article, it’s a strange world: https://www.washingtonpost.com/news/energy-environment/wp/2015/01/22/how-a-group-of-conspiracy-theorists-could-derail-the-debate-over-climate-policy/
contrails are different
I must be on the wrong website, sorry!
AMO has a big impact on climate up north.
It can explain why we have reports on Ice free Artic from the period before 1978 when satellites have controlled the situation.
And on glaciers
http://oi51.tinypic.com/24yptu0.jpg
https://wattsupwiththat.files.wordpress.com/2015/09/clip_image004.png
And temperatures (red is hand drawn)
http://s19.postimg.org/qzl5p322b/Rey_vs_Ross.jpg
Reblogged this on Canadian Climate Guy.
This topic is so actual, as there are not so many studies on the oceans and their part in the global warming is often ignored. I have read a study regarding the arctic warming (www.arctic-warming.com) that may interest you, as it debates the theme and tries to find some answers for the questions regarding climate change periods. It is very important to focus on the oceans, as every definition we will try to find for the climate, we will get to the point where we will say that “the climate is the continuation of oceans by other means”.
Of interest is Frank Lansner’s The Original Temperatures Project presented at WUWT
Frank looked at ocean affected vs interior temperatures.
http://hidethedecline.eu/media/AORIT/SUM/4.gif
I would think if you wanted the actual ‘temperature of the earth’ you would look at what is happening to Ocean Air Shelter stations since they are not as affected by ocean oscillations.
http://hidethedecline.eu/media/AORIT/SUM/19.gif
very interesting analysis. thank you.