Gavin claims in the Canberra Times that he has not removed the 1940’s warmth in the Arctic
“You appear to hold a number of misconceptions which I am happy to clarify at this time,” Dr Schmidt told Senator Roberts in letters and emails obtained by Fairfax Media. “The claim that GISS has ‘removed the 1940s warmth’ in the Arctic is not correct.”
NASA chief slaps down climate sceptic senator Malcolm Roberts: ‘You hold a number of misconceptions’
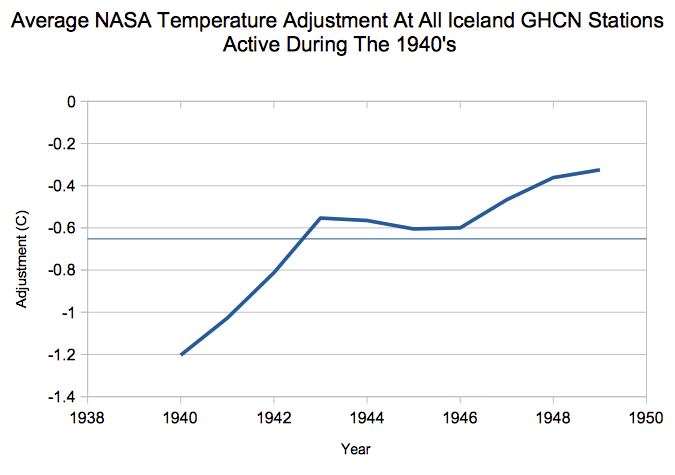
Gavin told lots of lies in this article, but none bigger than this one. He has in fact removed the 1940’s warmth at every single Iceland station active during the 1940’s
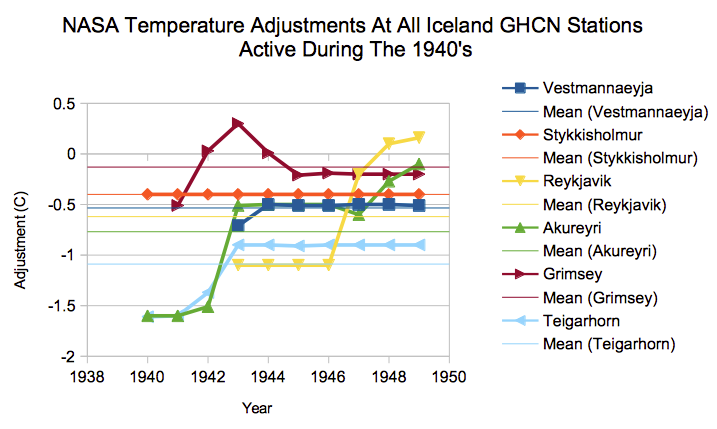
The average for all stations is 0.65C cooling via Gavin’s data tampering.
Climategate E-mails show that Gavin’s friends in fact colluded to remove the 1940’s warmth.
Archived version of http://di2.nu/foia/1254108338.txt
Gavin and his friends had good reason to want to hide the 1940’s Arctic warmth. Another NASA expert says the 1940’s were warmer in Greenland than they are now.
The current Greenland warming, while not yet quite matching the temperatures of 70 years ago …..
The Arctic was very warm in the 1940’s, and glaciers were completely disappearing.
27 Dec 1948 – ATMOSPHERE CHANGES IN ARCTIC AREAS
Glaciers from Greenland to Norway were nearing catastrophic collapse.
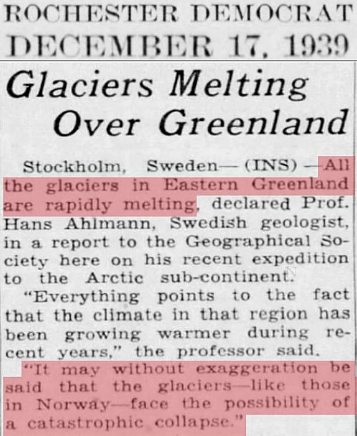
17 Dec 1939, Page 15 – Harrisburg Sunday Courier
Arctic temperatures increased by 10F (6C) from 1900 to 1947, and melting ice threatened drown the coasts.
31 May 1947 – ARCTIC CLIMATE’S ALARMING CHANGE – Trove
Gavin’s fraud gets even worse however. He has not only removed the 1940’s warmth in the Arctic, but he has removed it from the entire planet.
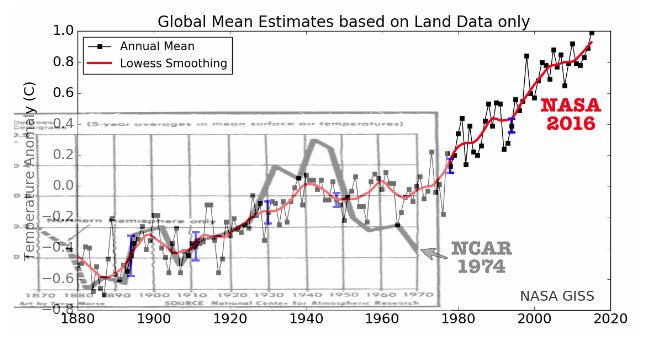
NASA graphs from 1981 showed the 1940’s warmth, but Gavin has removed it.
It is stunning that Gavin has been getting away with this fraud, but not surprising that the Canberra Times would write a wildly fraudulent hit piece on a senator without showing the courtesy to contact him in advance to get the facts.
Yeah Tony your 1974 NCAR vs. NASA 2016 overlay is your best so far. President Trump needs to go over the heads of the press and present it to the American people.
Of course a lot depends on the events of December 19th 2016.
Steve are you really that worried about the electoral vote? I’m not. I think this hubbub by the democrat press is every bit as much leftist and RINO scat as we heard before the election and I pretty sure that any real attempt at usurping the system could very well result in civil war.
As Yogi Berra says, “It ain’t over ’til it’s over.”
I expect the Democrats to fight right up to the event’s of Monday 19 December 2016 and I expect them to continue to fight right up to Friday 20 January 2017 and I expect them to continue to fight after that. They will fight and deny the events of Tuesday 8 November 2016 forever.
The leftists already have that covered.
>>>Discussion over at ChiefIO’s<<<
These are bits from the middle of the conversation.
Larry Ledwick checked out several search engines and found the same.
Then E.M. Smith says
So the search engines are hiding what Trump actually said so the Massive Fake News can bash him without people being able to see the original text.
Larry has an example which started off the whole ‘check the search engines’ discussion.
Looks like it is time to K I L L the ‘messengers’ because they are working for the other side.
Ben from Suspicious Observers Supplied a link to this, Im glad he did, very interesting stuff. Will share this with like minded friends.
Even better if you share it with your other friends.
Pingback: More Climate Fraud From The Canberra Times And Gavin Schmidt | Richard Presser's Blog - The Sceptical Bastard
I wonder why Jill Stein isn’t asking for a recount in New Hampshire. That was a closer race than any of the three she is contesting now. Hillary won New Hampshire by about 2700 votes, or 0.4 percent.
I guess that’s my answer: Hillary won New Hampshire, so there is no need to contest that one. Right Jill?
Jill Stein and the Clinton’s are a bunch of losers who will eventually go away. I hope it is soon because I’m very tired of listening to their lies.
Yep and Stein was on the ballot in NH and got .88% of the vote according to RCP. It’s more about money and keeping her name in the news than anything else IMO.
Arctic temperatures increased by 10F (6C) from 1900 to 1947…
Of course it did…it was the height of the AMO
They tried to get away with this for years….by ignoring the AMO..and trying to link everything in the Arctic to the PDO
Can’t watch what they say….watch what they don’t say…..AMO
So we are in another AMO/PDO cycle right now, right, Latitude? When do we expect these cycles to subside, or syncopate, so that their signal will be obvious? Obvious in a way that puts the CO2 hypothesis to rest?
The AMO cycle has a very large effect on NH temperatures, particularly in the higher latitudes.
Here is the real temps from Reykjavik graphed against the AMO.
The AMO is been flatish for about 10 years, but is just about starting to turn downwards.
Thanks. What are NH temperatures?
Sorry Northern Hemisphere. Got it. Catching on. I am sometimes thought of as a slow learner.
So long as you always question what is shown,
and never take anything for granted, you will keep learning.
It is those that think things in science are ever “settled”, that are the NON-learners.
Plaease clarify: What is AMO? What is PDO?
AMO – Atlantic Multidecadal Oscillation
PDO – Pacific Decadal Oscillation
Pingback: Eruption Watch, Quake Magnetism, Weather | S0 News Nov.27.2016
Pingback: Today’s Breaking News Sunday, November 27, 2016 | earth change affirmations
Pingback: 'Fraud': NASA's Gavin Schmidt & Canberra Times Exposed - Principia Scientific International
Pingback: Eruption Watch, Quake Magnetism, Weather | S0 News Nov.27.2016 - Dissent TV
Just for fun..
We know the effects of the 1998 El Nino culminated in early 2001.
and the 2015/16 El Nino started to bite about mid-2015.
So I looked at the trends from 2001 – 2015.6 in RSS, GISS, Had4 and UAH, all brought back to the same starting point in 2001.
Very instructive , I think ;-)
I want to know what’s going on here! Does this indicate that land readings will go up and satellite readings will go down?
That is just the current trends in 4 different “global” data sets.
GISS and Had4 are surface based and have been highly adjusted and fabricated by the climate scammers at NOAA and elsewhere to produce warming that does not exist. The people who produce this from sparse unknown quality surface data covering barely 50% of the land surface and even less of the sea surface are among those driving the climate/global warming scam.
RSS and UAH show the between El Nino trends measured from satellites using closely gridded evenly spaced data from several satellite, combined using proper engineering principles.
The guys that run RSS are actually “warmistas” that have so far managed to keep their work from being compromised by their ideology.
UAH is run by two scientists that will not compromise their work for the sake of any ideology.
And the balloon radiosondes match the satellites and so is a check if the reported satellite data are being unfairly adjusted.
Who are the two scientists who run UAH? Is John Christy one of them?
The UAH data are overseen by John Christy and Roy Spencer.
RSS and UAH over the USA are also an almost exact ZERO trend match for the pristine USCRN surface data since 2005 when it was established.
The surface data responds more to peaks and troughs, so the effect of the 2015 El Nino was to separate the USCRN trend very slightly.
Is USCRN supposed to be unassailable?
Its a newly constructed (2005), evenly spaced, pristine network that SHOULD remain unaffected by urban heat and thing such as site repositioning, instrument changes, etc for a long time.
It SHOULD be basically immune from data tampering and “adjustments” so long as they keep up the maintenance.
Please correct me when/if I am wrong.
That graph shows an upward trend among all temperature gauges. It is only for the past 10 years, but, to what do we attribute the upward trend? I understand that it is nearly impossible to attribute global temperature trends to one thing. Thanks for the help.
What upward trend? At most just a tiny fraction of one degree! That easily falls into the noise level. With just a few cold months you could have just as large a downward trend. There is nothing that need be explained here, except why this does not match the Gavin Influenced Surface Series.
Got it. So nothing to worry about! Thanks Neal.
Look closely. (you can enlarge your screen to say 250% if using windows)
USCRN is only one with a very slight trend.
As I mentioned above, that is because the surface data gives peaks greater than the satellite data.
There has just been a major El Nino event which is reflected in the USCRN data over the last year or so.
El Ninos are nothing to do with CO2 warming.
They are a solar/wind energy store and discharge event, that actually release energy from the oceans.. ie cools then down.
Within a few months , that tiny extra trend will drop down to basically zero again.
The ONLY places/periods that have experienced any warming in thw whole satellite data are those directly affected by El Ninos and the two main ocean oscillations, the AMO and the PDO. None of which has anything to do with atmospheric CO2
bailcon, the only worry will be if the temperatures start to drop.
Plants require warmth and CO2 to grow.
Both are needed to feed the world.
AndyG are you talking about solar minimums? Would that be your bet for a drop in temperature?
I know I have posted this graph before.
I’ve taken the NCAR data as in Tony’s graph. This looks like a 3 or 4 year data step.
So I took the 3 year running average of the RSS data to smooth to about the same step.
I then allowed a very generous 0.2C warming from the end of NCAR to the start of the RSS data in 1980, and adjusted the temperature and date scales so they were as close to the same as I could get them.
This is what I got.
As you can see, the current temperatures on a 3 year average basis, are about 0.2C BELOW the 1940s
ps.. just realised that I had used the RSS data with 0.333C added to it to match it to GISS in the graph below. Doesn’t affect anything on the graph above, because the numbers on the far right are only for scaling purposes.
Pingback: Today’s Breaking News Monday, November 28, 2016 | earth change affirmations
A 1940’s blip they forgot to get rid of.
We all know the Arctic has had a large pool of “less colder” air over it for most of November, and there has been a big pool of “more colder” air in northern Russia.
( Less colder, more colder… my terminology and I’m sticking with it ;-) )
Here’s the fun part…
The “less colder” blob is above 82.5ºN latitude, so won’t be calculated in RSS
Its also mostly about 85ºN so won’t show-up in UAH
But the Siberia “more colder” blob will have a big impact on both.
RSS and UAH for November could be quite interesting. :-)
typo correction…. wrong word.
Its also mostly above 85ºN so won’t show-up in UAH
Andy, here’s one of the graphs I’ve been looking for…haven’t found the other ones yet..I didn’t bookmark them…(I know, don’t say it!)
These are isolated arctic stations ( no UHI) trended against the AMO..
AMO dictates the water temp….water dictates the air temp…these are taking air temps
http://www.climate-skeptic.com/wp-content/uploads/2010/09/AMO-and-Isolated-Stations.jpg
Here is a fun one, showing just how pervasive the AMO really is.
It shows the expansion and contraction of Swiss glaciers against the AMO cycle.
And quite strangely, The Mt Baker glaciers in NW USA follow exactly the same pattern.
I’ve rotated the graph from the original
Note that the peak extent is in 1979 and the previous minimum was in the mid-late 1940’s.
Hint, if you save the pic to your computer, you can paste it where it says “select an image….”
file type must be one of the 4 types given.
eg
Yeah but first I have to remember to save it!…LOL