We are used to seeing historical reconstructions like this one published in Nature, showing Arctic sea ice diminishing steadily since 1950.
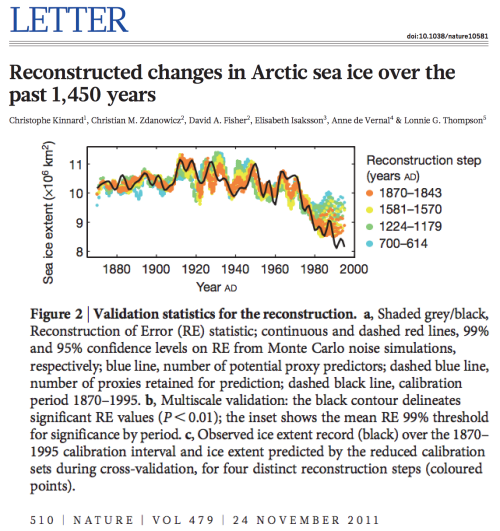
Reconstructed changes in Arctic sea ice over the past 1,450 years
This graph from Cryosphere Today shows the same thing. Ice diminishing since 1950.
seasonal.extent.1900-2010.png (1296×1057) seasonal sea ice extent timeseries
Pierre Gosselin dug up this document from the DOE in 1985, which shows the exact opposite. There was a large increase in Arctic sea ice after 1950.
The post-1950 increase in ice was extended by the 1990 IPCC Report until 1979.
Combining the two graphs, it becomes clear there was very little net ice loss from 1925 to 1979, and a sharp increase after 1955.
Comparing the Cryosphere Today graphs and the 1985 DOE graph, they show no correlation. The DOE document showed a large amount of ice loss from 1925 to 1950, and the Cryosphere Today document showed a sharp increase.
Either the earlier sources are fraudulent, or the more recent ones are. And as is almost always the case, it appears the more recent documents are the culprit.
In 1958, the New York Times reported half of Arctic sea ice was lost in the first half of the century, and that the Arctic would soon be ice-free.
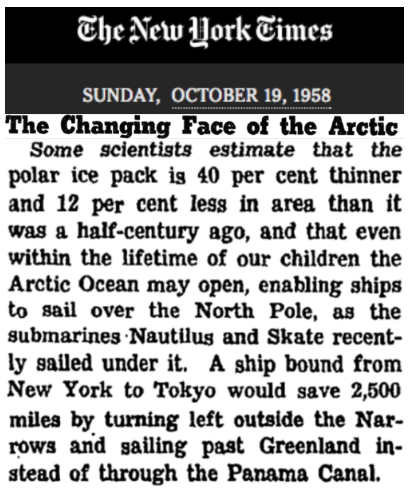
The Changing Face of the Arctic– The New York Times
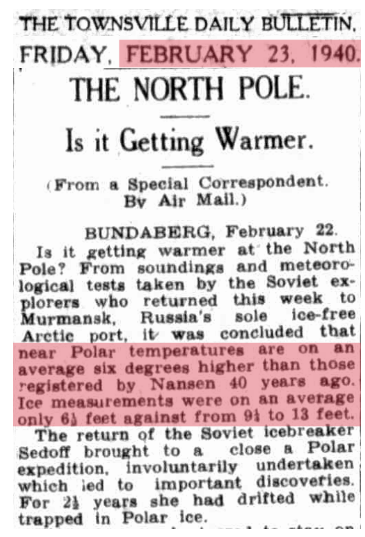
In 1940, Soviet explorers reported Arctic sea ice had shrunk in thickness by nearly 50%.
The subsequent cooling and increase in sea ice was also well established.
National Geographic : 1976 Nov, Page 576
This fits right in with the well established pattern of collusion and fraud by government climate scientists working to make the warmth of that era and subsequent cooling disappear.
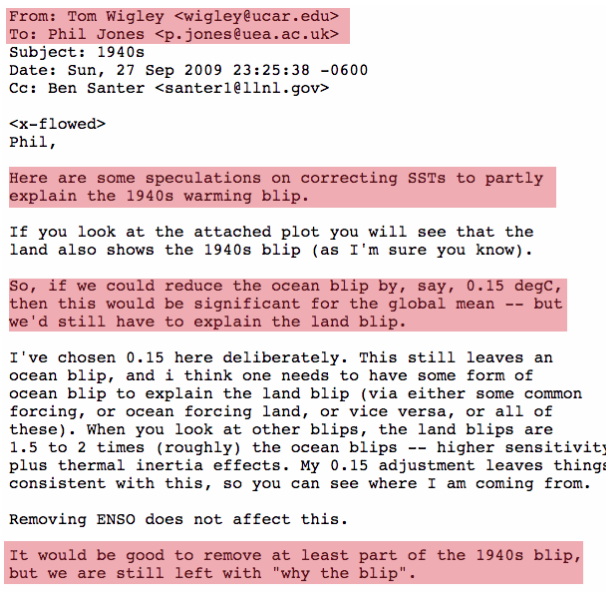
http://di2.nu/foia/1254108338.txt
Make no mistake about it, catastrophic global warming is the biggest fraud in science history. There is overwhelming evidence of fraud and collusion between government funded agencies.
“Who controls the past controls the future. Who controls the present controls the past.”
“The new aristocracy was made up for the most part of bureaucrats, scientists, technicians, trade-union organizers, publicity experts, sociologists, teachers, journalists, and professional politicians. These people, whose origins lay in the salaried middle class and the upper grades of the working class, had been shaped and brought together by the barren world of monopoly industry and centralized government. As compared with their opposite numbers in past ages, they were less avaricious, less tempted by luxury, hungrier for pure power, and, above all, more conscious of what they were doing and more intent on crushing opposition. ”
George Orwell
Yes, Trump should forget about Hillary and round up these fraudsters and put THEM in jail.
HRC just regurgitated what they told her.
re-pubic-lick-uns & T-rump will hunt Hillary till they have her in jail. If voters (Hillary won by 2 & 1/3rd million votes & increasing) will gather against T-rump, america can teach T-rump what a vindictive little kkk(always small letters) boy it is. The pointy white hat does fit T-rump’s head.
Oh. Look. It’s a Democrap.
Hillary = 232 electoral votes 43%
Trump = 306 electoral votes 57%
HINT: We elect our president based on ELECTORAL VOTES.
Hillary knew that going in. She insisted that not accepting the results of the election was treasonous and a danger to American democracy.
Now she demands a recount with ZERO chance of changing the results. Her followers have protested, rioted, and in every way possible, lashed out at the results of the election … including babbling about the popular vote, which is completely irrelevant.
Suck it up, buttercup. You lost this one. Spewing childish venom won’t change a thing.
poor lite-on-brains.
REALITY is hard for you isn’t it little boy/girl/what-ever.
Hillary won Mexifornia by well over 4 million votes, meaning she lost the other 49 states. The Electoral College working as the Founders intended.
To help understanding the historic changes in Arctic sea ice, there also are these historic maps from DMI found in an archive in Iceland.
They can be found at NSIDC:
http://nsidc.org/data/docs/noaa/g02203-dmi/
Original at this icelandic site:
http://brunnur.vedur.is/pub/trausti/Iskort/
They are still not available at a DMI webpage in Denmark, which I find strange, as they are of great value. Us in Denmark, with the most windmills per capita, are suffering from this scam. We are bombarded with propaganda daily from national media, which we are forced to pay for, if we just have internet access. We have the highest taxes, the most expensive energi, and the largest public sector in the world. I would like, that the changes you hopefully will see in USA after january 2017, will propagate some to this part of the world.
There is a complete archive of historical data, including DMI/whaling charts, Soviet records, ships logs, explorers logs and everything else, going back to 1850.
This article is a simple summary of the research, with links on to the research details:
https://www.carbonbrief.org/guest-post-piecing-together-arctic-sea-ice-history-1850
(If you are going to dispute this, don’t waste time having a go at the location of this article, look at the actual research please)
The research shows that according to all available records, current extent is far lower than at any point in the last 150 years.
Otherwise, it is absolutely clear that both extent and volume have fallen during the satellite record and that since 2006 extent has been below the lowest point likely in the previous 30s/40s cycle (see Judith curry’s 3 part historical ice state survey on her blog)
see this for extent…
http://nsidc.org/arcticseaicenews/charctic-interactive-sea-ice-graph/
or this:
https://seaice.uni-bremen.de/amsr2/extent_n_running_mean_amsr2_regular.png
https://seaice.uni-bremen.de/amsr2/extent_n_running_mean_amsr2_previous.png
” . . current extent is far lower than at any point in the last 150 years.”
So? Did we really expect anything else following 150 years of a warmer climate than we had during the LIA? I’d offer that the Earth doesn’t really have to warm any more – just staying the current temperature for the next 100-200 years should result in a naturally occurring reduction in the sea ice extent.
I’m more interested in the April data of the Gulf of Bothnia and Gulf of Finland and Baltic Sea.
Any idea why there is no sea ice reported in this zone from 1911 until 1922 in the month of April?
ftp://sidads.colorado.edu/DATASETS/NOAA/G02203/1911_04.jpg
Here August 1938 with less ice.
Less ice than what? 1952?
August ice in 2016 was much lower than this – the NW passage was open, for example, and the Beaufort sea ice free…
There has been markedly less ice than in 1938 in Augusts since 2007, I’d say.
Griff,
The NW passage was open in 1944 as demonstrated by the passage of the St. Roch in one season. The point is that before climate became so political, both research and anecdotal evidence showed the Arctic ice extents to be quite variable. After politicization, the Arctic ice extents became preternaturally flat in pre-satellite years as exemplified in the Cryosphere Today chart above with a down-turned hockey stick blade post satellite. Shades of Michael Mann!
The 1944 passage of the St Roch was completely impassable this year.
Northabout had to slip around the back through Cambridge Bay, even then could not use the route that Amundsen used in 1903 while he was doing the first close mapping of the region.
How lucky was Northabout to have all the benefits of satellite weather forecasts , ice maps etc…
Icebreakers too?
Northabout was too small to follow an icebreaker, lots of large chunks of sharp broken ice behind one of those things. Not a good place for a little boat. I was watching the ship movements, they did actually have a peak at following, but withdrew.. sensible Russian captain !.
At Vilkitsky Strait they got prior notice from satellites of a strong southerly and positioned themselves to sneak along the shore as the ice got blown away from shore.
Definitely weather satellite help, not ice breakers.
The Mackenzie frozen up in August. I dont think so
In a way you’ve almost done TOO good a job on them, Tony. How does Trumps government acknowledge fraud by the previous administration/s without exposing the US tax payer to potentially vast legal suits? The Green Blob has extracted tens and hundreds of billions so claims from coal and gas industries could be crippling. (In passing I note Soros now owns coal shares…)
Will real-politik dictate Trump merely pulls the EPA, climate policies and certain individuals without actually admitting ‘liability’?
You do that by going after each of the INDIVIDUALS involved like Gavin Schmidt and Mikey Mann and also all the various universities top brass. You might also go after the MSM and the World Bank and people like Al Gore and the estate of Maurice Strong.
I am sick and tired of the individuals winning big and then if there are problems the tax payer gets hung with the bill. Do what Iceland did. Go after the individuals involved fine them and toss them in jail.
Fair enough, ‘though you may have missed one out. Initials of BHO.
Some years ago i have been watching a critical documentary about world wide water privatisation by global corporations and
there was an interview with a super rich rat faced skinny old guy inside his huge Limousine,
and this guy said:”We let people pay for water,
and soon we will let them pay for breathing the air”
I thought:Old guy is crazy,because that’s impossible to make people feel guilty and i needed 2 years to find out that this old guy was not crazy at all,but that
this system already exist-called carbon tax and global warming was the trojan horse for this scam to make people feel guilty and make them therefore pay
willingly the air tax,
just like the vatican did with the sale of indulgences.
Money for nothing.
Bob Tisdale had a great piece on the politicization of climate. He points out that it was the alarmofascists who started this political science-fiction circus, and does so very well.
https://wattsupwiththat.com/2016/11/29/the-politicization-of-climate-science-is-not-a-recent-phenomenon/
stating the obvious…..the old ice charts Tony posted….line up perfectly with the AMO
Which is where they should be…and is proof the old charts are right
..and is also why they ignore the AMO
https://www.climate.gov/sites/default/files/AMO_and_TCCounts-1880-2008_0.png
At the bottom of this article are sea ice charts showing annual minimum in September, for the periods 1850-1900, 1901-1950, 1951-2000, and 2001-2013. The maps show the sea ice extent in the lowest minimum during each period, which are in years: 1879, 1943, 1995, and 2012.
Take a look.
Notice anything?
https://www.carbonbrief.org/guest-post-piecing-together-arctic-sea-ice-history-1850
yep…the 50 year time periods do not line up with the AMO
WOW look at these ‘Experts’ at the Carbon Brief.
ALL have a vested interest in seeing the Global Warming Scam continue.
did I not say this is only a handy summary article linking to the research and please comment on the research, not carbon brief?
so your view on the research itself is?
Why?
The Guardian especially, as well as the rest of the MSM and the universities have all shown they are in on the scam actively censoring skeptics and indulging in name calling. Trust in ‘science’ is following the trust in the MSM down the tubes.
>>>>>>>>>
FALLACY: Appeal to Authority
However since you have already invoked Appeal to Authority lets see what the papers say.
How Many Scientists Fabricate and Falsify Research? A Systematic Review and Meta-Analysis of Survey Data
Abstract
……This is the first meta-analysis of these surveys.
…… Survey questions on plagiarism and other forms of professional misconduct were excluded. The final sample consisted of 21 surveys that were included in the systematic review, and 18 in the meta-analysis.
A pooled weighted average of 1.97% (N = 7, 95%CI: 0.86–4.45) of scientists admitted to have fabricated, falsified or modified data or results at least once –a serious form of misconduct by any standard– and up to 33.7% admitted other questionable research practices. In surveys asking about the behaviour of colleagues, admission rates were 14.12% (N = 12, 95% CI: 9.91–19.72) for falsification, and up to 72% for other questionable research practices.….
Considering that these surveys ask sensitive questions and have other limitations, it appears likely that this is a conservative estimate of the true prevalence of scientific misconduct.
US scientists significantly more likely to publish fake research, study finds
Why Most Published Research Findings Are False
The editor in chief of Lancet, Richard Horton, wrote last month:
(wwwDOT)thelancet.com/pdfs/journals/lancet/PIIS0140-6736(15)60696-1.pdf
The Seer of Science Publishing
>>>>>>>>>>
I have a degree in science from a Big Ten University. Their turn towards illogic has so disgusted me I am thinking of demanding all records of my having been to that university removed. I certainly will never donate a penny to them.
The crap coming out of US universities with Ohio State the latest is truly bizzare . What manager would EVER hire someone from a university that had ‘cry-ins’ and therapy for snowflakes traumatized by the Trump election?
If I was a parent of a student I would be suing for my tuition money back!
Griff,
you posted your weak,misleading stuff at Watts Up With That,where several people tore you apart showing your claims to be feeble.
Tony, here convincingly shows what really happened using actual observations first hand,yet you seem to ignore it.
Sunset, do you have a link to that thread?
Here you go,Andy:
Griff started the thread with a bad claim,
https://wattsupwiththat.com/2016/09/23/arctic-ice-a-historical-viewpoint/
The smackdown was further down the thread starting here:
https://wattsupwiththat.com/2016/09/23/arctic-ice-a-historical-viewpoint/#comment-2305120
and,
https://wattsupwiththat.com/2016/09/23/arctic-ice-a-historical-viewpoint/#comment-2305273
There are others, but you get the point of how dumb his claims are.
Typical of the slime that is the alarmist.
Gets totally eviscerated on WUWT, then brings the LIES and PROPAGANDA here.
They never learn, and they never want to learn.
Tommy & co – no, nobody refuted me on Watts in the past.
They all quoted previous multiple season/icebreaker assisted passages.
I say again – for 10 years ships of all classes have been able to sail the NW passage without meeting ice, not needing icebreaker support, in a single season.
Its open.
this has not been the case pre -2007 in records dating from 1497 on.
A whole decade completely open, which did not happen in the 1940s… come on people, how is that not a great change from before?
ROFLMAO.. You are so DUMB that you didn’t even know you had been ripped to shreds
So hilarious. !!
DENY, DENY, DENY.. its all you can do, isn’t it
It’s garbage….that’s what I think
If you ignore the PDO, ENSO, El Nino, AMO
You can get away with saying air temps have increased.
…water temps dictate air temps…and it’s too much water for air to change it that fast
Yes,
It is the oceans that determine the climate on earth and the sun that determines how much energy goes into the ocean.
Heck the oceans determine the amount of CO2 because warm water holds less CO2 than cold water so the amount of CO2 will follow the ocean water temperature.
yeppers…
..and that 1940’s spike in CO2 is perfectly aligned with the AMO spike
https://www.climate.gov/sites/default/files/AMO_and_TCCounts-1880-2008_0.png
Latitude what do you think about climate sensitivity to CO2? I have heard anywhere from .4 to 8 degrees C radiative forcing to a doubling of CO2. How do you see this? Is there good empirical evidence here?
@bailcon
Look at the work of Arrhenius and Angstrom. The first thought the sensitivity was 3-4.5°C/doubling. This what the IPCC latches onto. Arrhenius eventually worked it down to 1.5°C/doubling, in the area Angstrom worked out. But Angstrom’s assistant, found the atmosphere was already soaking up all the IR, nothing for more CO2 to work with.
Latitude what do you think about climate sensitivity to CO2?
====
No one knows…..with what little knowledge we really have….it all has to be a guess
Can’t be that dominate though…because no one can explain why CO2 increases after temps increase….and temps can take a nose dive crash while CO2 levels are still increasing…
Recent example is the current 20 year hiatus…while CO2 levels were still climbing. 20 years is a long time for something that’s supposed to be that powerful.
So my answer is….dunno…but their science does not add up at all
I have heard anywhere from .4 to 8 degrees C radiative forcing to a doubling of CO2. How do you see this?
====
The same way you should…..they don’t know squat, they contradict each other…and obviously the science is not settled
Mostly just a bunch of hysterical hand waving..
..and almost all of global warming is produced by adjusting the temperature history
From JoNova’s blog link.
“Empirical estimates by Lindzen and Choi,[1][2] Spencer and Braswell[3][4] and Idso[5] suggest it is 0.4°C – 0.7°C.”
ClimAstrologists “best” estimates of climate sensitivity are relentlessly, slowly shrinking (they were around 3.5°, now around 2°C).
So what does the word ’empirical’ mean?
“I have heard anywhere from .4 to 8 degrees C radiative forcing to a doubling of CO2″So the upper numbers pulled out of someone’s bum to scare the sheeple. Those numbers are not evidence based.
Why? Because of the usefulness of FEAR.
“The only way to get our society to truly change is to frighten people with the possibility of a catastrophe.”
– Daniel Botkin, emeritus professor.
“Unless we announce disasters no one will listen.” -Sir John Houghton, first chairman of the IPCC
“The smart way to keep people passive and obedient is to strictly limit the spectrum of acceptable opinion, but allow very lively debate within that spectrum.” – Noam Chomsky, American linguist and U.S. media and foreign policy critic.
They know it’s a scam but it is useful for changing society.
“We’ve got to ride this global warming issue. Even if the theory of global warming is wrong, we will be doing the right thing in terms of economic and environmental policy.”
– Ex-Senator Timothy Wirth, President of the UN Foundation.
“No matter if the science of global warming is all phony… climate change provides the greatest opportunity to bring about justice and equality in the world.”
– Christine Stewart, former Canadian Minister of the Environment. Calgary Herald, 1998
“The data doesn’t matter. We’re not basing our recommendations on the data. We’re basing them on the climate models.”
– Prof. Chris Folland, Hadley Centre for Climate Prediction and Research.
“I believe it is appropriate to have an over-representation of factual presentations on how dangerous it is, as a predicate for opening up the audience to listen to what the solutions are, and how hopeful it is that we are going to solve this crisis.” — Al Gore, Grist magazine, May 2006
THE GOAL
“This is the first time in the history of mankind that we are setting ourselves the task of intentionally, within a defined period of time, to change the economic development model that has been reigning for at least 150 years, since the Industrial Revolution… democracy is a poor political system for fighting global warming. Communist China is the best model.“ — Christiana Figueres, disciple of Al Gore, and Executive Secretary of the UN Framework Convention
http://news.investors.com/ibd-editorials/021015-738779-climate-change-scare-tool-to-destroy-capitalism.htm
Anything before 1974 is a pure suppository.. but Griff likes suppositories.
Griff, what is your take on why TH linked 80s graphics, early pre 79 satelite graphic, and numerous newspaper quotes of scientists disputes your link?
That the ice level dropped in the ‘last cycle’ i.e. roughly the 1940s is not in dispute.
That it since dropped further than the last cycle and has now been lower than last cycles low point for 10 years and still trending down, with less old/thick ice about, is surely not in dispute either.
He is showing rightly it was low in 20th century.
I’m showing its now lower and staying below prev levels and getting lower.
consider:
for the last 10 years the NW passage has ben open every year, completely ice free and navigable by ships up to large cargo vessel/cruise liner size, entirely without icebreaker assistance and by ships encountering no ice whatever in their transit.
A decade of ice free passage of NW passage is unheard of previously in records going back to 15th century. Pre 2007 all passage was in multiple seasons/with icebreaker assistance (possibly 1 1930s exception)
I dispute your claim that “for the last 10 years the NW passage has ben open every year, completely ice free and navigable by ships up to large cargo vessel/cruise liner size, entirely without icebreaker assistance”
If this were so why have there been only be TWO cargo vessels traversing there in the recent past? Yet on the russian side due to their fleet of icebreakers there are numerous cargo transits back and forth.
I can find at least 3 in different years and a cruise liner.
e.g. this one
http://www.businessinsider.com/a-cargo-ship-just-completed-a-historic-trip-through-the-northwest-passage-2014-10?IR=T
BTW Russia’s NE passage is open annually without ice breakers thanks to lower ice extent (quite late in 2015, but open). For an increasing part of the year it doesn’t need icebreaker support, or only on part of it – so Russia is increasing traffic on it throughout the year.
They used to do whaling along that coast, before the EXTREMES in sea ice of the LIA, you ignorant twerp !!
We watched the NE passage this past summer and the russian icebreakers were working overtime.
Why do you lie? Do you think it will not be caught?
for the last 10 years the NW passage has ben open every year..
So what?…that’s exactly what should happen when the Atlantic current takes the AMO into the NWP
That’s what has happened every time in the past…why would it change?
It hasn’t happened for 10 years in the past 500 years though, has it.
So why would it be open now?
“It hasn’t happened for 10 years in the past 500 years though, has it.”
you have zero proof of that.
Do you know ANYTHING about the past climate?
We had this really cold period called the Little Ice Age.
If you want to experience it.. move out of your cosy little inner-city slum, and move to Siberia.
But, biodata from the region show that for the first 3/4 of the Holocene, there was often ZERO summer sea ice.
But you obviously choose to REMAIN IGNORANT of real facts…. because ignorance is all you have to base you brain-washed rants on.
Pre 2007 all passage was in multiple seasons/with icebreaker assistance (possibly 1 1930s exception)
===
Ok Griff…
I’ve seen people post to you how it was open in the 1940’s….again the AMO
…and I’ve seen you reply to their posts so I know you saw it
all of the 1940s passages were with ice breakers and/or took multiple seasons and/or were ice fortified vessels.
For example the ‘St. Roch’s’ first trip (from West to East) took about 28 months (850 days), starting from Vancouver, B.C. on June 23 1940 and ending at Halifax, N.S. on Oct 11 1942.
Since 2007 any type of vessel has been able to pass through in a single season.
It is a flat lie to say it was open like it has been in the last decade during the 1940s.
ROFLMAO…
Make it up as you go along, twerp.
The Route that the Larsen took St Roch took was impassable this year.. End of story.
And those boats were slow and underpowered as well as having zero guidance from satellite sea ice maps.
You are again showing what an ignorance, brain-washed fool you really are.
Griff says:
If this dip is not in dispute, why does the above Cryosphere Today chart not show it? I reiterate that this chart is suspiciously flat pre-satellite and smacks of the same agenda that tried to erase the medieval warming period.
That the ice level dropped in the ‘last cycle’ i.e. roughly the 1940s is not in dispute”
But the Cryosphere and other scam graphs don’t show that to any measureable extent.
You have just put your other foot in your mouth, yet again.
The Icelandic sea ice index tells a very different story
Iceland is one of the few areas that sea ice can expand.
Carbon Breifs are doing what they do best LIE AND FABRICATE.
The Actual NW passage was NOT open this year.
The route through Cambridge bay was., but it has often been navigated in the past.
In 1944 the St Roch navigated a passage that was completely impassable this year.
And let’s not forget, 1979 was an EXTREME for Arctic sea ice nearly as high as during the LIA as clearly shown by the actual Icelandic Sea ice index.
This small RECOVERY since that EXTREME has been highly beneficial, allowing Russia, with the aid of its ice breaker fleet, to actually use the Arctic as a commercial route, like it was before the Little Ice Age.
Then how did the Crystal Serenity go through it?
It used the Amundsen route through the NW passage of course…
Pre 2007 there were not years in which either western exit was open. Now at least one exit has been passable by the largest ships for a decade, entirely without icebreaker assistance.
That is a step change in conditions in the NW passage.
roflmao.. a HUGE modern ship with an icebreaker in hand, travelling with modern satellite charts and navigation.
You are a MONUMENTAL FOOL , Griff !!
Show how EXTREME the sea ice has been in the mean time, doesn’t it Griff.
These EXTREME levels of sea ice in the intervening years since Larsen’s passage in 1944 show up well in the Icelandic sea ice data.
Thanks for drawing FACT of 1979’s EXTREME sea ice levels to everyone’s attention so often. :-)
You are doing us realists a great service. :-)
Sorry wrong image.. but read that one anyway,
You might learn something if capable of basic comprehension.
Here’s that Icelandic sea ice chart.
Normal for a long period during the drop into the MWP.
Then around 1600 the EXTREMES through the LIA stand out.
Then we see it drop back down to NORMAL for the period from 1920-1960 (look closely you will see it is less than the period leading from 1979 to 2000),
Seems that the current level is very much the NORMAL level after the EXTREME spike of the late 1970’s, which was almost as high as during most of the LIA.
The red dots are to help you identify the variable period cycle of the AMO.
DO TRY TO LEARN SOMETHING THIS TIME !!
Due, almost exclusively, from a persistent high pressure system that swept out large portions of Arctic sea ice through the Fram Strait, not because it melted from higher levels of atmospheric CO2.
Here are the UAH NoPol temps for this century before the current El Nino.
ZERO WARMING !!
Hey AndyG, what is your opinion on climate sensitivity to CO2? Is there good evidence for what the ratio is? I have heard that there is good evidence for the no-feedback hypothesis. Essentially a doubling of CO2 will cause 1 degree of warming. What do you think?
bailcon,
Try Dr David Evan’s dissection of the models and the development of a new model. He finds a math mistake in the ClimAstrologists “forcing-feedback model”.
http://sciencespeak.com/climate-nd-solar.html
The specific section with a short summary link
” …Fitting the data to the alternative model, we conclude that the equilibrium climate sensitivity (ECS), the surface warming per doubling of the CO2 concentration, might be almost zero, is likely less than 0.25 °C, and most likely less than 0.5 °C. Most likely, less than 20% of the global warming since 1970 is due to increasing carbon dioxide. The CO2 response is less than a third as strong as the solar response—both measured in degrees of surface warming per unit of radiation imbalance…”
From the JoNova blog page the above points to:
“Empirical estimates by Lindzen and Choi,[1][2] Spencer and Braswell[3][4] and Idso[5] suggest it is 0.4°C – 0.7°C.”
ClimAstrologists “best” estimates of climate sensitivity are relentlessly, slowly shrinking (they were around 3.5°, now around 2°C).
There is basically zero evidence that CO2 has any warming effect whatsoever.
ie warming sensitivity to increased CO2 in a convectively controlled atmosphere is ZERO !!
You did not read carefully Andy, Dr Evans says:
“…the surface warming per doubling of the CO2 concentration, might be almost zero, is likely less than 0.25 °C…”
Essentially so darn small you can not separate it from the rest of the factors.
I will take that and let the warmists have a bit of face saving.
I know what David thinks. :-)
“let the warmists have a bit of face saving.”
NO, I’m not at all inclined to do that. ;-)
It should be zero. To have a climate effect (statistical weather summary over an arbitrary time baseline) it has to have a weather effect. No ‘hotspot’ no net IR effect. Water does have a marked ‘hotspot’ effect. Dry standard atmosphere lapse rate -9K/km (from memory). Moist actual atmosphere -6.5K/km with some error bars that I have not seen published and don’t remember how large they are. Even with that, the surface skin and near surface air temperatures do not have to increase just because more water has been added to the column. Other processes may take that energy and move it elsewhere.
If the NW passage has been open every year, (i) why did all those small craft have to be rescued in (I think it was) 2013?, (ii) why did a group from Cornell have to turn back (because ice blocked their way) just after they turned into the NWP from Baffin Bay in (I think it was) 2014? Something doesn’t compute here.
I just want the damn ice to go away so we can start drilling.
Why ever anyone wants ice and colder temperature has always been beyond me. They must be masochists/sadists into mass starvation.
When it was warmer during the Holocene Optimum the Sahara Desert BLOOMED. They are finding it was farmed.
I always believed they know they are lieing but “the means justifies the end” which is always money, power and prestige.
Will we now see real scientists come out since they will no longer fear being fired?
Actually it is, “the ends justify the means”, and is a hard and fast rule for leftists.
Yep, sounded like a climate scientist…got it assbackwards or is it backwards asses? ?
Time 1974. Color enhanced version. Shows expanding ice extent from May 1968 to May 1974. One can assume that the extent of Arctic sea ice had been in a decreasing cycle sometime prior to 1968, and from the IPCC exhibit (above) – Fig 7:20 (a.), that the sea ice extent continued to expand until approx 1979.
A notable statement in the Time article about GT’s:
“Since the 1940s the mean global temperature has dropped about 2.7° F.”
And the opposition starts plotting…..
https://www.afp.com/en/news/2265/world-mayors-gather-plot-trump-era-climate-plan
Deal with your REAL POLLUTION, you morons !!
You want to reduce CO2.. PLANT MORE TREES. !
That will also help with your REAL POLLUTION as well
gofer that is probably a meeting of ICLEI.
http://www.democratsagainstunagenda21.com/iclei-when-they-say-local-they-mean-it.html
They were probably behind the new Ca law which forces Dairy farmers to buy a $4 million methane digester. Farmers are saying many will be forced to leave State or shut down. I wonder who really benefits besides digester mfgs?
The idea is to force all the independent farmers out of business.
That was the goal of the World Trade Organization Agreement on Ag. and the Food Safety Modernization Act that forces US farmers to obey those WTO rules. The rules are written by the Ag cartel. Last I checked these were the big 10.
Cargill, Dan Amstutz of Cargill wrote the agreement. (Continental Grain has been bought by Cargill.)
Louis Dreyfus
Bunge
André
Archer Daniels Midland -ADM purchased a 50% stake in Alfred C. Töpfer International
ConAgra
IBP
Nestlé
Unilever
Philip Morris/Kraft Food
Monsanto and Dow are also part of the group.
What these companies are doing is vertically integrating. They own the land, animals, crops, silos, plants and even shipping. In that way they control the world food supply and can set what ever price they please.
Within the last couple of decades there has been a major land grab in the EU, Australia, Africa, Latin America, Mexico, the USA and I think Canada. The planning goes all the way back to the end of WWII and the Committee on Economic Development, sister organization of the CFR. China is also into the land grab. Just do a search on “farm land grab”
What is being ignored about the log term ice amounts (previous to the 1950’s) on the charts shown in Griff’s post is a caution statement that was issued by one of the primary researchers stating that it is based on limited data. NSIDC and others conveniently choose to ignore it. It was noted several years ago. It may have been issued by Chapman, but I will not look it up as those who do not want to see it will not see it. Much like the cow farts law in California.
Then please post a link to the cautionary statement.
We can be sure that we currently have the lowest extent for this time of year in the 37 year satellite record…
We know that extent has not recovered to pre 2007 levels in a decade.
we know the measured trend over 37 years is down.
we know we have had a decade of annual ice free passage through the NW passage, something not recorded in our records which are from the 15th century on.
Really, there is no doubt about what the pre 1950 record shows us… but the post 1979 record is enough on its own to show warming.
“we know the measured trend over 37 years is down.”
Totally in line with the cycle of the AMO.
Its even levelled out over the last 10 years following the flatish top of the AMO.
You have been shown the REAL DATA of this, but still you DENY and LIE
You can still find places that show that nasty warming in the 30es.
Haparanda (65.8 N,24.1 E)
http://data.giss.nasa.gov/cgi-bin/gistemp/show_station.cgi?id=645021960000&dt=1&ds=14
Sodankyla (67.4 N,26.6 E)
http://data.giss.nasa.gov/cgi-bin/gistemp/show_station.cgi?id=614028360000&dt=1&ds=14
Gees Robert.
Don’t draw attention to them !!!
Of course.
and now we see nastier warming in the 2010’s
“see nastier warming in the 2010’s”
Nothing nasty about warming in the ARctic from -50C to -35C !
If you want COLD, move to Siberia, from your inner-city green coal-heated ghetto.
Until you do that, you are noting but a yapping little hypocrite.
No we are not (at least locally). It was and remains much hotter in the 1930s than now. For me, all of the coldest weather that I can remember has happened since 1980. Then again, I don’t live in the urban madhouse if I can help it (modest exceptions have been Tuscaloosa and Huntsville, but they’re not that large (65,000 and 170,000 respectively when I lived there). When I started looking at this rot seriously a decade ago, I came to the conclusion that there had been no warming at all from 1901 to 2000. That has not changed, so it is approaching 120 years with no net warming. In places and for certain small lengths of time, it has oscillated from a bit cooler to a bit warmer and back twice.
grab them before they change them!… LOL I’m not kidding!
Griff is stuck on WEATHER not climate.
This is the sleight of hand used by the CAGW fraudsters to convince Münzenberg’s ‘Useful Innocents’ that it is ‘warming’ catastrophically.
What does CLIMATE actually tell you? The earth is getting cooler and the present ‘warming’ is a natural recovery from the Little Ice Age.
Ice cores from the Freemont Glacier show it went from Little Ice Age cold to Modern Warming warm in the ten years around 1850 — Naturally.
These authors of a study in Norway simply state that most glaciers likely didn’t exist 6,000 years ago, but the highest period of the glacial activity has been in the past 600 years.
“five individual periods of significantly reduced glacier extent are identified at ~ 3400, 3000–2700, 2100–2000, 1700–1500, and ~ 900 cal yr BP….” Shows up as spikes on the Greenland ice core temperature graph.
The shifts since 1845 and since 6000 years ago are now being overridden by recent, extensive, human caused warming which has seen effects on the sea ice in the last 3 decades more extreme than in the 30s/40s or any time in the last 150 years.
This is sudden, recent, concerning change.
all your historical quotes and past climate events cannot obscure this new event now taking place
“human caused warming ”
There is little to none HUMAN caused warming
The only warming in the whole of the satellite period has come from EL Nino step events. These are TOTALLY NATUAL EVENTS that have absolutely NOTHING to do with humans
You are welcome to try to prove otherwise, but so far you have been an ABJECT FAILURE.
How about the climate studies of the Arctic itself? Do they back up Andy’s claims?
Another peer-reviewed paper published in the Canadian Journal of Earth Sciences finds that Arctic sea ice extent at the end of the 20th century was more extensive than most of the past 9000 years. The paper also finds that Arctic sea ice extent was on a declining trend over the past 9000 years, but recovered beginning sometime over the past 1000 years and has been relatively stable and extensive since.
http://research.bpcrc.osu.edu/geo/publications/mckay_etal_CJES_08.pdf
Or this paper…
Holocene fluctuations in Arctic sea-ice cover: dinocyst-based reconstructions for the eastern Chukchi Sea
Griff is looking at weather and Andy is looking at climate.
There is a reason the arctic was ice free in the early Holocene – the orbital inclination at the time (i.e Milankovitch Cycle)
The current orbital position/inclination of earth is not as it was then, so we are seeing reducing sea ice from some other climate driving mechanism.
I’m quoting science which is looking at recent climate change caused by warming.
your quotes are irrelevant – the cause of current events is different from the Early Holocene.
“the cause of current events is different from the Early Holocene.”
Its called a El Nino WEATHER event, and there is still VASTLY more sea ice than during the first 3/4 of the Holocene, and almost certainly more than in the 1930’s and 40’s.
It is YOU and your childish ignorance of anything more than your pre-pubescent history that is irrelevant.
“I’m quoting science ”
ROFLMAO.. you deluded little brain-dead troll !!
No, you are totally IGNORING science.
That is all you have ever done.
As some have pointed out before, the Arctic tends to be relatively low coverage of ice preceding a big freeze like the
Wolf, 1280 to 1350 (666-736 years ago )
Sporer, 1460 to 1550 (466-556 years ago )
Maunder 1645 to 1715 (301-371 years ago )
and
Dalton, 1790 to 1820 (226-196 years ago ) minimums.
This is seen on the notrickszone graphic of simulated and reconstructed September here —
http://notrickszone.com/wp-content/uploads/2016/11/NTZ-Arctic-Sea-Ice-Late-Holocene-Human-Influence.jpg
Not that this means much, all it reinforces is that ice coverage is mostly influenced by local variables such as sea surface temperature and wind direction and strength.
The Milankovitch Cycle, or one of the many other dozens of cyclic phenomena may well be involved, we can never be completely sure until another event occurs, as the error bars on the timing of these cycles are rather broad! What we do know is that we are due another cold event, and preceding it with an Arctic of minimum ice would not be unusual.
Tom,
I chased some interesting papers on Geomagnetic and the Arctic starting HERE.
Climate and the earth’s magnetic field is mostly ignored but there are some interesting correlations.