NOAA Adjustments Correlate Exactly To Their Confirmation Bias

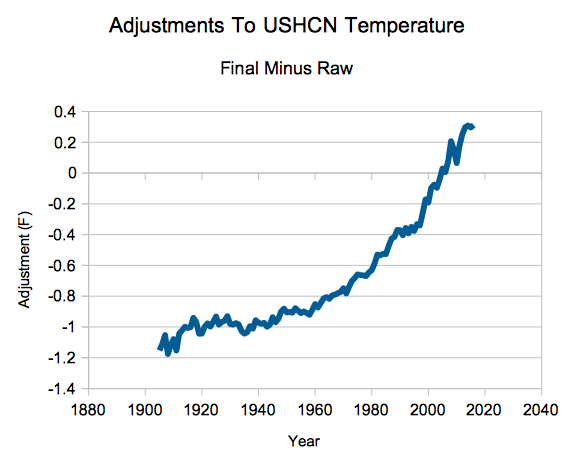
Thermometers show the US cooling since about 1920, but NOAA massively cools the past to create the appearance of a warming trend.

screen-shot-2016-11-21-at-9-31-19-am

These adjustments make a spectacular hockey stick of data tampering.

screen-shot-2016-11-21-at-9-36-49-am

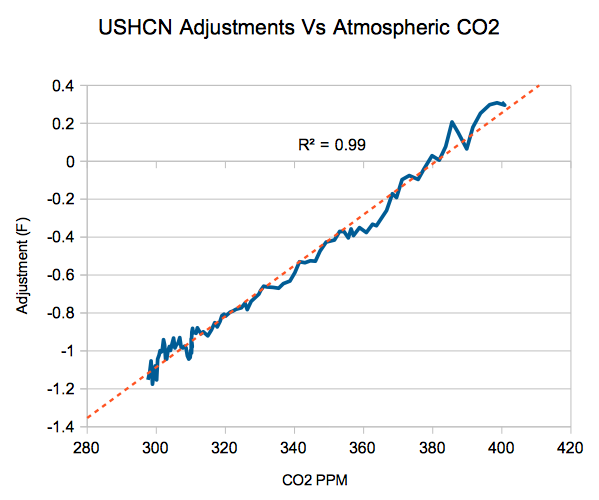
When plotted against atmospheric CO2, the correlation is almost perfect.  NOAA is tampering with the data exactly to match their theory.

screen-shot-2016-11-21-at-9-26-17-am

This entry was posted in Uncategorized. Bookmark the permalink.

233 Responses to NOAA Adjustments Correlate Exactly To Their Confirmation Bias

  1. Oliver K. Manuel says:

    Thank you, Tony, for exposing falsehoods disguised as “consensus science”

    1. Here is a 2-question IQ test for potential Science Advisors to President Trump:
    https://dl.dropboxusercontent.com/u/10640850/IQ_TEST_FOR_SCIENCE_ADVISOR.pdf

    2. The key for grading the IQ Test is posted on JoNova’s blog:
    http://joannenova.com.au/2016/11/marrakech-in-the-end-there-is-nothing-but-spin-and-all-the-momentum-that-28-billion-dollars-a-week-can-buy/#comment-1859894

    • Oliver K. Manuel says:

      If Trump is to drain the swamp, he must first expose NAS abuse of every federal research agency that was required to endorse the AGW story in order to get NAS approval of their budgets for the next fiscal year.

      For the sake of the nation, Trump must be firm, not punishing, of NAS members for betraying our national security and taking advantage of budgetary control of federal research agencies for their own personal benefit.

      NAS did not design this system and Congress refused to act in 1976 when I personally wrote to every member of Congress to tell them the National Academy of Sciences was abusing its control of budgets of federal research agencies.

    • Oscarphone says:

      I’m out. The second one got me. I think “von Weizsacker” is some sort of dirty sex actually.

    • Roger says:

      Your 2-question test is a failure.
      “Atomic rest mass data (Brookhaven National Laboratory)
      and nuclear charge density for 3,000 types of atoms that compromise all matter in the solar system.”
      REALLY? Compromise all matter? If all matter is compromised, what’s the sense of living?

    • Kenneth Arnold says:

      Sir,

      Would you be a relative (son?) of Professor O.K. Manuel, who taught at the University of Missouri at Rolla?

  2. TA says:

    The measured part of the USHCN chart is the real temperature profile. The one we are living under. The one on which policy should be based.

    According to the real, measured USHCN temperature profile, we are in, and have been in, a downtrend since the 1930’s.

    You can’t do “hotter and hotter” and “hottest year evah!” using this chart. That’s why the surface temperature chart was modified, to give the climate alarmists talking points they wouldn’t have otherwise.

    The USHCN measured chart profile applies to the entire world, too. It is representing the global temperature, not just the U.S. Tony can show you all the charts from around the world that showed the 1930’s as hotter than subsequent years until the climate alarmists got hold of them and changed them, like they did the U.S. surface temperature charts.

    • AndyG55 says:

      I took the NCAR graph from 1974, and made a guestimate attempt to splice on the 3 year averaged RSS data onto it by matching the scales (NCAR looks like its in 3 or 4 year steps)

      I allowed a generous 0.2ºC warming from NCAR 1970 – RSS 1979.. and this is the result.

    • Gypo O'Leary says:

      Policy? Please explain what authority the US Government has under the US Constitution to try to control the planet’s temperature?

    • daves says:

      So if they chop down a tree that was shading a weather station, you don’t think they should account for that in their measurements?

  3. Steve Case says:

    You know what Tony? you can show them R²=0.99 or any other aspect of what is commonly known as the “Duck Test” and the answer is going to be, “We did an honest assessment and that’s the way it came out, here are our PhDs that say that we did.” Sorry to be pessimistic, but draining this Trillion Dollar swamp isn’t going to happen over night.

    These people will stop at nothing. I read earlier today that members of the electoral college are receiving death threats if they don’t cast their vote for Hillary.

    http://www.infowars.com/more-electors-get-death-threats-from-hillary-voters/

    • Frank K. says:

      Rhetorical question: I am an average voter from the midwest who “held my nose and voted for Trump”. Today, I see violence, mocking, foul language, and bad behavior from the unhinged left in this country over the defeat of HRC (and Democrats in general). Am I (a) more likely or (b) less likely to feel validated about my choice?

        • Cindy Wilde says:

          The lady on the left… appropriately… is a Muslim Brotherhood member. Eight years in the White House, and the MSM just cannot bring themselves to expose the Obama administration for what they really are…. Communists !!!

      • Oscarphone says:

        Obviously those violent “protesters” are telling you that you made the right decision.

      • Gail Combs says:

        Frank,

        If you want validation here it is in SPADES!
        —Remember all the millions of $$$ Hillary took from Saudi Arabia and Quatar KNOWING they fund ISIS? “….bring pressure on the governments of Qatar and Saudi Arabia, which are providing clandestine financial and logistic support to ISIL and other radical Sunni groups in the region….” — Podesta emailid 3774

        ….In the Oh S…T category…

        With Malicious Intent – Obama’s Homeland Security Shuts Down Aerial Surveillance of Southern Border…

        In what appears to be a transparent effort to allow unchecked border crossing in the final two month of his presidency, President Obama’s DHS has shut down the aerial surveillance program. Texas Governor Greg Abott goes one step further saying President Obama is doing everything he can to “open the border” for illegals…

        It is not the Hispanics I worry about.

        FBI: 7,700 Terrorist Encounters in USA Last Year

        Smuggling Network Brings Aliens With Terrorist Ties Across U.S. Border

        Cartels, Corruption & Terrorism — An Investigation on the Mexican Border

        Cartels, corruption and terrorism have ignited a major security threat on the Mexican border. Islamic terrorists are training in southern border towns near American cities and have joined forces with Mexican drug cartels to infiltrate the United States. Judicial Watch spent the year investigating this national security crisis and interviewed local, state and federal law enforcement officials as well as military sources on both sides of the border. Our reporting confirmed that ISIS has a training cell just a few miles from El Paso, Texas in an area known as “Anapra” situated just west of Ciudad Juárez in the Mexican state of Chihuahua. We also verified that Mexican drug cartels are smuggling foreigners from countries with terrorist links to stash areas in a rural Texas town called Acala. Judicial Watch also reported the latest development in a Federal Bureau of Investigation (FBI) cover-up involving a narco-terror ringleader with ties to ISIS and Mexican drug cartels….
        (wwwDOT)judicialwatch.org/blog/2016/06/cartels-corruption-terrorism-an-investigation/

        Here Are the 190 US Cities Obama Selected to Dump Muslim “Refugees”

        …Barack Obama has allowed an influx of 100,000 Muslim immigrants a year into the United States. However, these immigrants are not being properly screened or vetted to protect national security.

        The State Department has released a list of 190 cities in the U.S. that these immigrants can go to. The full list can be seen below….
        conservativetribune(DOT)com/190-us-cities-muslim-refugees/

        A lot in Arizona, California, Texas, Colorado, Florida…. most states are seeded with ‘refugees’

        Syrian ambassador to India says that over 20% of refugees to Europe may have links to the Islamic State

        The Gateway Pundit reported back in 2015, SHOCK POLL: Third of Syrian Refugees ISIS Sympathizers, 13 Percent Support

        A poll released in November but ignored by the mainstream media shows a third of Syrian refugees do not want the Muslim terrorist group ISIS defeated. The survey results buttress concerns by the dozens of U.S. governors who have announced opposition to President Barack Obama’s plan to import 10,000 Syrian refugees over the next year.

        The poll shows thirteen percent of Syrian refugees have a completely positive opinion of ISIS with another ten percent having mixed feelings on the terror group, suggesting that nearly one quarter are open to recruitment by ISIS….
        The survey result for the other Arab countries show similar levels of support for ISIS… even more supportive of ISIS than the Syrian refugees, are Palestinians.

        The survey shows twenty-four percent of Palestinians have a positive view of ISIS with another thirty-six percent only having a somewhat negative opinion of ISIS. The survey also shows Palestinians as the only group where less than fifty percent (48) support the defeat of ISIS .
        (wwwDOT)thegatewaypundit.com/2015/11/shock-poll-third-of-syrian-refugees-isis-sympathizers-13-percent-support/

        • MSimon says:

          Drug cartels are a self inflicted wound. They are caused by Prohibition.

          Quite a few Republicans like Prohibition.

          It seems like they never heard of Alcohol Prohibition. Pity.

          • ADStryker says:

            Unprotected borders are a self-inflicted wound.

          • MSimon says:

            Well we had well enough protected borders at the time and still couldn’t keep alcohol or gangs out of America.

            Believing Drug Prohibition can work is in the same category as believing Gun Prohibition can work.

          • dice royal says:

            Really booze versus Heroin, Coke, Meth, X, and the rest. Covers it

          • david says:

            you do realize PROHIBITION was done by the ” PROGRESSIVES” ie demoCRAPS……ou need to learn history before posting MORON

          • Sharin says:

            Your post is a self-inflicted wound….

          • Mike Smith says:

            Yeah these unprotected borders are killing us! I live in a border state, and all these Canadians that are freely allowed to pass back and forth are clogging up our roads, and taking up vital resources meant for red blooded, white skinned Americans.

          • Gonzo says:

            msimon, Yeah lets make meth, cocaine, ecstasy and heroin legal. What a dope

          • AndyG55 says:

            We could also make murder, rape, torture etc legal..

            That way no-one would be arrested for anything and we could dispense with building jails etc.

          • Prohibition served the Glucose Trust, precursor for 97% of ALL alcohol consumed in These States. Clark Warburton produced graphs like Rudy’s showing how prohibition destroyed the economy and Herb Hoover was the last Grand Old Prohibitionist elected for 24 years. German heroin sold briskly because beer was a felony, and that helped finance Christian National Socialism “over there.”

          • Ron says:

            Yes. Some countries such as Portugal are learning. In the US the war on drugs is like religion. You can’t question it. We’ll be the last to learn.

        • Jim says:

          The prohibition argument is too simplistic. The hard drugs such as Cocaine (mostly condensed forms such as Crack) and Heroin are highly addictive and in the case of Heroin one “experiment” leads to a lifetime of addiction with a high social price of crime unemployability etc… While alcohol is a destructive drug in many aspects it does not have the same addictive powers but for the 10% of the population that are genetically pre-disposed to alcoholism. I’m not a fan of prohibition however there is a strong argument for fierce enforcement of Class X felonies based on heroin’s addictiveness. In short possession of personal quantities should have mandated treatment, intent to deliver severe consequences.

          • Cocaine is not the least bit addictive in a medical sense. Consider also that cyanide, arsenic, pistols and gasoline are legal. Yet when was the last time you saw any of those for sale in a convenience store vending machine?

        • Sam Pyeatte says:

          Obama and his crew are committing treason. All the people sneaking across the border like snakes must be deported when Trump takes office.

        • jerry snaper says:

          Obama is STOCKING them

          “STOCKING” Like when a
          farmer stocks a pond with bass or he stocks a field with quail. Obama is
          “STOCKING” this country with Muslims and other undesirables knowing
          full well that they will multiply like rats and wild hogs AT TAXPAYER EXPENSE
          and cause mayhem forever into the future of this country.
          Could there be any more proof that Obama hates this country.

          • Mike Miracle says:

            The goal is to inundate the country with diametrically opposed populations.
            This results in chaos and infighting.
            Chaos and infighting provokes martial law at least, and population reduction at most.
            Martial Law and Population infighting invites the world government installation here using UN troops. After all, we are apparently incapable of governing ourselves.

            It is the planned integration of the biggest obstacle to a world government and serious population reduction.

            So its not Obama “hates” America, its Obama is the front man for the implementation of a world government based on Chinese democracy.

      • Stan says:

        Thank you, Frank. I suspect even good people who voted for Hillary (hard to imagine but I know they’re out there) have to be looking at these savages in the street and wondering why so many losers are so upset?

        I can’t see how all this whining and squealing is anything but a net loss for these savages.

      • Marc Webb says:

        Is there a third choise?

      • Ann says:

        More importantly Frank.
        Do you understand that these people are Utopian Socialists who have now “progressed” to advocating violence through surrogates towards those who stand in their way?

        These Frank… these are Communists.
        In our own country. In our houses. In our schools. In the minds of our children.

      • Roy says:

        Frank, You held your nose because you have been watching the media beat up the guy for the past year. Is Trump really that bad? He took no money from fat cat donors, is beholden to no one, loves America and Americans, will (finally) fight radical Islam, wants to (finally) close the border, protects are 2nd Amendment rights……

      • GIVEMEFREEDOM says:

        I never saw Hitllary wearing (warming climate) pant suits or apparel that indicated warmer weather was on the way.
        Your vote is , (a) validated.

      • Kevin says:

        The flaw in your question is, why would anyone give a rats rear end about being “validated” by the Left and their media?

      • Kevin Turner says:

        We can’t tell you how to feel…that’s the job of the left.

    • Gail Combs says:

      More info on the election steal attempt.

      ….BuzzFeed reported Thursday that the #NotMyPresident Alliance, a national anti-Donald Trump protest group, has released the personal information of dozens of Electoral College members in states that voted Republican.

      A spreadsheet distributed to supporters Wednesday included the electors’ personal phone numbers, addresses, religions, races, genders and candidate preference.
      The group hopes its members and citizens around the country will contact electors and pressure them to change their vote from Trump….

      (Sorry link blocked)

      Most worrying:

      Clinton-backers are targeting roughly 160 Republican electorates in the 15 states that Trump won and don’t have laws bounding the electorates to the winner: Arizona, Arkansas, Georgia, Indiana, Iowa, Kansas, Kentucky, Louisiana, Missouri, North Dakota, Pennsylvania, Tennessee, Texas, Utah and West Virginia.

      The upside:
      The new Congress is seated the first week of January 2017 on the 4th.
      WHY HILLARY CLINTON CANNOT STEAL THE ELECTION FROM TRUMP – HOW THE CONSTITUTION AND TRUMP’S LANDSLIDE ELECTORAL VOTES WOULD STOP ANY STEALING!

      ….After the Dec. 19 vote of the Electoral College meeting in the individual states, the ballots are counted and the results are transmitted to a joint session of Congress which is held on Jan. 6th. So, Congress knows the results of the Electoral College vote from Dec. 19 on.

      When Congress meets in joint session, it is usually a mere formality of accepting the votes of the states. So, in alphabetical order, the state results are presented. If there is an objection to the results – for example if election fraud was alleged, or coercion of an elector was alleged – this is the time when that is decided: Members of Congress can object to any state’s vote count, provided the objection is presented in writing and is signed by at least one member of each house of Congress. Then Congress would immediately adjourn its joint session and return to their individual chambers to debate and vote on each objection. After that vote, the joint session would be resumed.

      If the objection is rejected, then that state’s vote count stands as presented to Congress. By this means, the entire deliberative weight of both houses of Congress can be thrown at any issue that may violate the sanctity of the vote for President and Vice President of the United States of America. Yes, Congress would actually decide. And since the new Congress will still have a Republican majority in both houses, the ultimate outcome will – without question – be that Donald Trump will be declared the official winner of the 2016 election on that day….

      I am very afraid the ‘civics’ lesson administered in December and January, ESPECIALLY if enough electors turn tr@itor to ‘elect’ Hitlery is going to make the current ‘protests’ look like a walk in the park.

      Give the scope of the problem, perhaps Trump will need to activate the mythical temporary tent cities/F E M A camps for the detention and jailing of all the ‘protestors’ for the next decade or two. He can always put Joe Arpaio in charge of a new Tent City jail in the desert southwest. (GRIN)

      These snowflakes need a good hard dose of reality and I really really hope several college profs get caught red handed in the organizing of the demonstrations/protests. So far they have had protected status but no more.

      MORE POPCORN!

      • Tony says:

        My 22 y/o daughter is acting like she has a right not to be offended. That worries and hurts me.

      • Dave says:

        Don’t worry about the electoral college. Regardless of how the electoral vote it must be certified by the Senate. If the Senate sees that there is influence from outside sources they will simply not certified. It then goes to the House of Representatives who will select the president. I think we all know how that will go.

    • Dave says:

      Don’t worry about the electoral college. Regardless of how the electoral vote it must be certified by the Senate. If the Senate sees that there is influence from outside sources they will simply not certified. It then goes to the House of Representatives who will select the president. I think we all know how that will go.

  4. FistdeYuma says:

    The biggest problem in the world today is that Liberals believe their own lies.

  5. CashMcCall says:

    Liberals Cheat. Look at Hillary in the Presidential debates. Not just once but multiple time with both Trump and Bernie. So quite naturally NOAA the weather monopoly cheats too.

  6. dick says:

    Lies, damned lies and statistics.

  7. Chris Cecil says:

    Thanks for revealing the truth during an era that is so distorted by lies that it is difficult to ferret out the truth amidst the vast media malaise.

  8. roger alies says:

    Where did you get your data Tony. Here is a graph from NCAR

    • AndyG55 says:

      This Peter Carter guy must be one of the most BRAIN-WASHED, GULLIBLE and IGNORANT people on the planet !!

      The GISS temperature FABRICATION bares absolutely ZERO resemblance to reality, anywhere !!

      All you are doing is marking yourself as a base level moronic idiot.

  9. a p garcia says:

    I am a retired lab scientist who did environmental work. A mistake that people make is assuming that all thermometers are accurate. I have seen lab grade thermometers off by as much as 2 degrees. The list goes on from there.

    • ADStryker says:

      Not to put too fine a point on it, but so what? Are you saying that NOAA is assuming, a priori, that all thermometric measurements over the last several decades are systematically in error and therefore are using their flawed CO2 model to correct the measurements? Isn’t it far more likely that any measurement errors are approximately zero-mean over the years, rather than being suspiciously correlated to NOAA’s CO2 model?

      • MSimon says:

        More likely he is saying that any “warming” inside the margin of error is not significant.

        • Andrei Bilderburger says:

          He’s just telling the truth. There are more sources of error than you can shake a stick at, and everyone tries to pretend they aren’t there and hopes they go away.

          Realistically, a lot of experimental work is garbage because of this, a lot more is garbage because of overlooked systematic errors (e. g. thermometer on side of light colored building, reads higher than air temperature due to direct and reflected radiant load).

      • Michael Jankowski says:

        Measurement errors would likely reflect themselves as zero-mean over a long period of time, yes…but having a remarkable trend upwards with time like that? And these revisions are being made year-after-year. How many times can you revise what the temperature was in 1935?

        FYI, it’s not “NOAA’s CO2 model.” It’s actual measurements.

    • D Lange says:

      1. 2 degrees out of how many? What’s the error percentage. What are you checking them against that you know is reliable to measure against if “lab grade” is unreliable?
      2. Unless NOAA is running around with a set of calibrated thermometers and checking all of the rest against them, how do they know how much to “correct” the actual data by?
      3. What is the trend that the actual data shows?Even IF there is measurement error present, you could still find useful meaning in the trend, since the error will generally be of the same magnitude. And the trend is definitely NOT going up. Not without “correcting” the data.

      • D Lange says:

        And lastly, what accounts for all the data points NOAA has where there is a TOTAL lack of measuring equipment (think Africa, Middle East, and southern hemisphere oceans).

    • bob dave says:

      Most of the temp measurements come from calibrated airport thermometers, since airports have existed. Calibration is done about every 6 months. The raw data was and is good.

      • Steve Fraser says:

        Ah, and what is the UHI adjustment at the airports, and how about the vast sections of the land surface which have no thermometers for hundreds of kilometers?

    • Gail Combs says:

      I was a QC lab manager and yes I have seen thermometers off that much too.

      That problem is taken care of by periodic checks, replacement as needed and careful notation. The people writing the instructions back in the late 1800s (1892 — Instruction Manual for Observers) were well aware of the problem.

      They were also aware of error and reported the commonly used thermometers were good to +/- 0.5 F with a speciality thermometer , the ventilated thermometer invented by Assman at Berlin in 1887, good to 0.1 F. From a meteorology textbook from 1918 by Willis Isbister Milham. He also reported continuous readings by a continuous thermograph record…. (Richard Freres thermograph)…
      Milham goes on to say

      The observations of temperature taken at a regular station are the real air temperature at 8am and 8pm, the highest and lowest temperatures of the preceding 12 hours, and a continuous thermograph record…. (Richard Freres thermograph) ….these instruments are located in a thermometer shelter…

      If a good continuous thermograph record for at least twenty years is available, the normal hourly temperatures for the various days of the year can be computed….

      “the average temperature for a day is found by averaging the 24 values of hourly temperature observed during that day” ….

      The NOAA adjustments have nothing to do with instrument error of that type and the corrections do NOT use the carefully made notes. Instead the lazy a$$es, use a computer to ‘adjust’ all the readings based on ideas they pull out of their rear ends.

      I addressed the history aspect and Tony and Paul Haywood have addressed the other aspects over the last several years.

      Here are a couple examples.

      Willis Isbister Milham states in his 1918 texbook:

      When a maximum thermometer is not read for several hours after the highest temperature has occurred and the air in the meantime has cooled down 15° or 20°, the highest temperature indicated by the top of the detached thread of mercury may be too low by half a degree from the contraction of the thread….

      However NOAA did the opposite. They lower the old readings because of a TOBS (Time of Observation) adjustment. Zeke Hausfeather of BEST data set said over at Judith Curry’s(/2014/07/07)
      “….Observation times have shifted from afternoon to morning at most stations since 1960…” So COOLING would make the readings too low by half a degree from the contraction of the thread in the min max liquid in glass thermometers.
      …………

      Zeke also mentions the shift from LiG (liquid in glass) to MMTS in the 1980s and ” a very obvious cooling bias in the record associated with the conversion of most co-op stations from LiG to MMTS in the 1980s…”

      Yet notrickszone reports the findings of a carefully conducted test by

      …German veteran meteorologist Klaus Hager, see here and here. The test compared traditional glass mercury thermometer measurement stations to the new electronic measurement system, whose implementation began at Germany’s approximately 2000 surface stations in 1985 and concluded around 2000.

      Hager’s test results showed that on average the new electronic measurement system produced warmer temperature readings: a whopping mean of 0.93°C warmer. The question is: Is this detectable in Germany’s temperature dataset? Do we see a temperature jump during the time the new “warmer” system was put into operation (1985 – 2000)? The answer is: absolutely!…
      http://notrickszone.com/#sthash.Es2IbMZo.sAqMRsUB.dpbs

      So with just those two wrong way adjustments they change the data by more than 1 °C and that does not get into dropping rural stations and smearing the data from airports and cities for 1200 kilometers.

      • Dave N says:

        “The NOAA adjustments have nothing to do with instrument error of that type and the corrections do NOT use the carefully made notes. Instead the lazy a$$es, use a computer to ‘adjust’ all the readings based on ideas they pull out of their rear ends.”

        One day I might actually look at the code that Gavin and Nick Stokes have provided links to. I seem to recall that some (or most?) is in Fortran, though.

        Combine that with the divergence from the satellite record, and the sheer hubris from alarmists , it doesn’t instil a lot of motivation in me to look at it myself; I’m hoping that someone else will do it, and just publish the highlights (or lowlights)

        • Gail Combs says:

          Dave N,
          It came out in discussions with Zeke several years ago. The Best temperature set aligns with the NOAA set. That is one of the reasons for Frank Lansner The Original Temperatures Project

          “… the BEST team adds around 0.7 K of warming to the Pecs data. BEST use a so called “Regional Expectation” for all countries i have analysed, and change original data so they approach these expectations…..

          Best claim that UHI plays no role. But remember results for all 11 countries analysed; First BEST first avoids the cold trended stations (by deselecting or warm-adjusting OAS stations) and THEN they compare the remaining warm trended OAA stations with city stations. It is on this basis that BEST concludes that UHI is not an issue in climate data.

          Explanation of OAS and OAA.

          Methods

          OAS and OAA locations – how geography determines temperature trends.
          For all areas analysed (almost 20 countries by now) we see a large group of stations with warm temperatures trends after 1930 (“OAA” stations) but also a large group of stations with very little or no warm trend after around 1930 (“OAS” stations).
          The classification of OAA versus OAS simply depends on geographical surroundings.
          [ILLUSTRATION]
          In the writing “RUTI Coastal stations” (based on GHCN V2 raw) I found that Non-coastal temperatures (blue graph) were much more cold trended from around 1930 than the Coastal trends Fig 4
          But Non-coastal stations can be divided further into Ocean Air Affected stations (“OAA”, marked yellow) and then Ocean Air Shelter stations (“OAS”, marked blue). OAS areas thus have some similarities with valleys in general, but as illustrated above, the OAS areas cover a slightly different area than the valleys.

          In general I have aimed to find average OAA temperature trends and average OAS temperature trends for the areas analysed. For each country analysed I have made comparison between national temperature trends as published by the “BEST” project and then the OAA and OAS temperature trends from original data. I want to know if BEST data use both the warm trended OAA data and the more cold trended OAS data. In addition, I have made comparisons of ECA&D data versus original for many countries and also HISTALP data versus original.
          More info can be found on:
          http://hidethedecline.eu/pages/posts/original-temperatures-introduction-267.php

          Franks OAS and OAA locations would be those affected by the AMO vs those not so affected. It will be interesting to see what happens to the Ocean Air Affected stations (OAA) as the Atlantic enters its cool phase.

          Also if you want to separate out SOME of the confounding of the temperature record by the AMO and PDO you would look at ONLY the Ocean Air Shelter stations (OAS).

        • cdquarles says:

          I downloaded a couple of different GISS archives a few years ago. Yes, it was in Fortran, some 77 some 95. I tried to compile it on my own machine and even set up multi-boot systems to take compiler issues into account. I could never get it to compile and got tired of trying to figure out why. I started porting it but gave up. I doubt any serious QC of any kind was done on it. It compiles and runs on a system that I can’t get my hand on to check.

          [Personal opinion, FORTRAN and its later versions 77/90/95, when programs are written correctly, are easy to understand. Hint FORmula TRANslator. C and its variants give me fits. I’d rather read APL than C. And remember, the first compiler ran in the mid 50s on machines far less capable (in speed and memory capacity) than the machine I’m typing this on, today.]

    • Harry says:

      not to mention the places where ground temp meters are placed,,, often by those with an agenda,,,, rather than a search for accuracy,,,
      one of the most common is to place a temp meter in the “exhaust” of a heating/cooling unit.
      IMHO,,, the entire effort is an attempt to get a “carbon tax” imposed upon the industrialized world,,, (under the aegis of the UN, of course),,, to fund “globalist” notions of redistributive (read: “comintern”) efforts

    • Jack Coyote says:

      Doesn’t help if the thermometer is placed in the middle of a 30 acre black-topped parking lot in the middle of July.

  10. Gail Combs says:

    Tony, this group of charts is the best work you have ever done.

    Any honest science, math or statistics major would take one look at this and have major questions about the NOAA adjustments.

  11. AndrewS says:

    Get ready for a flood of comments. This just made DrudgeReport!

  12. Edman17 says:

    Tony,

    I have been a big fan of your work since I saw the July 2016 presentation that you gave to Doctors for Disaster Preparedness (on YouTube). That was the first time that I saw the parity plot of adjustments made by our government agency to historical temperature data vs. actual CO2 measured in the atmosphere. Thank you for reviving that plot in the current posting. It explained everything for me.

    I showed the YouTube presentation to my wife, who has basically thought that I was crazy for being so skeptical/obsessed about the climate change narrative that never rang true. After the presentation, she actually understood, but still could not believe that anyone would deliberately alter the data for no good reason. I tried to explain that the supporters stand to make billions in profit just by being in the right place on the trillions of money flow that the climate change narrative produces.

    Good illustration of the skimming that will happen: http://www.unepfi.org/fileadmin/documents/FinancialInstitutionsTakingActionOnClimateChange.pdf, see page 6. It is also stunning to see how many institutions have invested money in the noble cause. Hope no one gets hurt like in the Madoff thing.

    Sadly, a lot of well-meaning people who basically believed the alarmist hype that has gone on for so long will simply not believe that it could have been a hoax. There will be a natural inclination to believe whatever explanation is presented by NASA/NOAA. My wife has already forgotten what was in the YouTube presentation. I am back to having to
    explain why I persist in watching the fray. I still think that July 2016 YouTube presentation is the most effective vehicle that I have seen for persuading non-technical folks that might be on the fence.

    Part of me thinks that just waiting for some stunning global cooling to happen might be the easiest and least painful way to get the world out of this mess. In the mean time hopefully we can at least stop the waste of US taxpayer funds in this area.

    • George Jettsion says:

      I went to that UN “financial institutions taking action” document – and immediately noticed that their “faucets” are being turned in the wrong direction.

    • Robert Austin says:

      Here in Canada our hopes for sanity in this climate change nonsense lie with Trump. If the change in political climate encourages some of the skeptical scientists to come out of hiding, we may finally have a balanced and scientific debate on the matter. Our prime minister, Justin Trudeau, is a true believer who’s chief adviser is the former president of WWF Canada so one knows what he whispers in Trudeau’s ear. Trump is not subtle so perhaps Trudeau will get the message that our good neighbour is the elephant compared to the Canadian mouse.

    • 3d says:

      Where can I find that you tube video? I have been trying to learn more on both sides of this argument. I was visiting a site the other day that seemed to refute most of the “skeptics” arguments that I had previously used to counter the conventional wisdom that man made climate change is fact.

      Site I was reviewing was: https://www.skepticalscience.com/argument.php

      Disclaimer: I am a layman here. If I am out of my league let me know.

    • Well said. I was once terrified of all things nuclear. Jerry Pournelle and the 1977 Cohen article in Sci. Amer. on Radioactive Wastes from Fission Reactors set me straight, and Dr. Petr Beckmann, also an ally of Doctors for Disaster Preparedness, finally made all the data click together. Beckmann warned me not to engage the climate fraudsters because in such a complex field they would come up with an endless succession of red herrings above and beyond my incomplete grasp of physics. But the team of Steven Goddard and Tony Heller has managed to take on all of the Disciples of Disinformation in a rout for which I am grateful.

  13. bobjay says:

    How long must we live with this faux science [fiction] of man-made global warming, climate change and climate disruption?
    It’s been proven false and untrue.
    But the Goebbels effect still continues.

    We are now paying for cap and trade carbon releases and other ecological fantasies.
    How many more snowflakes must we convince that they have been duped by their progressive liberal pony head teachers?

  14. Noaa science is 50/50..Half political science, half science fiction…

    • Stan says:

      William I love your reply. Science is now political activism. My stumbling upon this web site is a good thing as I can see I’m in pretty good company with my limited knowledge being essentially congruent to what I see here. I know it’s much more complicated, but this graph says the most to me when people talk about “record temperatures”. It tells me that Earth has been hotter than it is now several times in recent history and went back down all by itself- no corporate welfare and no Barack Obama! Shocking, isn’t it?

      • I couldn’t read the source. Izzat the Journal of Irreproducible Results in the fine print?

      • AndyG55 says:

        That graph proves CATEGORICALLY and ABSOLUTELY that CO2 does not drive temperature in any way what-so-ever.

        At no point was peak CO2 able to maintain the temperature.

        In fact, peak CO2 was ALWAYS right at the start of a cooling trend.

    • ARCEY BROWN says:

      THAT’S GOOD HALF POLITICAL SCIENCE HALF SCIENCE FICTION
      HOW ABOUT HALF POLTICAL SCIENCE FICTION AND HALF
      SCIENCE FICTION . THE IRONY IS IT IS ALL SO REAL .

    • michael says:

      Half PC and half BS. 100% false.

  15. Dale Buckmaster says:

    Engineers always can make the data fit the answer. You tell me what the solution needs to be and I’ll make sure the data backs it up. LMAO!

  16. Andrei Bilderburger says:

    This is treason. It’s an attempt to provide justification for a coup d’etat under the guise of protecting the environment.

    It has to be prosecuted as treason and punished with death sentences for all the climategate conspirators.

    Nothing less has any hope of solving the underlying integrity problem.

  17. IsItSomethingISaid says:

    Government first.
    I am 100% percent pro “climate change” controls, but government first. Only after those of government give up war, terror, and waste, may they ask me to participate in their controls. Until then, the only “carbon” I intend to control is that which builds up on my weapons at the range.

    Ditto guns: They can control my guns when they have their guns under control.

    An American citizen, not US subject.

  18. George Jettsion says:

    At some point this “Theory” or “Hypothesis” of global warming will have so much contrived data as to refer to it as a “hoax” or “conspiracy” or “racket”.

  19. Johnmann says:

    Trump Train has NOAA on its list of stops. All the phony-a$$ scientist fakers, who have been fraudulently manipulating data all these years, will be forced to own up to their global warming FRAUD. Just like the government financed solar energy industry, the global warming myth enables left-wing politicians to funnel money into 3rd World accounts, and other Democrat lib-prog slush funds. It’s the biggest money laundering operation in the world… and Trump will put a stop to it.

    Trump Train’s a-comin’… AALL ABOOARD!!!

  20. Leonard Itner says:

    I read that a blogger’s belief in global warming/climate change has to do with the fact that in school the teacher had them fill a large soda bottle with CO2, shined a light on it and the temperature rose more than the bottle that just had air in it.
    Another person reacted with amazement and asked for more details so they could show others.
    I started to write a reply, then figured it was useless to even attempt to explain the faults in their method, I knew the information would be too much for them to comprehend.
    Thankfully with the distrust of the media, we have some hope, though I fear the indoctrination of the children.

    • cdquarles says:

      If this was done, then they had to shine light that had the correct spectrum to do it. [And yes, shining the right kind of light on a bottle containing carbon dioxide will have the temperature of the gas inside the bottle go up, provided no other means of energy flow out are allowed. Extrapolating from that to the open atmosphere (which can expand and has mass flows within it) is something my chemistry professor would say, “Don’t make vast conclusions from half-vast data.”; and that lesson has stuck with me now more than 40 years later.]

  21. mike says:

    The warming should the sea rise,but castles and bridges do not show sea level rise. Sidon has been inhabited for 4,000 years with no change in sea level. When the sea level rises, someone will surely notice.

  22. CrazyHungarian says:

    If you have to adjust historical measurements, that simply means that those measurements should not be used. The only credible way to have an accurate historical model is to start over from scratch, collect for a few hundred years and then analyze your dataset.

    • RokShox says:

      If the magnitude of the purported adjustments is the same size and direction as the purported signal, you don’t even have data to begin with. You have garbage.

    • Gail Combs says:

      Actually the correct way of treating data is not to ‘adjust’ but to put error bars on the data. This is Ernest Beck’s graph of the CO2 measurements that illustrates what I mean. (Note that the CO2 fraction is not what is portrayed in the media either.)

      • AndyOz says:

        That is first time I’ve seen that graph, Gail.
        Makes empirical sense.
        I didn’t know there was a 1940 CO2 blip.
        Is the data a derivation from another dataset or was it actual CO2 measurements in atmosphere?

        • cdquarles says:

          From memory, Ernst Beck analyzed wet chemistry measurements. I don’t know if these were his only or a combination of his and historically reported measurements or a meta-analysis, if you will, of reported wet chemistry measurements. The first ones were definitely wet chemistry in nature. In my mind, all such measurements should be compared to wet chemistry calibration with the proper error analysis and propagation attached.

          Also know that every measurement has an inherent error. Instrumenting a system changes the system. The trick or key, is knowing how the errors occur and how much uncertainty can be accounted for.

        • Gail Combs says:

          Andy,
          I think the increase in error was because of the switch from wet chemistry methods to measurements using Infrared spectrophotometers in the 1960/70s The accuracy sucked bid time, at least with the instrument I tried to use to measure liquids. Jaworowski found the same thing.

          At the Mauna Loa Observatory the measurements were taken with a new infra-red (IR) absorbing instrumental method, never validated versus the accurate wet chemical techniques. Critique has also been directed to the analytical methodology and sampling error problems (Jaworowski et al., 1992 a; and Segalstad, 1996, for further references), and the fact that the results of the measurements were “edited” (Bacastow et al., 1985); large portions of raw data were rejected, leaving just a small fraction of the raw data subjected to averaging techniques (Pales & Keeling, 1965).

          The acknowledgement in the paper by Pales & Keeling (1965) describes how the Mauna Loa CO2 monitoring program started: “The Scripps program to monitor CO2 in the atmosphere and oceans was conceived and initiated by Dr. Roger Revelle who was director of the Scripps Institution of Oceanography while the present work was in progress. Revelle foresaw the geochemical implications of the rise in atmospheric CO2 resulting from fossil fuel combustion, and he sought means to ensure that this ‘large scale geophysical experiment’, as he termed it, would be adequately documented as it occurred. During all stages of the present work Revelle was mentor, consultant, antagonist. He shared with us his broad knowledge of earth science and appreciation for the oceans and atmosphere as they really exist, and he inspired us to keep in sight the objectives which he had originally persuaded us to accept.” Is this the description of true, unbiased research?

          The annual mean CO2 level as reported from Mauna Loa for 1959 was 315.83 ppmv (15 ppmv lower than the contemporaneous North-European average level), reportedly rising steadily to 351.45 in January 1989 (Keeling et al., 1989), by averaging large daily and seasonal variations (the significance of all their digits not justified), but still within the range of the North European measurements 30-35 years earlier. Hence a rise in global atmospheric CO2 level has not yet been significantly justified by validated methods and sound statistics.

          http://www.co2web.info/ESEF3VO2.htm

          (I am a bit better at chemistry than I am at physics.)

  23. Robert Wagner says:

    There are serious problems with this CO2 and Temperature relationship. The “adjustments” are made to make temperature more linear. They have defined AGW as a linear relationship between CO2 and Temperature. Problem is, the absorption of energy by CO2 isn’t linear, it is logarithmic. The model isn’t Temperature = f(CO2), the real model is Temperature = f(Log(CO2)). The fact that they are manipulating the data to make it linear proves it is a fraud. The real relationship isn’t linear, but because CO2 is essentially linear, and they’ve sold the Temperature = f(CO2) they have to manipulate the data to make that model work.
    http://clivebest.com/blog/wp-content/uploads/2013/02/radiative-forcing.png

    Here is another problem. This is a graph of the IPCC Models, showing the actual data and forecasts. The real data from 1982 to about 1998 is real data and real output. Clearly the data and output is CURVILINEAR. The Forecasts are then LINEAR. What kind of model takes curvilinear data and produce a linear forecast? This once again is fraud. They are trying to make something linear which neither the real data or physics supports.
    https://i2.wp.com/www.drroyspencer.com/wp-content/uploads/CMIP5-90-models-global-Tsfc-vs-obs-thru-2013.png

    Atmospheric CO2 is essentially linear, its absorption of energy is not.
    http://www-das.uwyo.edu/~geerts/cwx/notes/chap01/mauna_loa_co2.gif

    • Jason Calley says:

      You are very correct that the absorption of IR by CO2 is logarithmic, but remember also that any small part of a logarithmic curve is very close to a straight line, especially as you get farther out on the curve. In the case of CO2, we are already quite a ways out on that radiative curve, so small sections of it can be pretty closely approximated as straight.

      As to your more important point that the current official graphs are fraudulent, ABSOLUTELY!

    • cdquarles says:

      Atmospheric carbon dioxide concentrations are an integrated system of various chemical processes that have different kinetics. The net effect looks linear as a first approximation.

  24. Donald Trump is a businessman used to the idea of turning a profit and strengthening the balance sheet. I can’t imagine him continuing to fund people (e.g. the EPA) who harm the economy.

  25. JackT says:

    Judicial Watch filed a lawsuit almost a year ago over this. Any news on that?

  26. Pingback: Massive Hole in Sun… | High Priority News

  27. ironhorzmn says:

    As a high school dropout all I have to go on is the two-decade record of NASA satellites and NOAA ocean sensors that shows no significant increase in global temperatures either in the atmosphere or the oceans. This is the case even with the alleged drastic increases in global CO2 levels.
    If AGW alarmists are trying to push some type of CO2 ‘forcing’ model on us the last two decades would kind of cast some doubt on that theory. Why then should we buy into it going forward?
    (I really am a high school dropout. If I’m mistaken about any of this I wouldn’t be surprised.)

    • AndyG55 says:

      You may think of yourself as a high school drop-out, but that probably means you weren’t indoctrinated into the AGW scam.

      What you say is completely correct, except that the alleged drastic CO2 rise is actually HIGHLY BENEFICIAL to all life on Earth.

    • Gail Combs says:

      ‘High school dropout’ has nothing to do with intelligence or knowledge or ability and as Andy said you managed to miss a lot of the brainwashing.

      Cornell Students Hold ‘Cry In’ in Response to Trump Win

      What manager wants to hire those two year olds in adult bodies?

      The last two lab technicians I hired were a carpenter’s apprentice and an army vet after I FIRED two chemists with masters degrees. I would not hire one of todays college grads to pick-up horse manure. Actually I have seen the horse manure ‘out smart’ them. The idiots couldn’t get it onto the shovel or manure fork.

  28. Pete Dosado says:

    NOAA? No! Not NOAA! Fake? No! Money involved? No!

  29. Pingback: MORE NOAA Temp Adjustments… | High Priority News

  30. Pingback: NOAA caught falsifying temperature readings to push MMGW

  31. Mark Moser says:

    Observations are made by stations using the same thermometer from the same observation point. Regardless of whether you’re at a state of the art facility or using a sling with wet and dry bulb thermometers, the data is consistently measured by the same source in the same place. The trend remains the same + or – the error rate at each reporting station, which is pretty hard to quantify and correct. In the end, it’s all about the trend and how you go about producing it.

    The error rate is made up of more than one factor. The law of probability would suggest thermometers would read lower half the time and higher half the time, within the error rate, so that’s a wash. Where and under what conditions temperature measurements are taken seem to me to be the real problem.

    Too often, observations are taken near the asphalt of a tarmac or with the thermometer in direct sunlight, by poorly trained people, thus skewing temperature trend upwards. This upward pressure on the trend is compounded by the proportionally high number of reporting station on or near airports constructed of concrete and asphalt. Almost all of these errors would result in higher temperatures being reported not lower ones.

    If you’re going to correct the data, it seem to me you’d need to go the other direction and adjust temps down. How does one justify adjusting temps up, while ignoring the consistent downward pressure exerted on the trend by this elephant-in-the-room error factor in temperature data collection?

    Of course, it’s all about the trend….

  32. michael leitch says:

    Where is the source data? Why should anyone believe graphs without a source?

  33. Vernon Germano says:

    Honest question, if AGW is settled science why keep funding research in the area? Seems a pure waste of money to fund research into something that is settled and undeniable. Perhaps we can use the money elsewhere now and not keep throwing at science that is no longer questionable.

  34. Williampenn says:

    Make America sciene-credible again. Clean out NASA and NOAA.

  35. OldOllie says:

    There is no context in which “hide the decline” can be construed to mean anything except “falsify the data.”

  36. Craig Storms says:

    Ha … 2 months ago the Fake News MSM was on fire with headlines they were going to Jail Climate Deniers …. Now we are going to #DrainNOAASwamp and after Trump makes them #ShowTheirWork …. It will be the Corrupt “Scientists” going to the pokie …. ;) #TrumpTrain

  37. Pingback: Massive Hole in Sun… – Curtis Ryals Reports

  38. Joel O'Bryan says:

    Anthro-CO2 Global Warming (GW) is better described as a hypothesis than a theory. A theory in science has significant supporting evidence which is lacking in the case of anthro-CO2 GW. Atmospheric CO2 has risen without doubt the last 30 years, but tropospheric temps have fallen behind GW prediction, as I know you are aware. So Anthro-CO2-driven GW is an unsupported hypothesis.

    • Gail Combs says:

      GoreBull Warbling = Money making SCAM.

      It does not make it to the level of a hypothesis since it has been proved incorrect over and over.

      The earth started out with a heavy CO2 fraction and no/little free oxygen so how do you explain the long term temperature trend toward cooling?

      • The “Consensus” explanation of the PETM and the subsequent cooling is based on the idea that volcanic CO2 caused the temperature rise and it took 200,000 years for natural sequestration of CO2 to kick in:
        https://www.wunderground.com/climate/PETM.asp?MR=1

        IMHO this is an absurd idea………if it were true, the much more rapid rise of CO2 in recent times would be causing a massive spike in global temperature. Given that global temperature rise has “paused” for ~23 years the theory that CO2 drives temperature is wrong. Now we need to figure out why.

        It is much more likely that you (Gail Combs) are right and the high levels of CO2 during the PETM resulted from the warming of the oceans caused by natural cycles such as postulated by Milankovitch.

      • Bill Illis says:

        Technically, even this chart from the warmers is a Scam. It was built to use the PETM as a scare tactic.

        The temperatures are miscalibrated and there is a long-term trend adjustment that is needed for the dO18 isotopes.

        This is what happens when you extend this chart farther back in time. +30Cs, +40Cs, no ice ages. Boiling oceans during snowball Earth.

        https://s15.postimg.org/nfoe66kvv/Zachos_2001_Miscalibrated_Temp_527_Mya.png

    • AndyG55 says:

      “Anthro-CO2 Global Warming (GW) is better described as a hypothesis ”

      a thought bubble… or baseless assumption.

  39. Steve O'Toole says:

    ManBearPig!!!! Totally serial!!!

  40. Scott R says:

    Why does the first graph start before 1900 and the last graph start after 1900? They should start on the same date.

  41. T Powell says:

    This is easy to correct – just start giving grants for global cooling research and make associated industries profitable.

  42. Mick Russom says:

    Dinosaurogenic Global Warming (DGW)

    The Jurassic period. O2 in atmosphere was 130% modern levels. CO2 was at 1950ppm, 5-7 times modern levels. The temperature was a whole 3 DEGREES C over modern times! Oh no! The Jurassic DGW, Dinosaurogenic Global Warming, shows that those Dinosaurs – with their Airplanes, SUVs, Coal Fire Plants and Cars and stuff, you know, those Dinosaurs and their DGW destroyed THE WHOLE PLANET!! With their DGW! Look, who wants 26% atmospheric oxygen? More air to breathe? Who wants that? And who wants more CO2 @1950 ppm, you know, to make all those plants and trees convert that CO2 into a higher O2! Who wants that! And we DON’T want the massive biodiversity of the Jurassic, no, we don’t want more plants and animals and trees, no.

    Any time period the warmunists want to “prove” there is AGW the warmunists just cherry pick ranges. And now I give the warmunists what the need on a silver platter – now they have the perfect example – the Dinosaurs and their horrible DGW (Dinosauric Global Warming) that destroyed the Jurassic… Wait, no, it didn’t, it was the best time for life on earth with 1950 ppm atmospheric CO2!

    Debt is Wealth. Ignorance is Strength. Freedom is Slavery. War is Peace. Cold is Warm.

  43. AC says:

    Since NOAA is OK with falsifying data, can we presume that the IRS is cool with fabricated data, too?

    A friend wants to know.

  44. McChuck says:

    The correct answers to the test are: 1. A. 2. Not Addressed. (Sorry about the spoiler. But can you see why? The answer is in my comments to the answer blog page.)

    You should always be on the lookout for graphs purporting to say something, when that’s not what they’re measuring. In this way, it’s a really good test for a science advisor. He should be able to recognize and point out PSB and category errors.

    I guess, in a way, his chief role should be to readily differentiate between ‘science’ and ‘science fiction’.

    I heartily approve of this test.

  45. MrFranks2u says:

    It would be interesting to correlate the temperature increase that has occurred since the 1980s with the rise of China’s industrial output and the increased pollution that they emit. The standards and performance in China are much less then the industrial world. I do not believe tightening standards beyond a certain point makes a difference, but is there a threshold standard that does. Of course the sun would probably still be the largest effect.At Keats we gat cheaper TVs which is what the global it’s want

  46. Morris Minor says:

    This scam is a part of the globalists’ agenda to control world trade and economies. There is nothing left thats believable in this administration.

  47. Robert Wagner says:

    What Donald Trump needs to do is create a Department of Scientific Integrity and Verification that applies double blind tests to the data and conclusions of any tax payer funded research and or research that will impact public policy. He should create an “Open Source” Temperature Reconstruction, that is tranparent and allows edits only when there is a verified and documented reason to “adjust” the data. Right now a handful of highly biased activists are allowed to make “adjustments” to fit their own personal agenda and models. No Open Source effort would ever accept “tricks” to “hide the decline.” The very fact that Michael Manns Hockeystick replaced the original IPCC Temperaure chart proves there is serious corruption going on in the IPCC and field of climate “science.”

    • Mike Schlamby says:

      No, what President Trump needs to do is get the federal government out of the business of funding “science”. It’s not a proper function of the federal government.

    • Gail Combs says:

      No More Departments!

      All a ‘Department of Scientific Integrity and Verification’ would do is give the Progressives another weapon to use against honest scientists.

      What is needed is a un-bias media and Trump is working on that. Trump got in the face of all the major media players with a good old fashioned behind the woodshed discussion about their ethics and way of doing business.

      http://nypost.com/2016/11/21/donald-trumps-media-summit-was-a-f-ing-firing-squad/

      H/T Larry Ledwick

      • Robert Wagner says:

        You have to have an oversite body for tax funded entities. I’m no fan of big government, and don’t want anymore of it than we need, but clearly without oversite, things have become unbelievably corrupt.

        • Gail Combs says:

          Robert,
          The oversight is called STOP FUNDING IT!

          If the research is privately funded then the people with the open wallets do the oversight.

          For those project that absolutely have to be funded by the gov’t there are already laws and oversight in place.

          For example on the state level:
          Virginia’s Attorney General Ken Cuccinelli’s lawsuit against University of Virginia and Mikey Mann.

          On the federal Level:
          United States House Committee on Oversight and Government Reform has jurisdiction over matters relating to government management and accounting, Federal civil service,…
          https://oversight.house.gov/

          U.S. Government Accountability Office (U.S. GAO)is the investigative arm of Congress charged with the auditing and evaluation of Government programs and activities. Read reports on use of public funds …
          https://www.gao.gov/

          Since it is the House of Representatives in charge, it means citizens can get together or even singly pressure their reps to DO SOMETHING. With civil servants you have zero leverage and they can do as they please.

    • Colorado Wellington says:

      Should the President create a new federal department to fight against other federal departments under his control?

      What a fantastic idea! :)

  48. MichMike says:

    The personal behavior of 1% of the U. S. population results in their CO2 footprint being 50 TIMES that of the other 99%. This means this small group is responsible for more than 33% of all U. S. CO2 emissions and were this group to only emit 25 times the average of everyone else, overall U. S. CO2 emissions would immediately decline 17%. Yet all the plans being implemented and proposed will allow this small group to continue their behavior unabated while financially hammering the lower income and middle classes, just for being alive. THAT is the emergency they speak of.

    • Mike Schlamby says:

      So?

      The chattering classes emit 50 times the volume of words (although not quite so much by weight) than the other 99%.

      Words have as much effect on the climate as CO2.

      The chattering classes should therefore shut up.

    • Latitude says:

      If this were really the “we’re all going to die” BS they hype…
      ..no country would be getting a free pass

      • Harold says:

        How on EARTH can you support such assertions. Apparently, we can’t even measure temperature correctly and we’re supposed to accept your unsupported assertions as true?? Perhaps you’re even right, but I don’t know how you might even measure such things. More computer models based on wild assumptions, maybe.

      • CheshireRed says:

        Exactly. Instead we’re told the correct ‘solution’ is to pay more taxes. Ahh, well that seems reasonable. It’s ‘the greatest threat facing humanity BUT if we just pay some more money to the nice bosses then it’ll not matter quite so much’. Just amazing.

    • Alan says:

      As others have said: I’ll start believing they (the “elites”) think there’s an emergency when they start acting like there’s an emergency.

    • This thing about paying more taxes so that our ruling classes can live better is about as lame as the Medieval church selling “Indulgences”.

      Man exploits man down the ages…………..the same old scams but with new names.

      • Gail Combs says:

        Camel,
        Over twenty years ago when I first started my small business and saved every single receipt, food included, I figured out the actual tax I paid. Sales tax, fuel tax, phone tax, property tax and all the rest.

        It came to 64.5% of my income. Then add in the 151 taxes on a loaf of bread meaning the cost of everything you buy is probably more than 1/2 tax (Pres. Reagan) and a mid income person in ~1985 was paying around 80% of their income in taxes!

        We just do not have anything more left to tax. That is why most people have less than $1,000 in saving and Obummercare combined with stagnant/declining wages is so devastating.

        It used to be when the serfs were taxed over 40% of their wealth they would revolt. That is why now there are hidden taxes and our taxes are taken before we see the money. That is why the government/corporate complex declared war on small business. You can not squeeze the last penny out of your serfs if they get their hands on the money before you, the government does.

        Get rid of ALL the hidden taxes and have just one combined tax paid at on December 31 by everyone and you would have a massive bloody revolt the next day.

  49. jon raitmon says:

    Early on in this “discussion” someone used the words national policy and temperature in the same sentence. That makes as much sense as having many of the Hoooleywood leaders elected to the Supreme Court. Better still, after all of the temperature liars are fired, NOAH should be placed under the direction of the Kalifornication-ia Gubbernor.

  50. Chris says:

    How should a casual observer reconcile your claims and charts in this post with the ones found at the link below? I am generally a skeptic, but don’t have the time or energy to figure out which is the real story. Perhaps you can help me and others understand how/why your conclusions differ from the conclusions in the article linked below.

    https://www.theguardian.com/environment/climate-consensus-97-per-cent/2016/feb/08/no-climate-conspiracy-noaa-temperature-adjustments-bring-data-closer-to-pristine

    • Latitude says:

      Chris, even your link says it….the latest adjustments from NOAA
      Keeping in mind, they adjusted temperatures that were only taken less than 15 years ago.
      So even 15 years ago…we couldn’t measure temperature correctly….otherwise why did they have to retroactively adjust it again?
      Bottom line…according to NOAA and their adjustments…we do not even know what the temperature is right now…
      …we will have to wait 10-15 years to see what they decide the adjustment will be

      In the mean time…..every past temperature measurement has been too warm
      …NOAA has had to adjust them down

      Which means it is not a record breaking year this year….because in 10 -15 years…we will know it was a lot cooler….when NOAA gets around to adjusting it

  51. Pingback: Massive Hole in Sun... -

  52. Pingback: Massive Hole in Sun... - ConservativeVoiceConservativeVoice — Your source for everything about conservatives! — News and tweets about everything conservatives

  53. Slash Tmp says:

    How is better measurements with more sensitive equipment factored into the calculations? For example digital instruments now vs mercury thermometers 100 years ago.

  54. Mike Turner says:

    The climate today is colder than it was in the mid to late 1800’s. In Mark Twain’s ‘Life on the Mississippi’, published in the 1880’s, he mentions Natchez, MS as being the northernmost location where oranges can be grown outdoors without protection. Today oranges are limited to south of New Orleans.
    In ‘The Escape of General Breckenridge’, a journal documenting General John C. Breckenridge’s escape through Florida to Cuba at the end of the Civil War, they mention collecting coconuts from abandoned homesteads on Merritt Island. Today coconuts are only found north to Jupiter Inlet, over 100 miles south of Merritt Island.
    When I was studying botany in Orlando in the 1970’s, the professor mentioned that there was a thriving Citrus industry in southern Georgia in the late 1800’s that was devastated by the cold snap of 1899. The growers then relocated to the area just north of Orlando, where they got devastated by the series of cold snaps during the 1970’s when they relocated south of Orlando where they are found today.
    Scanning old literature for references as to where cold sensitive crops are being grown at the time it is written is another way to document changes in climate.

    • Jason Calley says:

      Very true. Here in Florida where I live there are towns with names like Mandarin, Orange Park, Fruit Cove and Orange Dale. They were named for the citrus orchards here a hundred years ago. The names remain, but today they are all missing the actual citrus groves.

      I have asked CAGW proponents why that should be. They always say, “we are talking about global changes and you are talking about local changes”. I guess CO2 must have different properties wherever people used to grow oranges.

  55. Pingback: MORE NOAA Temp 'Adjustments'... -

  56. Jeffrey Gee says:

    but, but, but how is Al Gore, Obama, The UN supposed to make any money taxing us for make believe made up BS??? How will they survive when the planet doesn’t boil over and they have to actually earn a living for continued survival. All the climate tyrants should be sued and jailed for perpetuating a fraud!

  57. Jeffrey Gee says:

    but, but, but how is Al Gore, Obama, and The UN supposed to make any money taxing us for make believe made up BS??? How will they survive when the planet doesn’t boil over and they have to actually earn a living for continued survival. All the climate tyrants should be sued and jailed for perpetuating a fraud!

  58. BV says:

    What is the source of this story? From where do we know there has been adjusting?

    • Rud Istvan says:

      Simple. Subtract ‘final’ from’as reported. First graph. Visit here more often and learn. If you want details, essay When Data Isn’t in ebook Blowing Smoke.

  59. Ralphdupp says:

    Who needs “data” to tell us the 30’s were warmer. Has the NAS ever heard of the dust bowl or seen the movies? Get them out of their government paid, ivory towers and out into the real world and give them a weather rock.

    • BV says:

      I am a skeptic of global warming skeptics. The thing is, I REALLY want to believe that GW is not from man, and is not a problem so that is why I go to these sights.

      If you want to convince people like me (I am honestly asking), there needs to be a source that is not from another GW skeptic website. If I said GW is proven from man, and I gave you a source that is from Al Gore or something, you wouldn’t take it, correct?

      Is this information also peer reviewed elsewhere?

  60. Amawalk2 says:

    I believe these educational professionals are so used to grading the tests and papers of their students “on a curve” that they’ve grown unaccustomed to treating reality as it is. As I recall, the “curve” generally, if not always, implies a “norming” of grades to make a greater number of students happy, i.e. raising the grades to at least ” passing” for the vast majority.

    It’s become a “science” unto itself.

  61. toby says:

    Climate fraud on this site continues, not to mention that it stifles free speech, which is unAmerican

    • Neal S says:

      The site that produced the fictitious charts you reproduced is indeed a place where climate fraud continues. Thanks for pointing that out. (But I doubt that was what you actually meant)

  62. Teddy Novak says:

    Global warming (aka climate change) is the religion of the stupid. Sheep, lemmings, and Leftists are easily manipulated.
    zazzle.com/firstprinciples?rf=238518351914519699

  63. tim says:

    Beware of idiots

    • Neal S says:

      How nice of you to give people a warning about yourself. In time the box of red crayons will no longer be re-supplied by a government that desires fairy tales. While I don’t know exactly how long it will take, I am looking forward to much more accurate long term climate reporting which will be completely different from the lies we have been given in recent times.

      Strange that numerous all-time records were set in the 30’s and yet are not being set now. The only way records are being set now, is by considering 30 years only, and using highly adjusted (the wrong way) and UHI contaminated readings.

    • AndyG55 says:

      Particularly ones with coloured crayons !

  64. Yars says:

    Can someone here be a real gem and send (tweet) this link to Daniel Swain at his weatherwest.com blog…? Decent kid, working on his post-doctoral in climate science at UCLA I think. I simply want to help him unshackle from the chains of dogma. I don’t have a Twitter acct.

    Thanks kindly,
    -Yars

  65. Eric says:

    The warmist site SkepticalScience has a graph that seems to explicitly contradict the one in the above post.

    What’s with the discrepancy? It seems like one of these two graphs has to be incorrect. Skeptical Science is claiming no adjustments post 1940 and only minor adjustments pre-1940 (in the wrong direction for warmists).

    http://www.skepticalscience.com/no-conspiracy-noaa-adjustments-closer-to-pristine.html

    • AndyG55 says:

      Citing SKS makes you look like a monumental idiot and propaganda hack.

      • Eric says:

        Andy, I was asking for an explanation of why SKS is wrong. Either the graph in OP is wrong or SKS is. I assume it’s SKS but wanted the proof.

        Completely failing to understand the point of my earlier post makes you look like a monumental idiot who lacks basic reasoning skills.

  66. asdfgh says:

    Dude, you need to cite sources. Give us the raw data you used for the graphs.

  67. Boston_Patriot says:

    The entire “climate” industry is just like economics departments in the universities (amongst others): Their sole goal is to justify government interference in the free market, i.e. to justify statism. The “science” is conjured up to meet this end. Reason and truth have been abandoned.

  68. LiberalsSuckDOGSHIT says:

    Before draining the swamp, every swamp participant should be drown in it. These marxist maggots have been lying and deceiving the American public for generations. Nothing short of them being put in front of a firing squad for treason should be acceptable…

  69. 2ndprotectsall says:

    When those who continually lie and exaggerate they become irrelevant and mocked.

  70. Ben Holloway says:

    The scientists aren’t the only villains. The Main Stream Media is their major accomplice in this fraud. The media has failed us miserably. It has become a fiction spinner rather than a fact finder and reporter.

  71. Robin McMeeking says:

    A few months ago after reading about the use of Min/Max temperature readings being used to determine daily and yearly averages in the historical record I decided to perform some tests to evaluate the accuracy of that method. I was, and still am, an AGW skeptic. The talk about Time of Observation bias and explanations of inaccuracy seemed plausible but not fully convincing. I downloaded 12 months of temp records for 2015 from 17 personal weather stations connected to the Weather Underground. These were from a variety of climate regions around the US (continental 48). Most of these stations report at 5 minute intervals, a few at 15. I compared daily values obtained from the 24 hour High/Low, from the average of 24 hourly readings (last reading in each our) and the average of all reported values. I calculated values based on midnight to midnight, 8AM to 8AM and 4PM to 4PM. The results were highly consistent across all locations. There was no obvious regional difference in the summary values. The full report can be found here: wattsupwiththat.com/2016/05/05/an-analysis-of-time-of-observation-bias/. The photo in the report is not of me. I am not female, and my weather observing days were spent near Puget Sound.

    There is a definite TOB with 4PM yielding the highest deviation. But, interestingly, the midnight and 8AM min/max values are still consistently above the averages based on more readings. Deeper investigation revealed that on a typical day the temperature is below the mid value considerably longer than it is above. Also, the time of the low temp is much more variable than the time of the high temp. Highs are strongly concentrated between 2:30 and 4:30 PM. Low temps are spread fairly evenly across a 6 hour period from 1:00 to 7:00AM. The averages for all 17 locations and times are as follows.

    Time Min/Max All Temps 24 Temps
    Midnight 54.67 54.08 53.93
    8:00AM 54.37 54.10 54.10
    4:00PM 55.88 545.03 54.03

    • Steve Fraser says:

      Very interesting. I wonder what would happen if the data from the USCRN were analyzed the same way… Each station daily (min + max ) / 2 plotted against the average of all the temp samples for the same 24 hrs period.

      With such a nationwide calculation, we could approach a generalized understanding of the methodological shortcomings of the min/max method.

  72. Alan B. says:

    Al Gore proved that Global Warming and even the Nobel committee, could be presented as relevant, believable entities if you spend enough money on the presentation. The only Inconvenient Truth was that he owned one of the LEAST, energy friendly mansions in America at the time and probably still does. If you believed him, he played you. If you knew he was Full of C02, Congratulations, we were right!

  73. Pingback: MORE NOAA Temp 'Adjustments'… | Oblivious Nature

  74. Alan J. Perrick says:

    Asian countries for Asians.

    Black countries for Blacks.

    but White countries for everybody?

    That’s genocide.

    Anti-racist is a codeword for Anti-White

  75. Patti says:

    what is the data source for the first graph in this report?

  76. Robin McMeeking says:

    Just noticed the typo in the 4:00PM values. The All Temps value should be 54.03, same as the 24 temps value.

  77. Pingback: Past Breaking News Headlines For November 2016 – (TCP)CHICAGO « The Critical Post - Chicago

  78. Eliza says:

    Re Trump “climate backdown”. Gail may be right we are reading too much into what Wash Post say (they are 100% AGW biased). Trump is feeding MSM/PC but will probably go ahead with changes to EPA and withdraw from Climate treaties

  79. Of course there are caveats, sometimes the data must be thrown out. Such as when you don’t have a agreed upon method to adjust for specific measurement issues.

    This is part of science, scrubbing the data. Sometimes the data must be massaged. But we don’t massage the data to fit a flawed model. You must show that massaging the data corrects measurement problems and within a specific range making the data more correct.

    You can use the model to identify data which doesn’t fit, examine that data subset, investigate how that subset may result from an incorrect measurement method. Then propose a method to massage that specific subset of data.

    But not the whole thing.

    • tonyheller says:

      Nonsense. Most people working with large imprecise datasets assume a random distribution of error. and aren’t foolish enough to introduce their own biases into the data by “correcting” it.

    • Latitude says:

      Michael, since past temperature data is constantly evolving….

      …got any idea when we will know what the temperature was right now?

      10 years?
      …20 years??

    • Gail Combs says:

      “Massaging the data” is a really great way to buy yourself a jail cell in the industries I did analytical/QC chemistry in.

      You do NOT massage data you put error bars on it as shown in this example. (Gray area is error)

  80. Pingback: Gary Johnson’s long lever | libertariantranslator

  81. Pingback: NOAA Adjustments Correlate Exactly To Their Confirmation Bias - Principia Scientific International

  82. Pingback: NOAA Adjustments Correlate Exactly To Their Confirmation Bias – Climate Collections

  83. Pingback: The Literary Drover No. 43 | The Literary Drover

  84. Ron says:

    So, I’m supposed to believe that all those scientists don’t want to get the right answer. Sure. Unlike almost every scientist I have ever known.

  85. Very interesting information and thanks for sharing. I came across your post when I was searching for something else. Can’t wait to go home and check it out more closely. I’ll share your work with my colleagues.

Leave a Reply

Your email address will not be published. Required fields are marked *