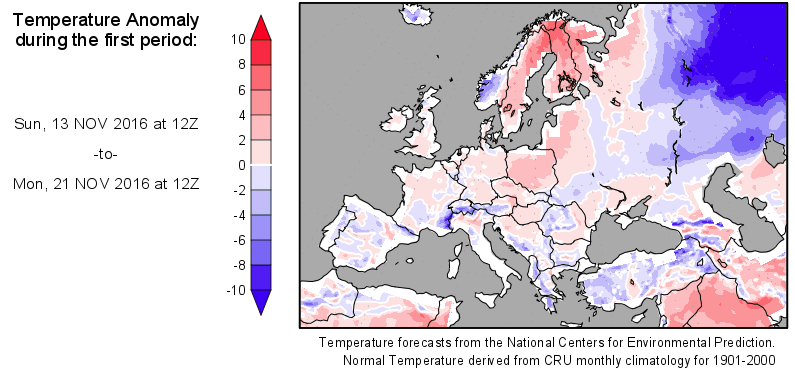
Over the last eight months, global temperatures over land have cooled a record 1.2 C. November is seeing record cold in Russia and South Australia, so we should see the record cooling trend continue.
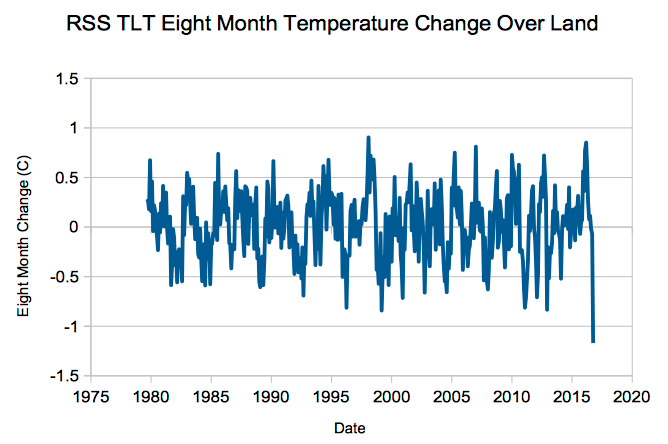
www.woodfortrees.org/data/rss-land/
As temperatures cool at a record pace, experts say global warming is now unstoppable.
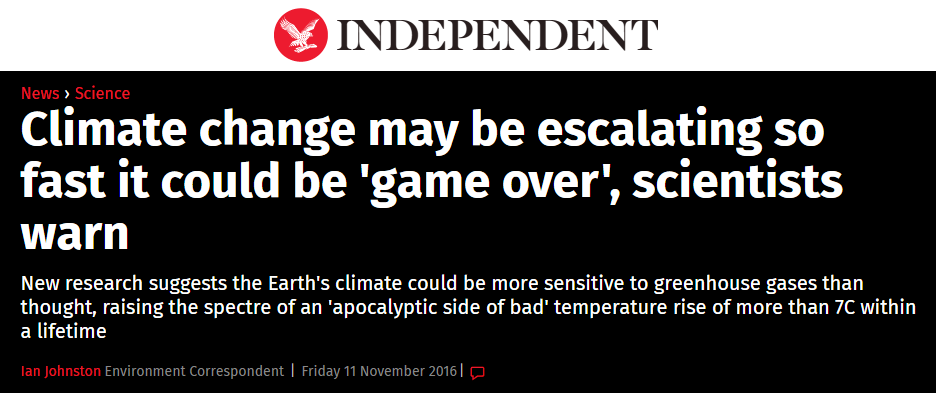
Climate change may be escalating so fast it could be ‘game over’, scientists warn | The Independent
People in Russia might tend to disagree with this assessment.