
NOAA just released their Arctic report card, which shows how desperate they are to keep their climate scam alive.
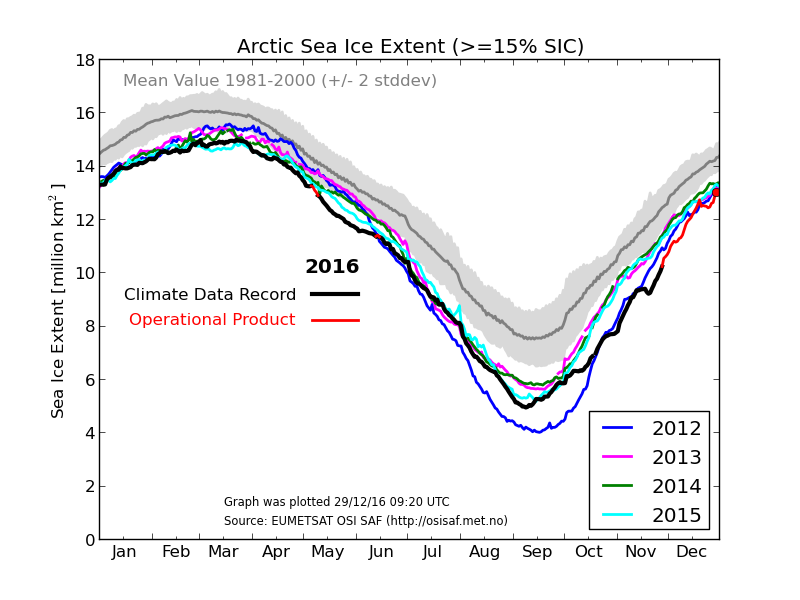
Their claims of Arctic ice loss are completely fraudulent. Arctic sea ice extent is essentially identical to what it has been in all recent years on this date, and is growing very fast.
Ocean and Ice Services | Danmarks Meteorologiske Institut
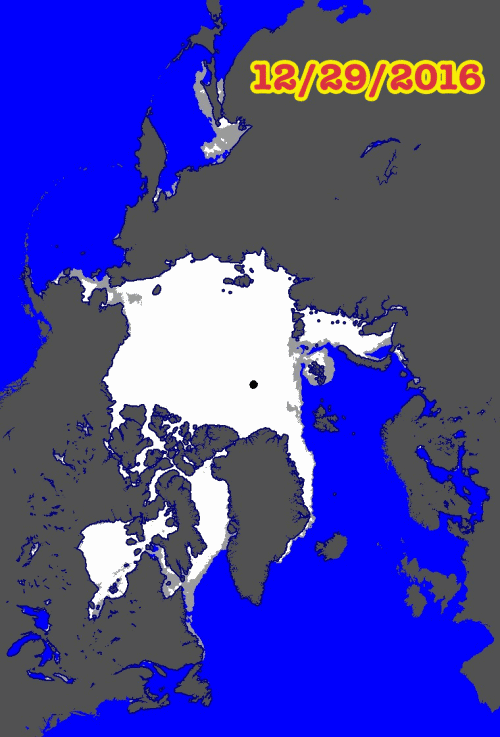
Huge amounts of new ice have grown over the past week – a week when experts said the Arctic was hot.
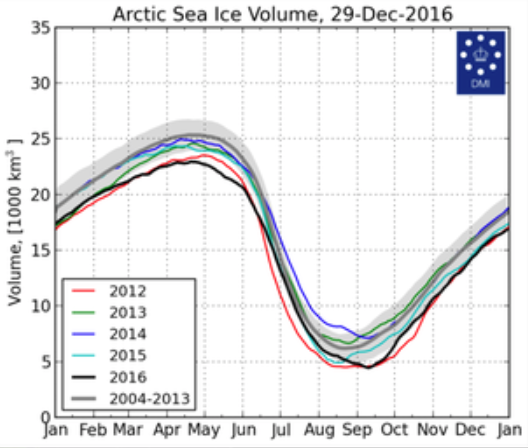
Arctic sea ice volume is also nearly identical to all recent years, and just below “normal.”
NOAA claims there was a massive decline in snow cover. This claim is wildly fraudulent. Autumn snow cover was second highest on record this year.
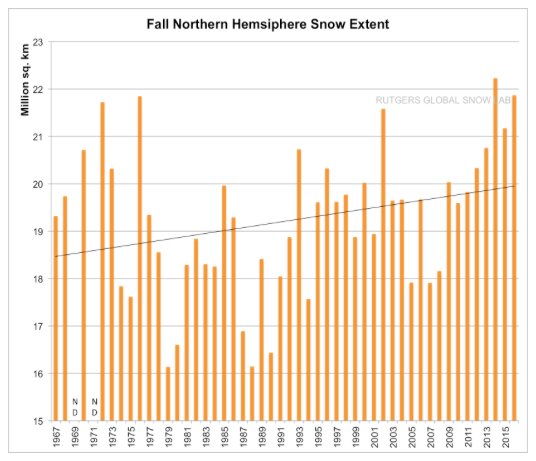
Rutgers University Climate Lab :: Global Snow Lab
NOAA claims that Greenland is losing ice. Greenland is actually gaining ice at a record rate during autumn 2016.

Greenland Ice Sheet Surface Mass Budget: DMI
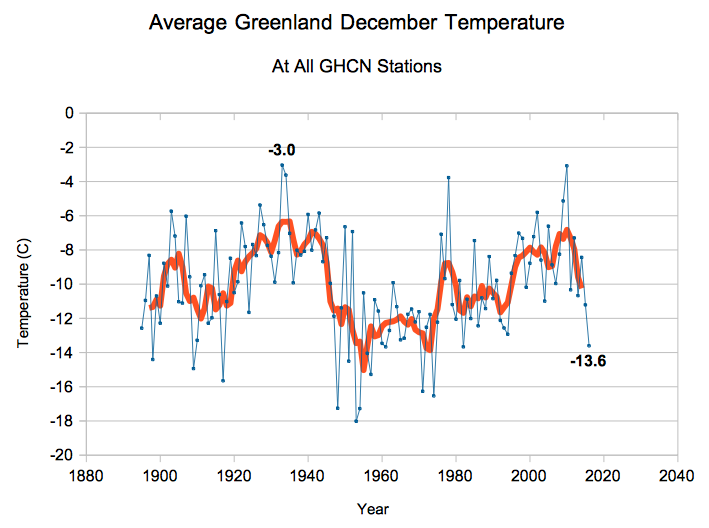
Greenland is having their coldest December since 1982. Greenland temperatures are almost 20F colder this month than 1932.
NOAA claims that Earth is warming at a record rate in 2016. The exact opposite is true. Over the last nine months, Earth has been cooling second fastest on record.

NOAA is wildly misleading the public, which seems to be the norm in the Obama White House.
