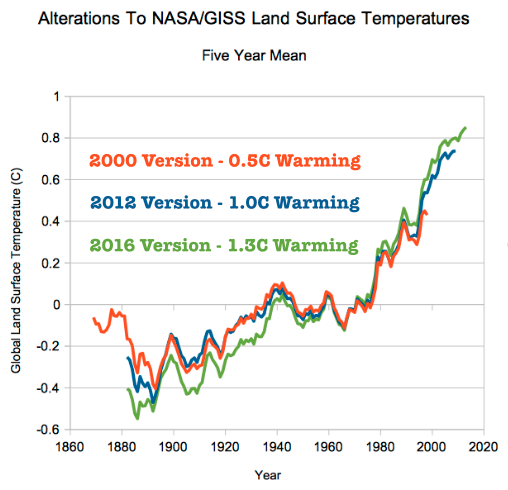
In the year 2000, NASA showed a total of 0.4C 0.5C warming over land. In 2012, they showed 1.0C warming. Now they show 1.3C warming. They have (nearly) tripled global warming over the past 16 years. All of this data was taken directly off the NASA web site.
(Note: There was an error in my original spreadsheet with years shifted by one. Below is the corrected graphs)
Link to NASA files 2016 2012 2000
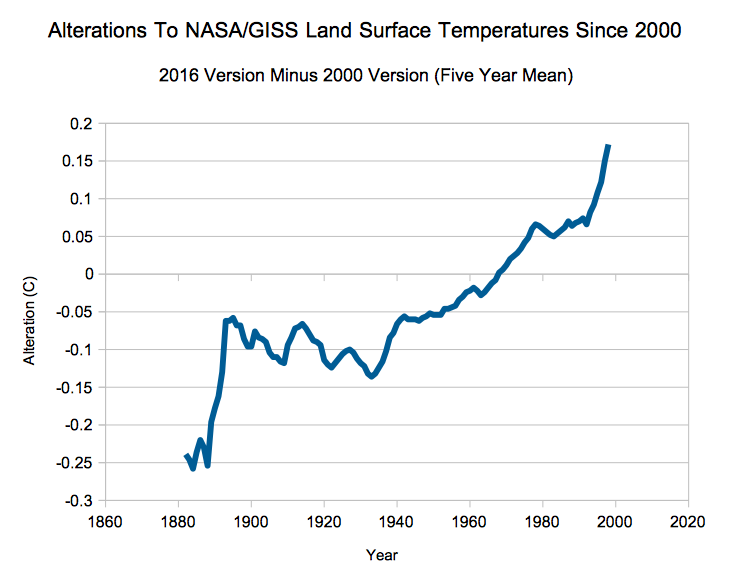
The total adjustments by Gavin Schmidt at NASA have been a spectacular hockey stick of data tampering.
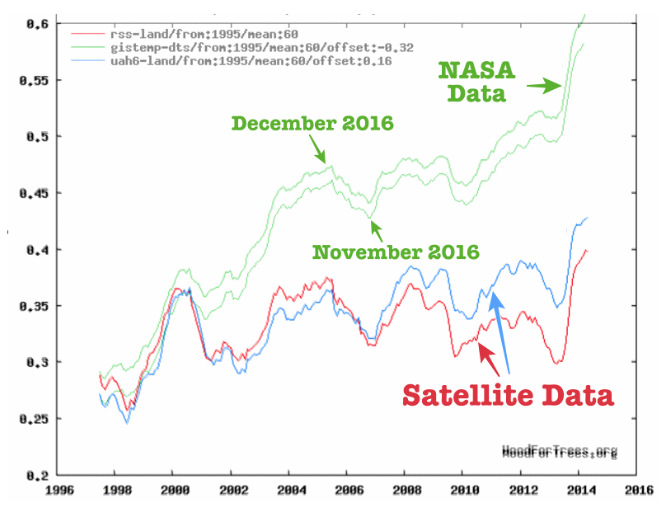
Perhaps there has been a lot of warming since 2000, which accounts for the change? That theory doesn’t work, because satellites show essentially no warming since 2000. Also note that Gavin has greatly increased his data tampering just since the election last month.
Wood for Trees: Interactive Graphs
Even Michael Mann acknowledges that the post-2000 global warming hiatus is real.
Making sense of the early-2000s warming slowdown : Nature Climate Change
NASA has tripled global warming, during a 16 year period when there was little or no warming. Global warming is truly man-made, by Gavin Schmidt. It is the biggest scientific fraud in history.
Did you include data tampering in your Washington presentations?
That is what the presentations were about
Can we see these presentations anywhere please?
https://www.youtube.com/watch?v=Gh-DNNIUjKU
Other Utubes are listed on the right.
Another great blow to the alarmist midsection Tony! This is the easiest way to convert the fence sitters, simply show them the fraud in NASA’s own handwrtiting. Congratulations on your long overdue exposure!
Yes, congratulations.
Only problem is are we going to have to change it from Mann-made global warming to Schmidt-made global warming. Somehow that doesn’t roll of the tongue as well.
Probably Gore’s new movie will show Gavin’s reconstruction ending at the peak of the last El Nino. There will be no mention of the satellite measurements, unless he quotes Mann saying they are unreliable.
When is Gavin going to get canned, This BS might make it with the the left supporters after all their side murdered 200.000.000 people directly and yet the supporters and the left make no apology for it. They just double down on the policy and like people that did it! Why those on the right don’t point this out daily and loudly is beyond me!
I do and so does Gator.
Here is a classic link
Pearl Witless exploded and has never come back.
I believe Trump has taken the first step in redirecting NASA out of the climate fraud business.
I accept some changes from one compilation to the next, many good reasons, but that the result always goes in the same direction is alarming.
Ole Humlum keeps track of older records and has made the same observations.
http://climate4you.com/
He lost the trust in these records with good reason.
Would it be possible to use an old code to make a compilation of the newest data and see if it also changes all in the same way.
The most alarming is the changes seen in older data and in the newest. Have we lost the ability to read a thermometer, and have we found out recently that they could not read thermometers in 1920.
I sometimes wonder if they repeat the compilation on the exact same results up till a fixed date, if it would drift away as we see.
0.4 to 1.3 = +325%. Quite a leap compared with 2/100ths warmer for the ‘hottest year evah’ not so long back.
Paul Gives another great example of the MASSIVE tampering
https://notalotofpeopleknowthat.wordpress.com/2016/12/17/five-years-of-giss-cheating/
This graph says it all. Between Nov 2011 and Dec 2016, the “ADJUSTMENTS™” account for over 0.4ºC of the GISS warming
Do you see the tipping point?
It seems to be exactly at the time of the ice age scare.
The really scare is that it took only 5 years to make such a man made warming.
All those climate scientists that base their results on the GISS temperature have beeen fooled big time. I wonder why so few have questioned these changes.
Maybe they have but only at internal lines. Else they are not afraid of going public with any alarm, but here it would be approbiate.
Adjustments to satellite sea level data shows a similar pattern.
That. is. YUGE!
So we got to figure out how to make that clear (as day) to the public.
Btw, also, I provided my reasoning today for why the 1930s worldwide was hotter than today in this WUWT comment: https://wattsupwiththat.com/2016/12/18/u-s-average-temperature-16f-colder-than-any-time-last-winter-and-winter-hasnt-started-yet/comment-page-1/#comment-2376302
Part of the wuwt comment included this graphic:
See my Aussie heat wave comments in the newer thread HERE
H/T to Jo Nova who is doing a bang-up job of showing the data manipulation in Australia.
Pingback: Proof of Man Made Global Warming - Principia Scientific International