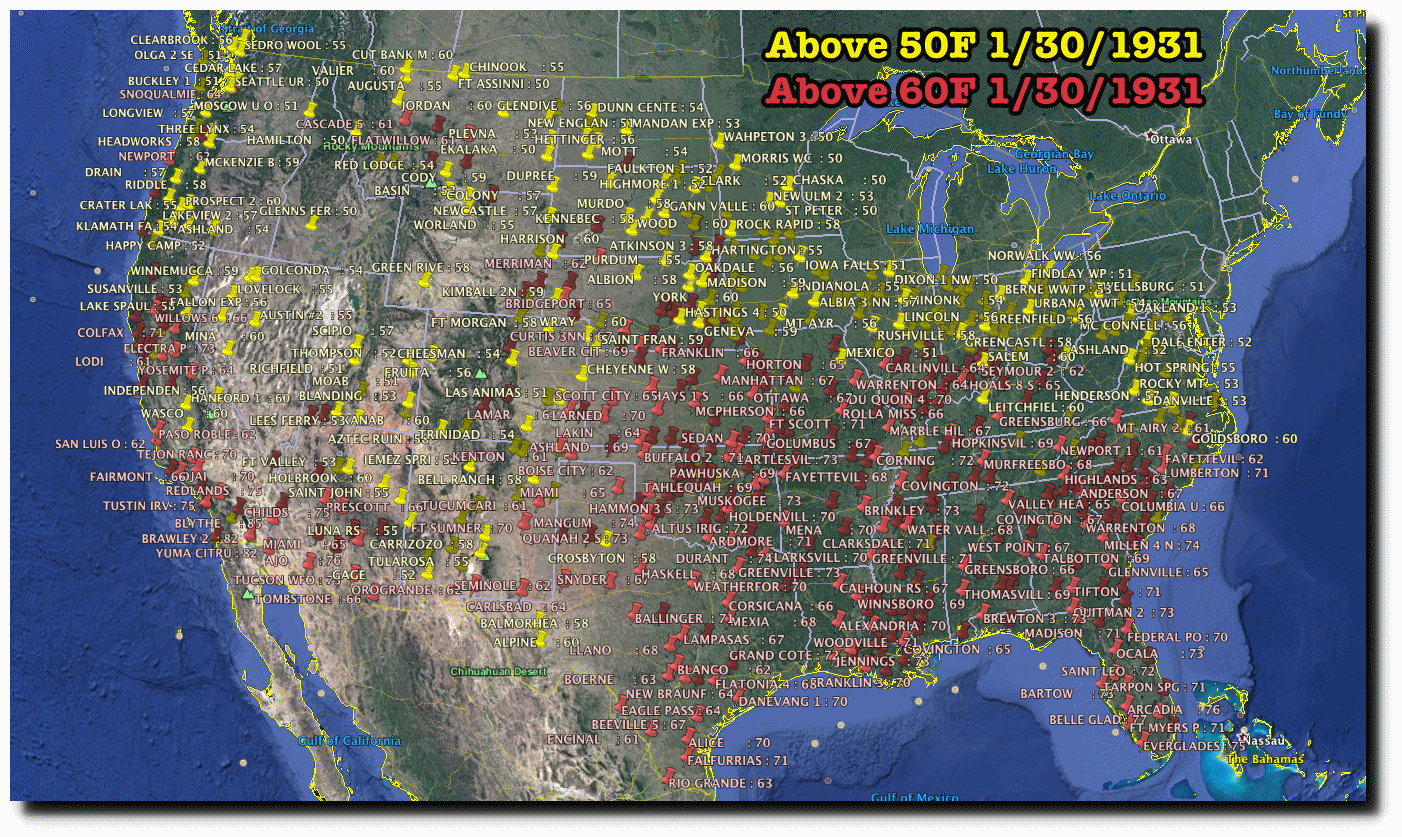
On January 30, 1931 almost 80% of the US was above 50F, and about two thirds was above 60F.
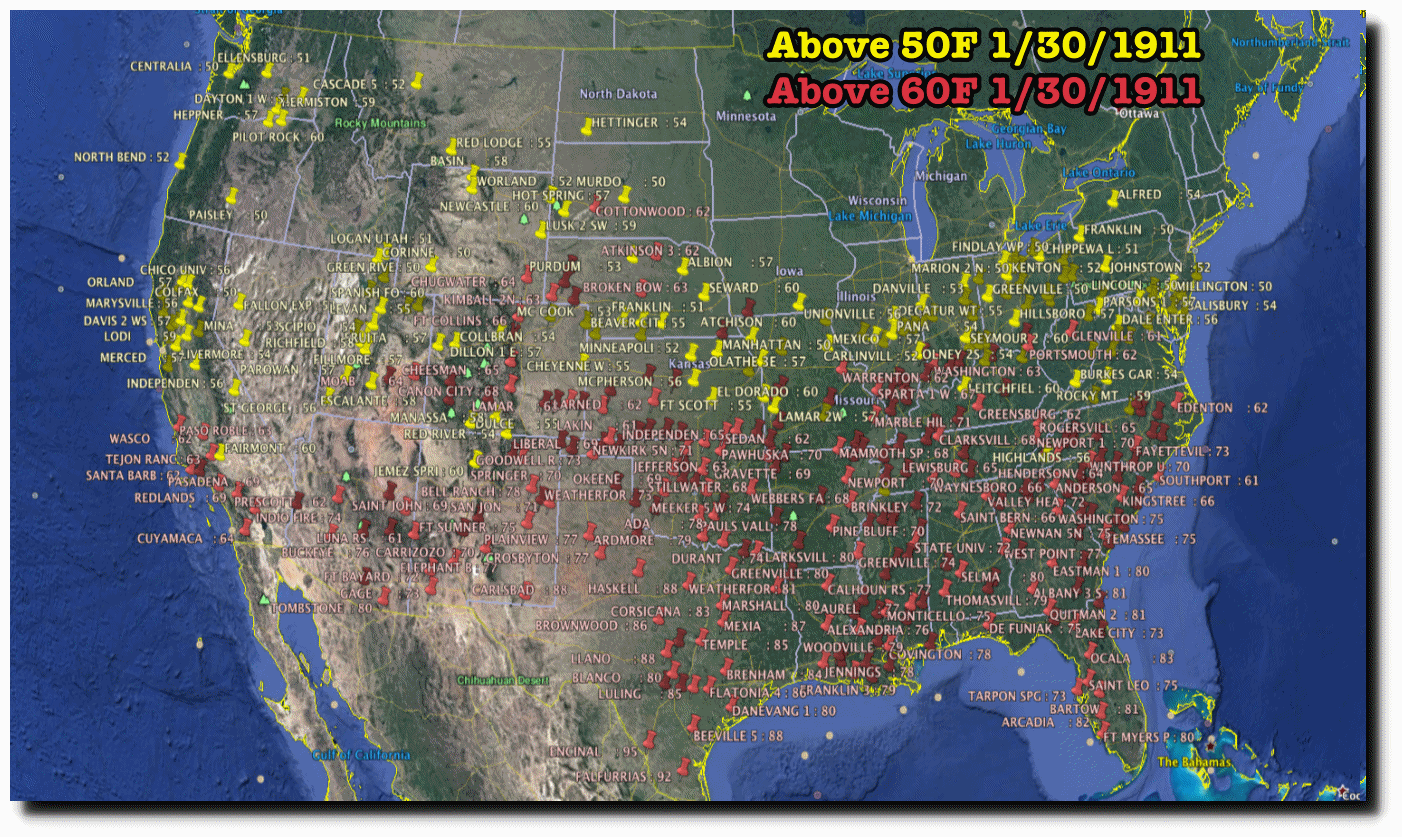
On January 30, 1911 the heat wasn’t quite as widespread, but was much more intense. Encinas and Lampasas, Texas both reached 95F (35C.)
On January 30, 1931 almost 80% of the US was above 50F, and about two thirds was above 60F.
On January 30, 1911 the heat wasn’t quite as widespread, but was much more intense. Encinas and Lampasas, Texas both reached 95F (35C.)
Long time reader and love your dedication. I am a “denier” or smart person depending on ones perspective. Long story short, I have a chance (an open minded liberal) who wants to read some of the articles, studies, etc I read that makes me believe that Climate Change is largely bunk. Can you and certainly all your readers and posters point me to some of the few academics, etc that disagree with the 98% BS? Maybe, studies that refute or at least create gaps in the impact of people to the climate, etc. I am actually deep in my cursory knowledge on the subject, but really want to dump the most reputable strong material on him….I want to get a “believer” to convert or at least create an open mind… Get me or is this too scrambled? Any suggestions help.
Have your acquaintance do some simple research here are some links with regard to sea level:
http://www.psmsl.org/data/obtaining/
http://sealevel.colorado.edu/
https://web.archive.org/web/*/http://sealevel.colorado.edu/
And an excellent Excel help page:
https://www.mrexcel.com/forum/index.php
I always start by explaining that there is nothing unusual or unprecedented about our current climate or weather. Everything we are seeing now has been seen before, and it is all easily explained by natural variability. These charts should help…
http://notrickszone.com/2016/09/27/hide-the-decline-unveiled-50-non-hockey-stick-graphs-quash-modern-global-warming-claims/#sthash.TSeIS8qr.rvKY6B9P.dpbs
4,500,000,000 years of set precedence cannot be ignored or dismissed.
Thank you very much guys. Great resources. Hopefully when the government funding dries up for this epic scam/brainwash the sea levels will begin to fall and the planet heal.
The planet is doing fine. But there are 21,000 people who will starve to death today, and virtually every one of them could be saved if we would simply stop throwing trillions of dollars at a natural cycle, and allocate those funds correctly. Have your friend defend climate spending after watching this…
https://www.youtube.com/watch?v=Dtbn9zBfJSs
Sea levels began to fall during the Little Ice Age. That is why Roman ports are a mile inland. I would worry more about the glaciers growing if I were you.
Notice the area where Roman sea ports are inland is tectonically stable according to NASA.
List of Roman Sea Ports found inland
(Has great pictures and maps.)
For the areas occupied by the Romans it was pretty close to zero or actually sinking! “..the pivot point is rather abrupt; Scotland is still rising due to the rebound effect which is correspondingly sinking England 2 millimetres into the North Sea each year.”
https://i0.wp.com/basementgeographer.com/wp-content/uploads/2013/05/PGR_Paulson07_big.jpg
TEN PEER-REVIEWED PAPERS PROVING SEA LEVEL IS NOT RISING
STUDY #1
Mid to late Holocene sea-level reconstruction of Southeast Vietnam using beachrock and beach-ridge deposits
Translation the sea level was up to 1.5 meters higher than today in a tectonically stable area ~5000 years ago to 2000 years ago. Tectonically stable area refers to areas devoid of deformation such as all processes which modify the external form of the crust. For example unidirectional vertical movements, plate tectonics and also the rise and fall of the solid earth surface, especially in coastal areas, caused by external factors such as climate change (gio-isotasy, hydro-isotasy)
STUDY #2
Sea-level highstand recorded in Holocene shoreline deposits on Oahu, Hawaii
This study shows a sea level highstand ~1.6 meter above the present level from ~5500 years ago to 2000 years ago.
STUDY #3
Late Quaternary highstand deposits of the southern Arabian Gulf: a record of sea-level and climate change
This study shows a sea level highstand ~1 to 2 meters above the present level about ~5500 years ago.
STUDY #4
The Quaternary Geological History of the Santa Catarina Southeastern Region (Brazil) 1999
The first part discusses drilling in several locations and analyzing samples. They mention dating prior to that was guesses. “…. A drilling campaign done in the domain permitted the sampling of material for 14C datings, and the obtained data confirmed some previously assumed ages. The sequence of events, that originated the Holocene deposits, has been also reconstructed through drilling and 14C dating of the collected peat and shell samples…”
In the body of the text is this:
This study shows a sea level highstand ~ 4 meters above the present level about ~5000 years ago. With sea level oscillating since then. Not only has the sea levels have dropped since the Holocene Optimum the evidence shows that “warmer paleotemperatures were favourable for great proliferation of mollusks in the area”
Santa Catarina Brazil is at latitude 27.2500°S and is tectonically stable.
STUDY #5
Holocene sea-level change and ice-sheet history in the Vestfold Hills, East Antarctica
The above is a RELATIVE sea level. The area is not tectonically stable because the area has isostatic uplift in response to deglaciation from the Wisconsin Ice Age. The same applies to the following study.
STUDY #6
A new Holocene relative sea level curve for the South Shetland Islands, Antarctica
VALIDATION BY ALTERNATE STUDIES
GLACIAL ADVANCE
STUDY #7
Ice free Arctic Ocean, an Early Holocene analogue
STUDY #8
Temperature and precipitation history of the Arctic
STUDY #9
A new approach for reconstructing glacier variability based on lake sediments recording input from more than one glacier January 2012
The highest glacier growth started 600 years ago prior to that most glaciers had melted away.
THIRD METHOD OF VALIDATION
STUDY #10
Sea Level Changes Past Records and Future Expectations
Have they corrected for the 18.6-yearly Luna Nodal cycle? Linear trend lines on sinusoidal curves are very time dependent.
The Dutch who are the most concerned about actual sea level rise have found the cycle.
The Effect of the 18.6-Year Lunar Nodal Cycle on Regional Sea-Level Rise Estimates
Fedor Baart†,‡, Pieter H. A. J. M. van Gelder†, John de Ronde†,‡, Mark van Koningsveld†,§, and Bert Wouters†
(wwwDOT)bioone.org/doi/abs/10.2112/JCOASTRES-D-11-00169.1
The evil instustrial revolution and vulture capitalism, along with persecution of women, the LGBT community, Islamists, blacks and Jews was causing the planet to overheat and have a fever, even back in the early 20th century.
I think they’re called January thaws. A much needed break from winter. We’ll be back in the deep freeze before you know it. It would be nice if it would stick around, but alas, that’s not usually how these things work.