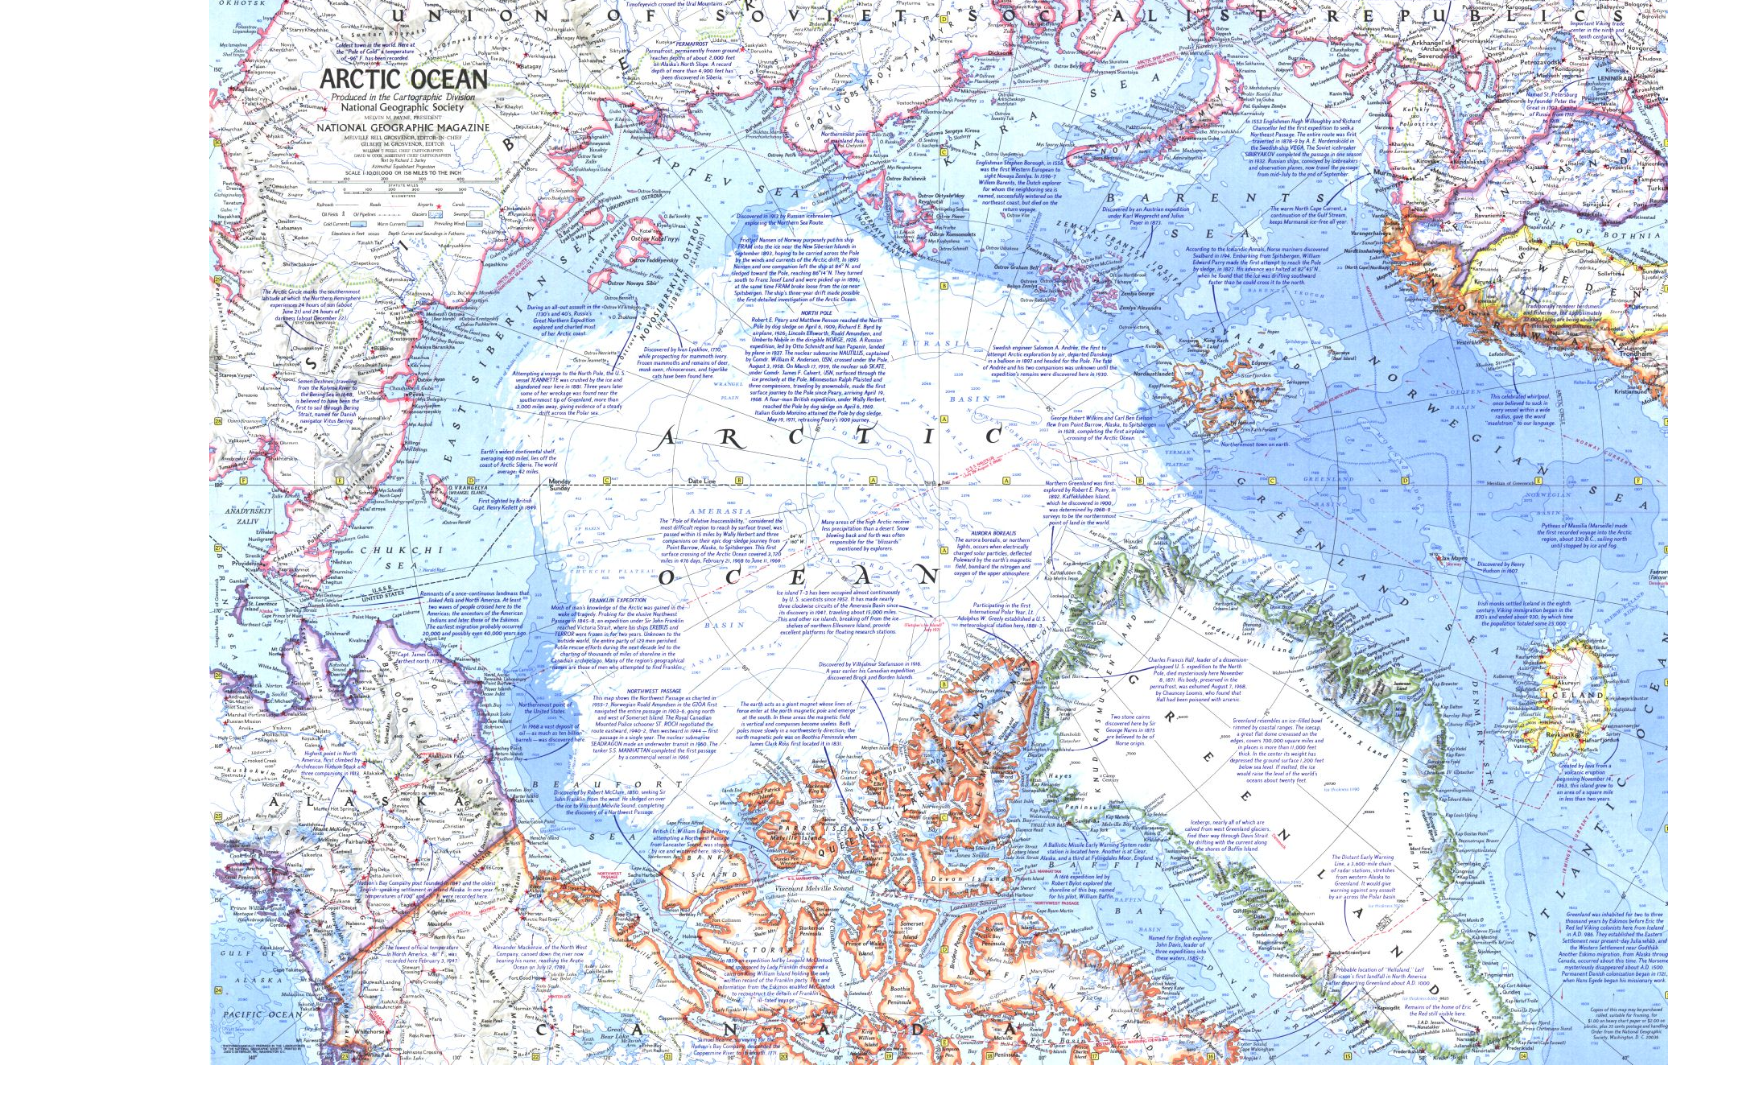
National Geographic published this map of Arctic sea ice extent in 1971
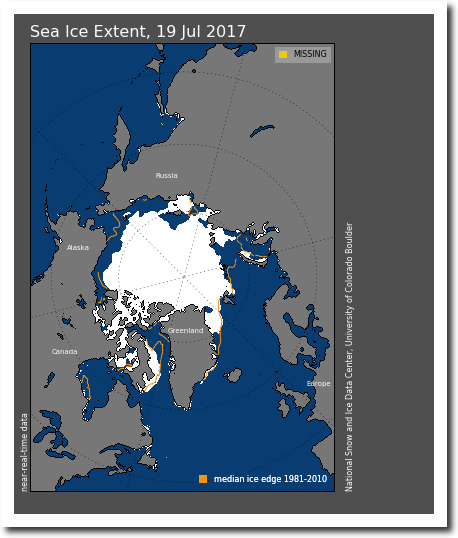
This map is current sea ice extent.
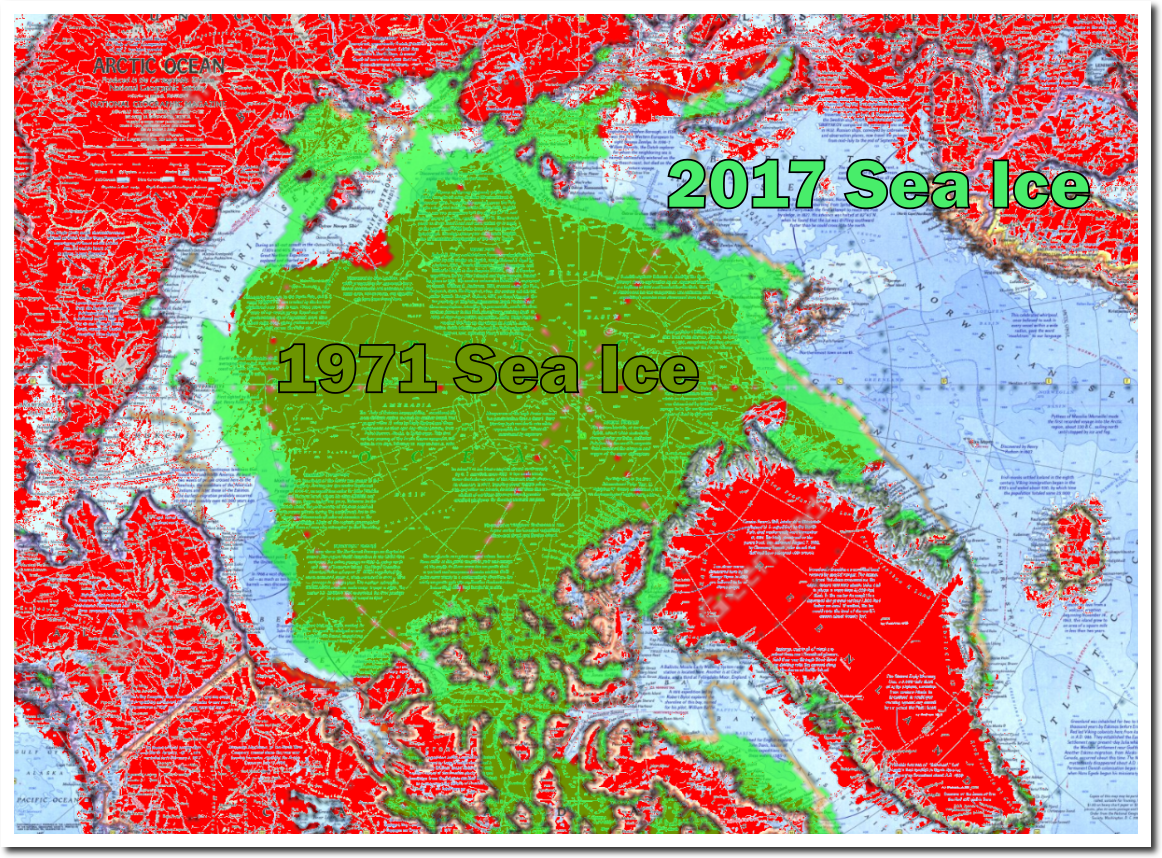
I overlaid the images at the same scale. The 1971 edge is shown in brown. The current edge is shown in green. As you can see, the current edge extends quite a bit further than the 1971 edge. The edge will shrink some over the remainder of the short melt season, but cold air in the Chukchi and Beaufort Seas will minimize melt for the next few weeks.
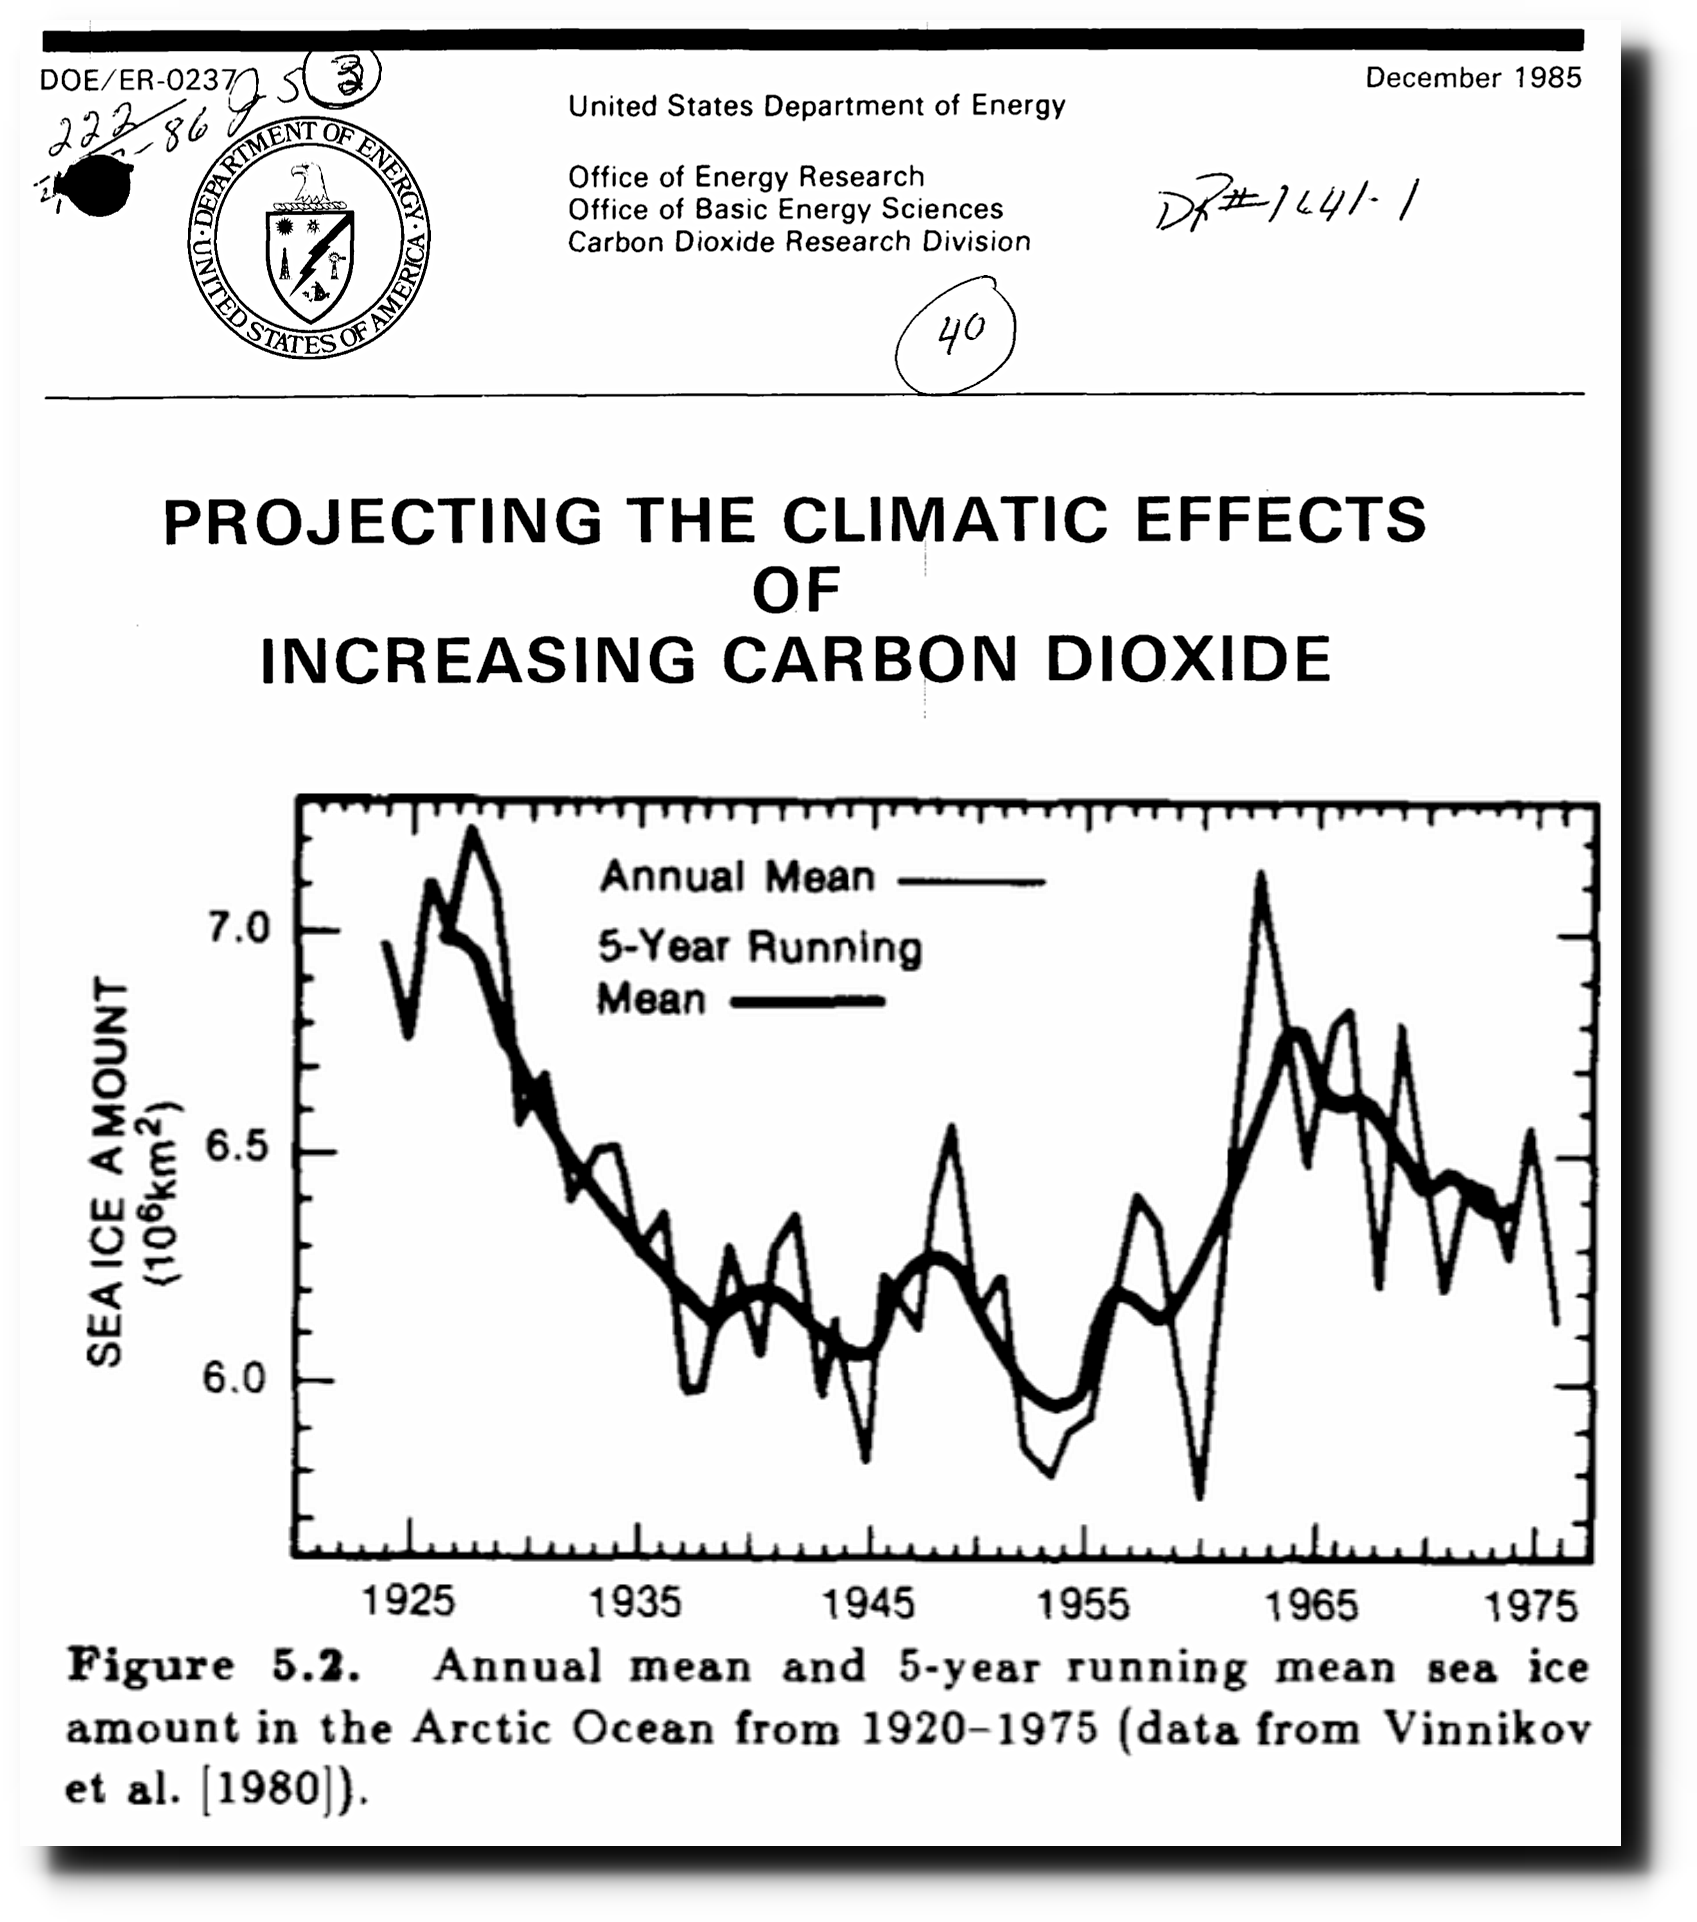
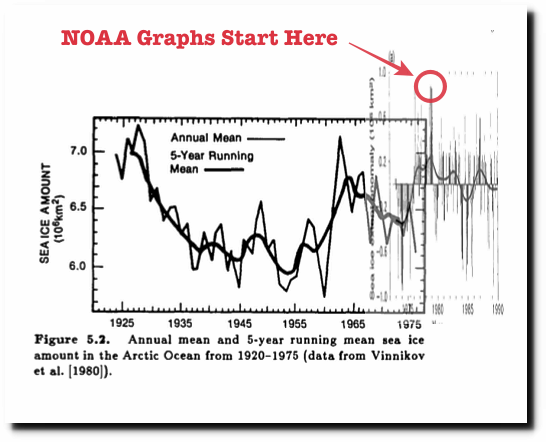
This map is consistent with data from the 1985 DOE report “Projecting the climatic effects of increasing carbon dioxide” – which showed low ice extent prior to the 1979 peak where fake climate scientists always start their graphs.
Arctic Sea Ice Fraud | The Deplorable Climate Science Blog
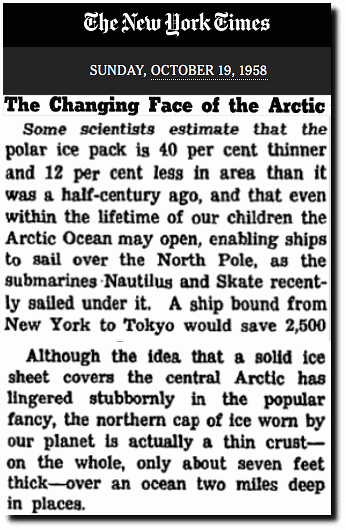
Newspaper accounts from the 1950’s confirmed that sea ice extent and thickness was low.
The Changing Face of the Arctic; The Changing Face of the Arctic
The mainstream press won’t report this, because they aren’t interested in facts or science.
The extremists will now claim that the “glacier melt” is the cause of rising seas, or they will simply find a way to refute your information. …. and the saga continues ……..
There’s a Global Warming poster on YAHOO ANSWERS who bought a house (or built one) on a glacier and claims to be living proof of Global Warming. He’s had to “adjust his foundation” many times in order to maintain his homestead. LOL! I told him that he should sell, take a loss, and then buy a house in Florida where the sinkhole population continues to grow. :-)
Man, Tony has got the Grifftard in his sights and just keeps squeezing off one shot after another. Old Griffy is going to be some upset at all these posts making him look like a moron.
Stewart, some people certainly come out of these posts with the science backing them up and others are shown to have no foundation for what they say.
some people are going to look pretty stupid come September.
anyone claiming the ice is stable or in recovery needs their head examined.
” some people certainly come out of these posts with the science backing them up ”
And you are NOT one of those.
“others are shown to have no foundation for what they say.”
That would be YOU, griff.
You need to seek a remedy for your bed-wetting, little girl.
Anyone claiming the ice is more omportant than human life needs their head examined.
Why do you hate poor brown people Ms griff?
It also HATES the people living up in the Arctic region.. regardless of colour. Wants them to be frozen in all year, like they were during the LIA and the late 1970’s.
Wants to DENY them the use of their own oceans.
It really is the very depths of human spite that we are witnessing from this chicken-little, bed-wetting troll.
Oh, no, you are wrong. Ms Griff loves herself some Arctic natives.
When the highway was approved, the Harper government saw it as a road to resources and a way to extract oil from the region. But the Trudeau government has now banned such development in the Mackenzie Delta.
“We’re a bit troubled with that,” said Tuk’s current mayor, Darrel Nasogaluak.
He said developing tourism can’t be the sole objective, given that it only accounts for three months out of the year.
“It’s great, but it’s not the answer. Unless we get into mining or something else, it’s going to be a very difficult time for people up here.”
http://communitynewsblog.com/2017/04/driving-to-the-top-of-the-world-exploring-canadas-new-arctic-highway
The road to Tuktoyaktuk
What’s wrong with keeping these people in a neat little Arctic Skansen? Ms Griff and her comrades may visit to observe them during the 3 months when the weather is nice. Green tourism, don’t you know?
Without other work the natives will have more time to make neat little furry things for Ms Griff to buy.
And she may actually get to use them because it STILL gets cold and SNOWS in S. England at times and the children DO know what snow is. Calling Dr David Viner. You need to fix that right away now.
Ms Griff, maybe you would like to go with me to Tuktoyaktuk this December. Be prepared for the cold, as it gets into the -30sC.
I seriously doubt that Griff has ever experienced that kind of cold. The kind of cold that freezes boogers into little sharp points which stab the mucosa inside ones nose bringing tears to ones eyes. The kind of cold that freezes leather boots hard as plastic even when your wearing them. The kind of cold that turns even the simple tasks into problems which require forethought and planning to minimize exposure by maximizing efficiency.
I seriously doubt that Griff has ever experienced that kind of cold.
IF she has a heart, then she has, and then some.
I have been in – 30 C weather, but stayed warm because I was wearing Polar Shirt and pants in a Freezer suit,- 45C rated Snow Boots,Bomber hat and Scarve, with -25C grade gloves.
Staying dry is VERY important in that level of cold.
Most people have no idea that BREATHING in that cold air is no fun.
Unfortunately, we won’t be able to put our foot in the water, as things will be froze over.
Enjoy this video of a tourist in Tuk stick his foot in the Arctic Ocean. We’ll just have to settle for walking on the ice.
https://www.youtube.com/watch?v=iNokpHrtYQI
This just prooves how far ahead of his time Al Gore was.
The melting arctic he predicted already happened 46 years ago.
No we just need a ‘progressive’ study about:
“How many wrong predictions,failures and contradictions by ‘experts’a leftist brain needs
before it is willing to acceppt and realise that there is something absolutely wrong with
the official AGW truth”
It’s a great map (saved) – the Nat’l Geo map. On the link I noticed that it zooms in and everything is very legible. The history of the NW passage voyages, the movement of the magnetic north pole, and I noticed that the edge of the ice is labeled, “limits of multi-year ice.”
That’s a bit different than the edge of the ‘sea ice extent.’ Just curious about how different such a plot would appear.
FTR – I’m firmly planted in the view that nothing unusual is going on with the climate, including the Arctic.
My problem with the NG chart is that the ice extent is likely notional rather than observed. Full Arctic coverage Observation did not start until 1979. All the recent charts show a much smaller extent of true multiyear ice although much more recently than the storm caused nadir in 2012. Multiyear isn’t on the Sinerian side as proven by Russian use of the Northeast Passage. If its not really multiyear ice, depends on when observed and the chart is silent. Not Tony’s strongest Arctic comparison.
You have a good point, however the Satellites doesn’t see all the ice either, as it doesn’t have the full resolution capability to see all the thinner, small pieces of ice.
Eh, any ice that remains at minimum extent becomes multi-year ice. It forms in its first year, survives its first summer, and begins is second year.
It’s not perfect, but do you have a better more accurate map? If it’s the best map available, it’s the best map available. It’s not like this was from the Dark Ages.
I can tell you that based on all Tony’s work, i would trust a map from 1971 FAR more than a 2017 Warmists’ extrapolation of what they think it should have been.
Having trouble seeing the date on the map. Or the methodology.
Yet I am confident their motivation was honest. I am equally, nay, more confident their motivation is now corrupt.
I still have the NG copy.
If all goes according to plan on my trip to the Arctic in December and the new road from Inuvik to Tuktoyaktuc is complete, I will be able to personally inspect Arctic sea ice conditions and will try to send back picures.
You have given me a reason to keep the full Nat. Geo collection on CDs that Ibought afew years back… it will be hard to change that history….
The road to Tuktoyaktuk
https://www.youtube.com/watch?v=vbj_lQaDvyA
Driving to the Arctic can be hazordous to your mental health. Look what happened to this couple.
https://www.youtube.com/watch?v=txrPyNVUXwA
LOL…………………
Solar disk spotless and speckless for the 4th straight day.
And we have no idea what date the 1971 ice map was produced on, or the basis on which it shows sea ice (e.g. today extent is shown where over 155 of sea ice covered)
You might as well compare the current state of the ice to a page ripped out of an old school atlas.
and then there’s the thickness/mass of the ice – which we know today is very much thinner than 1971
LOL! Griff you are to Arctic ice what the legacy media is to the Trump administration.
It shouldn’t have been there in the first place but now that it is it’s rotten, crumbling, and weak and one way or another we’re going to make it go away or at least keep talking like it is going to go away.
Never mind that the Arctic Temperature has been running below the 44 year mean for well over 100 days straight now. And that most of the Arctic is well below the melting point.
Yes, never mind that.
It is still melting
The Arctic ice is melting in the NH summer? Quick, get Ms Griff the Nobel!
Yes, never mind that.
Millions still starving.
Why do you hate poor brown people Ms griff?
“It is still melting”
Do you think they will be lucky enough to get more than a few weeks of fishing and travel in this year, before they are all icebound yet again.
Good thing the Russians have a new fleet of ice-breakers, hey. :-)
Griff,
no kidding since it is SUMMER,it has ALWAYS been melting some in May into early September time frame.
It looks like it will be another year of no more decline since 2006.
And Arctic SSTs are COLD.
The intrinsic properties of Ms Griff’s mind …
We know that YOU have NO IDEA..
And you DON’T know it is thinner than 1971..
You are a petulant little bed-wetting LIAR, griff.
Today’s extent has been shown to be above that of 90-95% of the last 10,000 years.
It really is still ANONALOUSLY HIGH compared to most of the rest of the Holocene.
But griff still does the chicken-little type bed-wetting.
Not much melting up at Obuoy 14 with a lot of cloud and temps slightly above and often slightly below freezing recently. Signs of the melt pools refreezing on the webcam this AM.
Rah …. how about a couple of ur buds come out of retirement and we grab Grif in a Black Op action and take him up to Obuoy 14 and tie him to the buoy?
http://obuoy.datatransport.org/monitor#buoy14/camera
I think Griff would be safe because no self respecting polar bear would eat a stinkin’ troll like him and he sez it is toasty warm now ;-)
Anyone know of a way to copy and paste the webcam photo from Obuoy 14 or is just one of those internet forbidden items?
Just hit “printscreen”, and crop it in paint.
Thanks Andy
Na Stewart Pid. Not nearly a high enough value target for any kind of direct action mission.
PLENTY of sea ice on the Russian charts.
Orange is 7/10-10/10’s
Looks to me that’s a composite from 16-16th… well on the 22nd you can see the melt has progressed and what’s more how the concentration isn’t 100% – something the Russian chart doesn’t bring out
https://seaice.uni-bremen.de/data/amsr2/today/Arctic_AMSR2_nic.png
get out of bed before you wet it again, little griff.
That’s one heck of a lot of sea ice up there, little-mind.
Sea ice levels are far greater than they have been for 90-95% of the Holocene, only a little bit down from the EXTREMES of the LIA and late 1970’s.
Why do you hate people who live up there , that you wish them to go back to those harsh , bitter times?
A more open Arctic, for at least part of the year would be a massive benefit to them.
Travel, fishing, commerce all become so much easier, but you want to DENY them that benefit.
Your inner HATRED of human life is totally disgusting.
How does this look to you Ms Griff? Good?
This has a neat chart showing that today’s ice state is already below the lowest point for dates in the 1980s
http://www.climatecentral.org/news/arctic-sea-ice-melt-since-the-80s-21637
Oh, no, she won’t go …
It pleases me that Griff has found employment giving children rides … lord knows he has made an ass of himself on Tony’s blog long enough that it isn’t surprising that he transmorgified into the real deal!
Let me see – oh, that’s because it’s on a slight downward trend since the 1980’s. Interesting that the downward trend ended a decade ago now. Will be curious to see what’s next.
I’d imagine that if one had created this exact same chart back in 1980, looking at 2-4 decades of Arctic sea ice extent growth, it might have shown that in 1980, the state of the ice on this day, might have been at the highest point compared to the 1950’s, 1960’s.
Like this:
Everybody knows that 1979 was a massive EXTREME in Arctic sea ice, up there with the extremes of the LIA. Why do you want to go back to those cold harsh times.?
There is still a LONG way to go to RECOVER to the much lower Holocene average, but unfortunately that recovery seems to have halted for the last decade or so.
You are wetting your bed about nothing , chicken-little girl.
Gee, nowhere on that chart does it show that 21,000 more people were starved to death yesterday by CAGWBS alarmists. What makes that chart so neat for you Ms Griff?
It’s neat because it was created to support Ms Griff’s priorities. And besides, it’s just neat. Nice font, nice colors against the background.
Charts about kwashiorkor are not neat. Just look at it, is that a neat chart?
Maybe Ms Griff would find the colors of the photographs neat. They would make a good National Geographic coffee table edition for the exalted London classes.
After all this time you still haven’t figured out that the extent hit a high in 1979? How old are you?
Its not as if griff hasn’t been informed.
I guess it spends too much time drying bedsheets to actually LEARN anything. !!
1911-
/ NORTH-WEST PASSAGE’
‘/ TRAVERSED. ‘
QUEBEC, 26th September.
The Canadian Government ship ‘ Arctic
has -returned from a long exploratory trip,
during which she made the North-West-
Passage from the Atlantic to -the Pacific,
and surveyed Banks Land, west, of Arctic
America.
According to garyh845 the map from ’71 shows multi-year ice. Compare it yourself with https://realclimatescience.com/2017/03/multi-year-arctic-sea-ice-extent-at-ten-year-high/
Also don’t forget that NSIDC’s map shows ice extent as in “more than 15% coverage in 25km2 area”
The line in the map is at 85% water. I tell you. It’s true, it’s a real thing.
Multi-year ice is ice that is around at the end of the summer. i.e. now. So… duh.
Do you mean “duh” as in “end of summer” equals “July 17th” (Your pick for NSIDC’s map)?
And what about the complete lack of data on the ice coverage NG used ?
To all you people who are name calling and throwing insults at Griff: I’ve always thought that when you have to resort to such tactics it exposes weakness in your argument. I searched through Griff’s comments and found nothing similar.
I’m new here, don’t know Griff at all, and happen to agree that the data doesn’t support global warming – certainly not man-made at least. But I’m certainly disappointed in the bashing of a person who appears to be simply trying to discuss the issue from their diverging viewpoint. Since when does truth need to do that? If you can’t support your point of view with civility and information, I suggest you shut the hell up.
I agree with bman,
I was disappointed reading all of the disparaging remarks made against Griff. Ad hominem attacks are the weakest form of argument and show insecurity and immaturity. Griff might be wrong but calling him names will not likely convince him to re-evaluate his position.