
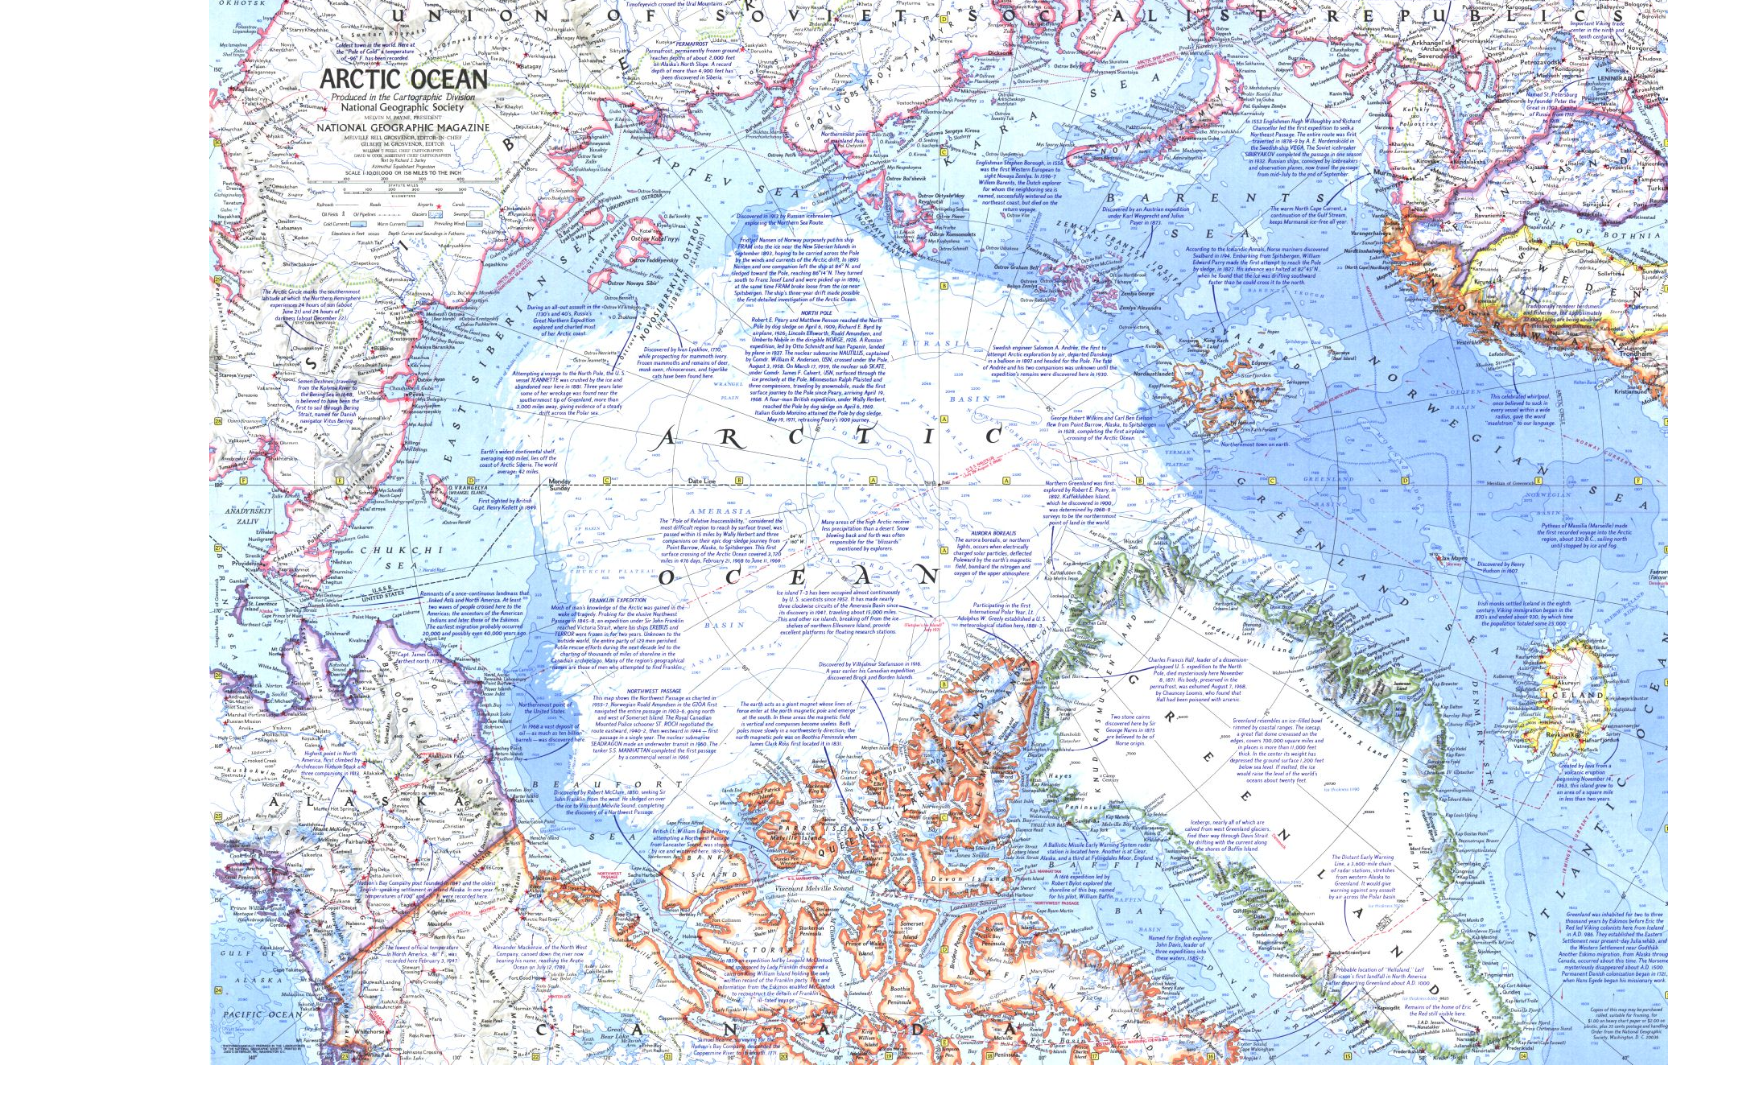
National Geographic published this map of Arctic sea ice extent in 1971
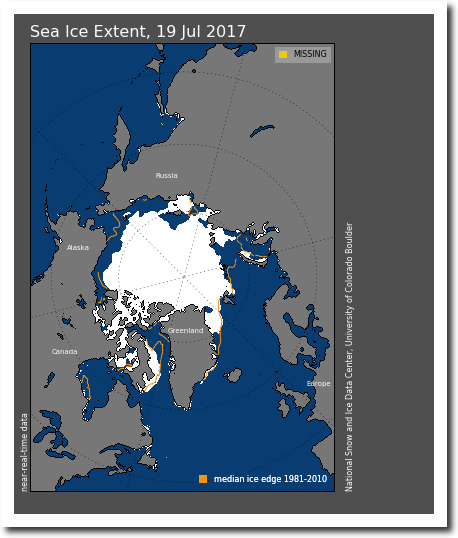
This map is current sea ice extent.
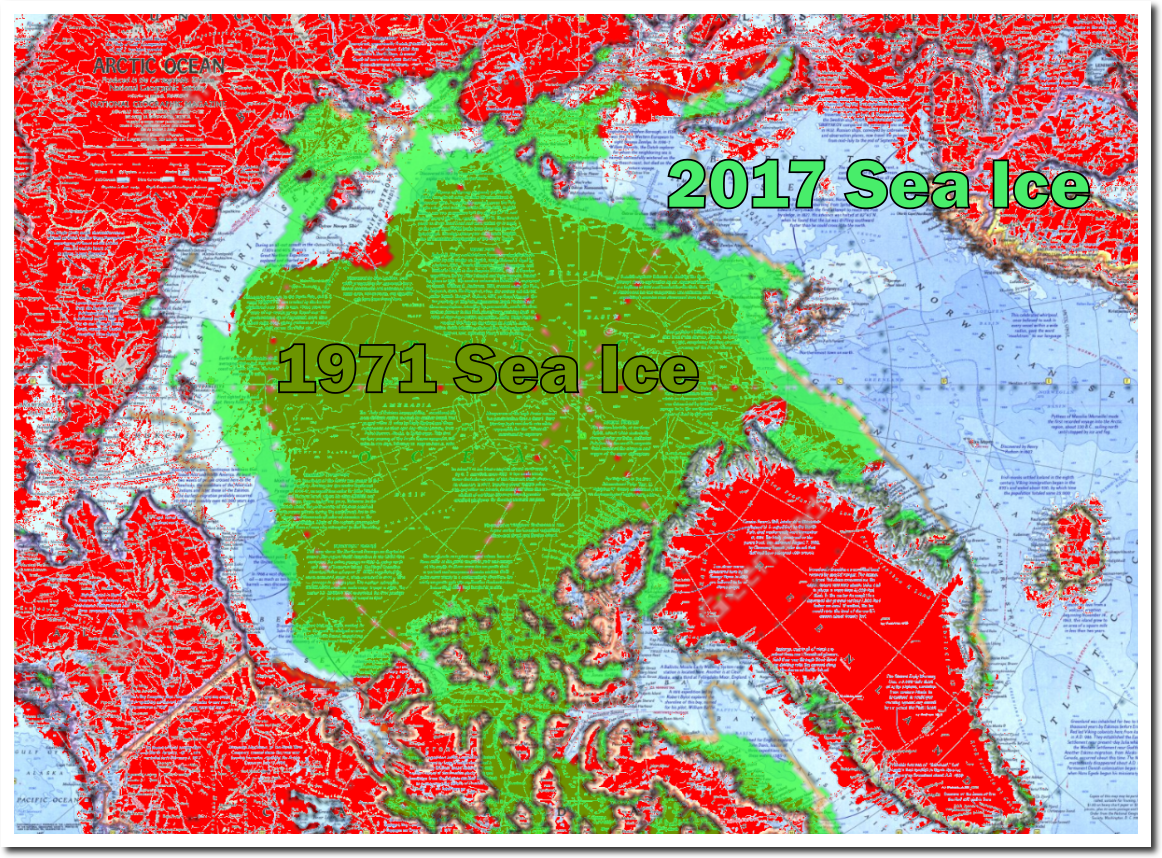
I overlaid the images at the same scale. The 1971 edge is shown in brown. The current edge is shown in green. As you can see, the current edge extends quite a bit further than the 1971 edge. The edge will shrink some over the remainder of the short melt season, but cold air in the Chukchi and Beaufort Seas will minimize melt for the next few weeks.
This map is consistent with data from the 1985 DOE report “Projecting the climatic effects of increasing carbon dioxide” – which showed low ice extent prior to the 1979 peak where fake climate scientists always start their graphs.

Arctic Sea Ice Fraud | The Deplorable Climate Science Blog
Newspaper accounts from the 1950’s confirmed that sea ice extent and thickness was low.

The Changing Face of the Arctic; The Changing Face of the Arctic
The mainstream press won’t report this, because they aren’t interested in facts or science.
