Arctic sea ice extent is well above the ten year mean.
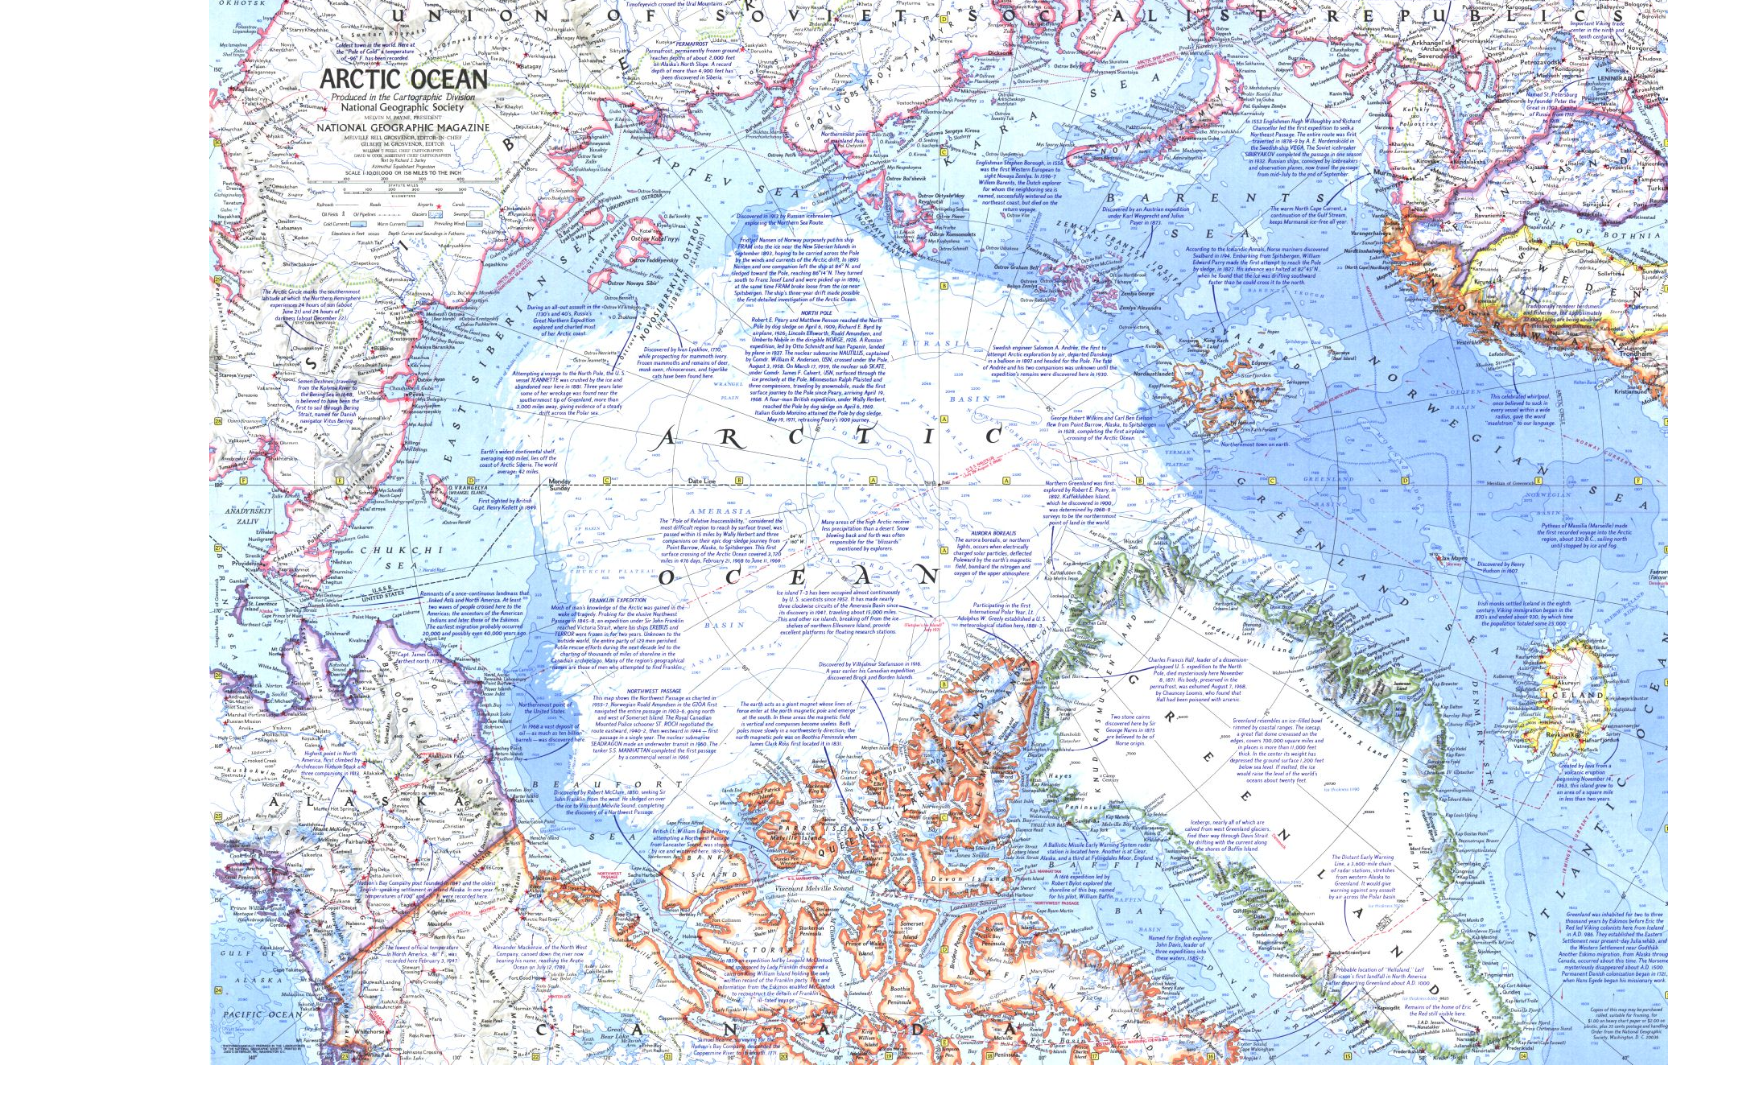
National Geographic published this map of the Arctic multi-year sea ice edge in 1971
Here is the current map for Arctic sea ice – all of this ice is by definition multi-year ice, because it has all survived the summer.
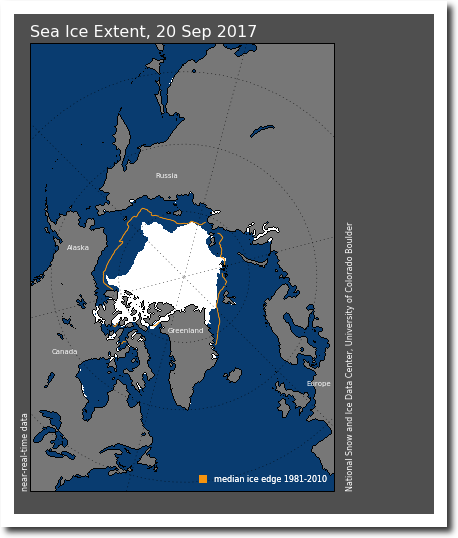
N_20170920_extn_v2.1.png (420×500)
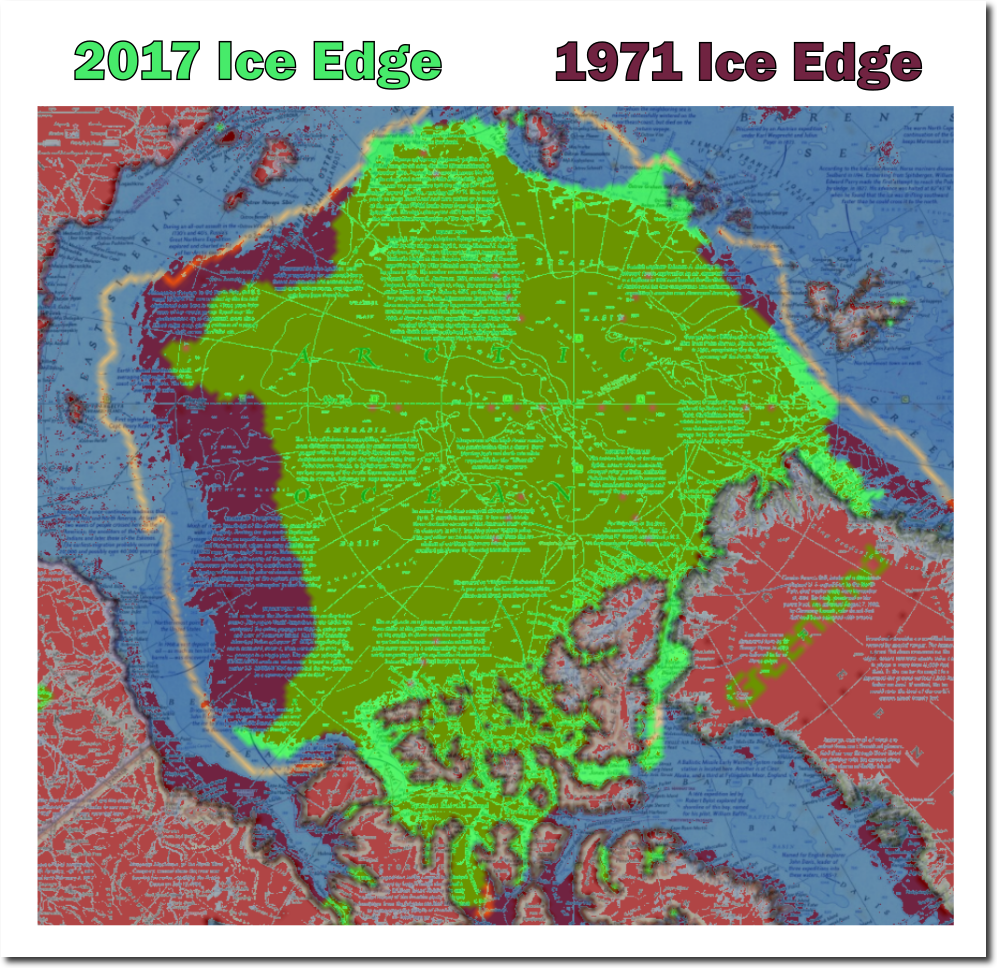
The next image overlays the two. Green is 2017 and red is 1971. There is a little bit less ice thank 1971. Also note that the 1971 ice edge was inside of the NSIDC pink median line.
Government agencies like NOAA, NASA and NSIDC start their sea ice graphs in 1979, in order to make it look like there is a linear decline in sea ice.
ftp://ftp.oar.noaa.gov/arctic/documents/ArcticReportCard_full_report2016.pdf
NOAA claims they don’t have satellite data before 1979, but they are lying. The 1990 IPCC report showed NOAA satellite data back to 1973, which was much lower than 1979.
In fact, there is good ice data going back to the 1920’s, which shows that ice extent was very low in the 1940’s and 1950’s.
Projecting the climatic effects of increasing carbon dioxide (Technical Report) | SciTech Connect
This agrees with historical accounts at the time.
The Changing Face of the Arctic; The Changing Face of the Arctic – The New York Times
I combined the DOE and IPCC graphs, to show what government agencies are up to. They start their linear graphs at the century maximum sea ice extent.
Then fraudsters like John Cook release completely fake graphs like this, so that they can blame it on “human activity”
Human activity is driving retreat of Arctic sea ice
Arctic warmth and melting is cyclical. In 1922 the Arctic was melting rapidly.
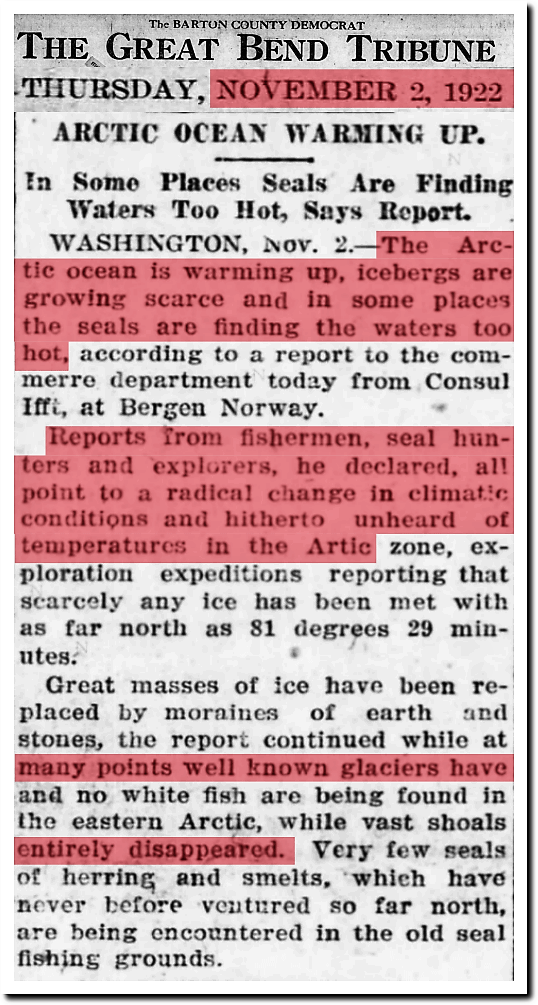
2 Nov 1922, Page 1 – Great Bend Tribune at Newspapers.com
Instead of trying to understand past warmth, government climate scientists simply try to bury it with fake data.
Data.GISS: GISS Surface Temperature Analysis: Analysis Graphs and Plots
Like all of the other climate scams, the Arctic melting scam is based on junk science, hidden data, fake data and corrupt scientists.
DMI sure seems to be playing games with their extent chart. Notice the step up in the red “Operational Product” line from the black “Climate Data Record” line?
http://ocean.dmi.dk/arctic/icecover.uk.php
They bumped their “Climate Data Record” line down from where it was when it was the “Operational Product” line leaving that obvious stair step.
Ever since I had that run in with them about their sea ice thickness map, they quit updating it.
Great Post Goddard.. Lots a info listed!
Its sad and bullshit Fraud when these Government Sources sneak around with the Data.. And we have to try and figure it out..
Across the Web and on Twitter the same #Climatards keep posting and reposting the same adjusted, normalized, gridded, weighted, and homogenized data DESIGNED TO SHOW WARMING!!
Total Fraud when most underlying Official Govt sources are RiGGeD!!
Keep up the Great Work, and Thank You!
“….Total Fraud when most underlying Official Govt sources are RiGGeD!!….”
Newest take on RIGGED GOVERNMENT FRAUD:
Pennsylvania
Pennsylvania Motor-Voter Registration “Glitch” Allows Non-Citizens To Vote in Elections same type of ‘Glitch is also used in Californicate and who knows how many other states.
Judicial Watch on “The Election Integrity Project”.
North Carolina
More than 35,000 people may have double voted by casting ballots in North Carolina and another state during the 2012 election. In 2016, the N.C. Board of Elections has found that 508 voters who cast ballots last November weren’t eligible to vote – and the vast majority of them were felons serving active sentences.
Durham County(mostly Black Democrats) extended voting in eight precincts from 20 to 60 minutes because of demand by Rev. Dr. William Barber, president of North Carolina NAACP. On election night, Cooper was trailing McCrory until 90,000 votes from Durham came in late. Cooper won by fewer than 10,000 votes. Funny thing, ONLY Cooper and Clinton were filled in on the ballot so we have a Republican Lt Gov and a Democrat Gov!
New Hampshire
In New Hampshire in 2016 it was found 6,540 people voted using out-of-state licenses. Over 80 percent, 5,313, who used non-N.H. driver’s licenses, have neither a NH state license nor had registered a motor vehicle since then. The statistical probability that our President (margin of defeat was 2,736) and Republican Senator, Kelly Ayotte (margin of defeat was 1,017 votes) lost the state of NH due to cheating is nearly irrefutable!
Massachusetts
“…The anonymous letter said that a corrupt RMV employee was providing stolen identifications and drivers’ licenses to individuals seeking false IDs, the DOJ announcement states. An investigation ensued and authorities discovered that the four clerks were working with a document vendor and document dealer to provide the licenses and official state ID cards to illegal immigrants in exchange for cash. “The scheme involved several steps,” the DOJ says. First, the document dealer sold a Puerto Rican birth certificate and U.S. Social Security card to the document vendor for approximately $900. The vendor would then sell the stolen identities for more than $2,000 to illegal aliens—some with criminal records—seeking legitimate identities in Massachusetts. After the first layer of illicit transactions occurred, the counterfeit documents and false identities and addresses were used to fraudulently register clients to vote in Boston….” (wwwDOT)judicialwatch.org/blog/2017/08/licenses-id-cards-sold-illegal-aliens-corrupt-state-workers-used-voter-fraud/
……………
We really have a third rate Banana Republic government. Seems the entire darn system is rotten to the core with ZERO honesty or integrity.
I’m sorry Gail, but I must object, you could not be more wrong. We have a first rate banana republic.
? THIRD RATE!!! ?
Stop smearing our republic! First rate, I sez!
2nd rate….
Gotta leave some room for change. :-)
Gees if you hurry, you can catch up to us down here in Oz !
The issue hear is that Tony went to DMI when not happy with US based graphs. That was followed for a while but then DMI had a big issue a while back where they swapped data sets and because scientists more interested in doing science than updating their graphs for sceptics and warmists. Lots of fingers burnt ….
The problem is if you are not happy with data and keep turning to another “true source” then you start to run out of sources !
I’ve been saying for years, JAXA, they are the best
https://ads.nipr.ac.jp/vishop/#/extent
what more could you want.
They are releasing a new sat soon
Dear xxxxxxxxxxxxxxxxxxxxxxxxxx,
Japan Aerospace Exploration Agency (JAXA) plans to launch an Earth observation satellite named Global Change Observation Mission – Climate (GCOM-C) as the successor of ADEOS-II in the latter half of the Japanese fiscal year 2017. The GCOM-C satellite is equipped with the Second-generation Global Imager (SGLI), an optical sensor that has similar or higher spatial resolution (250 m, 500 m, and 1 km) compared to GLI and MODIS, and performs the functions of the two-directional observation at visible and near-infrared wavelengths with the polarization information. The SGLI is expected to analyze various geophysical variables, including those provided as MODIS NRT (and GLI) data, thereby enabling the SGLI to take over the role of GLI and MODIS.
The release of the SGLI-observed geophysical variables is scheduled for initiation around one year after the launch of the GCOM-C satellite. The same geophysical variables*1 as those obtained from the MODIS NRT data (including JASMES (Japan) data) are planned to be retrieved from the SGLI and released to the public through the same interface. JAXA will make an announcement regarding the SGLI NRT data release after the completion of SGLI data preparation as soon as possible. We would appreciate it if you could switch the satellite data from MODIS NRT to SGLI NRT after the initiation of the SGLI data release.
In accordance with the launch of the GCOM-C, JAXA has decided to terminate data reception from NASA’s MODIS sensors at JAXA’s Earth Observation Center (EOC; located at Hatoyama, Japan) on March 31, 2019, which has been in operation since July 2004 after the termination of the ADEOS-II/GLI operation in October 2003. After the termination of the MODIS data reception at the EOC, several MODIS near-real-time (MODIS NRT) and JASMES (Japan) data/images which uses the MODIS data received at EOC will become unavailable (please refer to the link shown below for the details).
It should be noted that the reception of the MODIS data at the Tokai University Research and Information Center/Space Information Center (TRIC) is not planned for termination after the launch of the GCOM-C satellite. Thus, the release of the MODIS NRT data from the TRIC will continue. In addition, JASMES (Global), JASMES (Thai), JASMES (Gobi), and JASMES (Polar) do not use the EOC-received MODIS data as input and thus are not planned for termination of data production.
oops, here not hear. Forgive me old English teacher.
Gee, who was that masked commenter?
Not Andy
little andy has progressed to cut and paste. !
last January a ship called The World set a record as the most southern navigation ever.
the point was according to google earth on the Ross ice shelf itself. Now previously the southernmost record was set by the RRS Discovery on the 1901 expedition of Scott and Shackleton. Their southernmost navigation when charting the Ross Ice shelf was 14 km north of the current record. So in 120 odd years the Ross Ice shelf has retreated 14 km.
The Ross Ice Shelf retreated five feet per day from 1840 to 1930
https://realclimatescience.com/2015/09/antarctic-glacier-retreated-five-feet-per-day-from-1830-to-1930/
Anyone knows or should know these huge masses of ice Grow, then collapse under their own weight and gradually from the motion of the Sea..
When the arctic ice in our global warming era is as huge
as the one during the official ice age era
than one may think that both never existed
(outside the minds of scientists)
especially when the number of (we’re-going-extinct-because-of-global-warming)
ice bears rose by almost 500% since the (formerly-official:now-we-pretend-we-never-said-so)ice age) 70ies.
Don’ forget about those poor Coca-Cola polar bears – they’re going extinct!
Of course we all know polar bear populations are increasing (I’m surprised that data hasn’t also been suppressed/altered). Maybe the MSM will turn their attention to those poor Artic Foxes – their numbers must be decreasing, right?
Arctic Foxes, they’re what’s for (Kodiak) dinner.
What methodology was used for the cook graph? Mann-esque proxies and statistics?
1979 is probably the most obvious cherry picked starting date in the history of science. What these crooks are saying is that any decrease in sea ice since the coldest year on record is evidence of catastrophic warming. Totally ludicrous and totally deceitful! For anyone inclined to believe that global warming is a deliberate scam and a total sham, the knowingly fraudulent 1979 starting date for Arctic sea ice is the place to begin!
As is the continued REFUSAL of any of the Arctic sea ice bed-wetters to look at the real levels of sea ice over the whole Holocene.
Climate Change DENIERS, every one of them.
… and shoplifters. Same part of the brain.
And if you read the text of that 1990 IPCC report
https://www.ipcc.ch/ipccreports/far/wg_I/ipcc_far_wg_I_chapter_07.pdf
it says:
Especially importantly, satellite observations have been used to map sea-ice extent routinely since the early 1970s.
Steve: Yep. The new Nimbus generation went up at the end of 1978, just in time for an exemplary year. The new technology (multiple channels and polarizations) gave the satellites the ability to resolve multi-year ice, which they could not with the earlier generations.
When looking last week, I found the references to the earlier NASA satellite work, and passive radiometer images from Nimbus 5, 1973-1976. The B&W photocopies of the color reports were less than impressive, but the work was done, and (within the TAR) was being reported.
Oh, and a little OT: Pretty good snows in the upper elevations of Oregon and California on the last day of Summer. The view from the Mammoth mountain webcam is pretty beautiful, and Squaw Valley had some, too.
At WUWT, they are saying that glaciers in Glacier National Park appear to be growing.
Snowed there, too. Logan Pass parking lot has snowplowed piles, and fresh snow is still on the lodge roof.
Didn’t snow here, though.
But then, it never does. :-)
Just looking at latitudes
Newcastle is about the same south as Dallas Texas is north of the equator.
But we are right on the coast, elevation 9m
To be fair, Tony, you are comparing current Arctic sea ice edge with National Geograpic’s multi-year ice edge. You know this. Anyone interested can simply click on the 1971 ice map and see that it is NOT 1971 CURRENT ice edge, it is average MULTI-YEAR ice edge (zoom in on the dashed line). You complained mightily when their average multi-year ice edge showed that in 2015, it was so much lower than actual current ice edge.
https://realclimatescience.com/2015/08/spectacular-climate-fraud-from-national-geographic/
But now, you are using their 1971 multi-year Arctic sea ice map as an accurate representation in comparison to current Artic sea ice levels. Are facts simply beyond you? The fact that current ice levels become multi-year ice levels, soon, doesn’t mean that your comparison is valid. Either confirm that NG Arctic multi-year sea ice levels are not comparable to current Arctic sea ice levels, or that you were wrong in complaining about their alleged ‘fraud’ in 2015.
Any readers here, of course, can look up the NG viewpoint, but I suspect not. Here it is, anyway…
http://ngm.nationalgeographic.com/2016/01/arctic-ice-shrinking-graphic-environment-text
http://www.nationalgeographic.com/magazine/2016/01/arctic-ice-environment/
http://news.nationalgeographic.com/2017/02/antarctica-sea-ice-hits-record-low-global-warming/
http://video.nationalgeographic.com/video/news/170323-nasa-polar-ice-low-2017-vin
http://video.nationalgeographic.com/video/climate-change
http://news.nationalgeographic.com/2016/06/ice-melting-greenland-jet-stream-weather-climate-change/
https://www.nationalgeographic.org/encyclopedia/arctic/
http://news.nationalgeographic.com/news/2012/08/120828-arctic-sea-ice-global-warming-record-environment-science/
As I explained in the post, all current Arctic sea ice is multi-year ice – because it just survived the summer. NSIDC increments the age of the ice during the week of September 17.
Perhaps you should actually read the article before making incredibly stupid comments?
Greg, you seem to be yet another Climate Change DENIER.
Current levels of sea ice are above those of 90-95% of the last 10,000 years.
It is ANOMALOUSLY HIGH.
Do you DENY this fact?
The Russia sea ice maps show almost exactly the same as Tony’s.
National geographic is a manic AGW propaganda site, you only have to read some of the moronic anti-science nonsense in your links to know that. !
I mean, just their headline shows just how MORONICALLY IGNORANT they are !!
“Antarctica’s Sea Ice Shrinks to New Record Low ”
BULLSHIT. restricted to an insignificant40 year period in a drop from the highest extent in 10,000 years. It was near summer ice free for much of the first ¾ of the Holocene.
Is the ignorance WILFUL, or just how they are, dumb and ignorant?
NG is pure PROPAGANDA PAP. And fools like you fall for it every time.
Agreed, they should just go back to posting nude pictures of African tribeswomen for boys to look at
Some good info in this archived book pages 470-sect 162 .
http://www.archive.org/stream/arcticice00zubo#page/470/mode/2up
cool, Fred:)
I notice that the Greenland SMB is still above the mean and starting out above the level it was at this time last year.
http://www.dmi.dk/en/groenland/maalinger/greenland-ice-sheet-surface-mass-budget/
Tony.
You have connected up an anual sea ice area graph and an anomaly graph
https://realclimatescience.com/wp-content/uploads/2017/02/Screen2-Shot-2017-02-14-at-6.17.49-AM.gif
You can’t do that as it does not show what you are trying to show. You need to show either one or the other.
For the area graph
https://realclimatescience.com/wp-content/uploads/2017/02/Screen-Shot-2017-02-14-at-6.12.59-AM-down-904×1024.gif
I wonder where they got their figures from because the values they have for the annual mean is only just higher than the summer minimum and far lower than the mean amounts we have today. People would have been going through the NW passage 4 months of the year quite happily !!!
Andy
“You need to show either one or the other.”
You mean like the MASSIVE EXTREME of Arctic sea ice in the late 1970s, coldest period in Arctic region since the 1930s?
Or the large dip the Arctic ocean sea ice from 1930s to 1950s which is exactly a match to the AMO?
Or are you going to continue to DENY real data, like the moronic little AGW suckophant you are.
No, I mean like doing a graph of sea ice extent or sea ice anomaly for the entire time period. Not stitching two completely different graphs together as it does not show anything.
Or are you saying splicing different types of graphs onto each other is ok then? I bet you mention the Holocene again rather than answering the question. Perhaps in capitals. Empty bottles make most noise of course.
Andy
Watching you squirm and slime your way around admitting the truth.
So funny, little andy
You really are a climate change DENIER, aren’t you.
Still waiting for you to admit to the fact that current levels of Arctic sea ice are above what they have been for 90-95% of the last 10,000 years
Or are you going to keep up your wilful DENIAL of climate change?
“Or are you going to keep up your wilful DENIAL of climate change?”
Are you saying climate change is happening then? Are you an AGW person?
???????
:)
Andy
Captured for posterity
https://i.imgur.com/Aopd3zQ.jpg
I am still chuckling……
I’m going to beat you with that for eternity now, I have outed an AGW spy in our midst.
Andy
You are making a moronic FOOL of yourself, little andy.
Do you DENY that the first 3/4 of the Holocene was significantkly warmer than now, and often had zero summer sea ice?
Do you DENY that only a couple of hundred years ago we had the Little Ice Age, which was the COLDEST period in 10-,000 years?
Do you DENY that current temperatures are only just a bit above that coldest period.
Do you DENY that current Arctic sea ice levels are above what they have been for 90-95% of the last 10,000 years.
YOU are the climate change DENIER, little andy !!
You are just WAY TOOOO DUMB to realise it.
“I have outed an AGW spy in our midst. ”
Now where did I say there was any anthropogenic in climate change.
You have outed yourself as A DECEITFUL LIAR !!!
“Are you saying climate change is happening then?”
Good Grief, OF course the climate is changing. It always has and always will. It especially changes wildly just before the transition into the cold state.
Every ice-age began when CO2 was at or near peak levels, in other words, high CO2 levels were not enough to prevent ice ages. The last interglacial was the Eemian. It was in fact LEAP that terminated the last interglacial, the Late Eemian Aridity Pulse which lasted 468 years and ended with a precipitous drop into the Wisconsin ice age. (LEAP = Late Eemian Aridity Pulse, a major spike resulting in massive sea level rise JUST BEFORE the descent into glaciation.)
A late Eemian aridity pulse in central Europe during the last glacial inception
(Except more recent papers show glacial inception at the 65oN July insolation as high as 500 Wm2. See paper at end of comment.)
Instability of climate and vegetation dynamics in Central and Eastern Europe during the final stage of the Last Interglacial (Eemian, Mikulino) and Early Glaciation
This paper tells you there was a major spike resulting in massive sea level rise JUST BEFORE the descent into glaciation.
Neuman and Hearty tell us that during the interglacial to glacial transition “sea-level changes that were rapid and extreme”
In case you were hoping for a double precession cycle:
Lisiecki and Raymo (2005) states:
That’s a long post to try and justify AndyG55 having a blonde moment. Or blonde keyboard interaction moment due to the caps button …
No point trying to dig him out of that hole Gail, you will just get covered in mud…..
Andy
PS What are your thoughts on Tony stitching together an anomaly graph and an extent graph for two different time periods?
Come on little andy.
ADMIT that Arctic sea ice is above what it has been for 90-95% of the Holocene.
PROVE you are not a DENIER of actual climate change.
Waiting for you to ADMIT THE FACTS… or remain a cowardly little anti-science worm.
The national Geographic map has as a label
….nationalgeographicmap.aspx?mapname=1971_10…. or October 1971 Arctic Ocean. Around the edges of the ices is the label LIMIT of Multi-Year Ice That is the MAXIMUM EXENT known in 1971.
That seems pretty darn straight forward to me. As of October 1971 the map shows the MAXIMUM Extent (= Limit of) amount of Multi-Year Ice. Tony is then comparing the 2017 Multi-Year Ice to the MAXIMUM aka Limit of Multi-Year Ice as known in 1971.
That is the same type of comparison as is done in the first graph by NOAA looking at the average sea ice extent plus 2 Std. Dev vs 2017 only Tony is doing it pictorially.
It is again noted that little andy squirms away from any actual science. It scares him, poor little worm that he is.
Cannot bring himself to admit to natural climate change, and has to invent things that were not said, just to pump up his scientific emptyness.
PATHETIC and COWARDLY.
Gail, don’t expect little andy to understand anything about actual science. He has only brain-washed sludge.
His DENIAL of natural climate change is hilarious to watch, though. ;-)
Link to the map that lets you get right into the detail
Heck you can read the “Limit of ulti-year Ice quite easily
http://data.cdn.realviewdigital.com/ngmaps/nationalgeographicmap.aspx?mapname=1971_10_Arctic%20Ocean_side%201&label=ARCTIC%20OCEAN
The wilful DENIAL of climate change continues from little andy.
Cannot face the facts can you little child.
I was answering the question YOU asked:
“Are you saying climate change is happening then? Are you an AGW person? “
The climate changing has NOTHING to do with mankind. It has been changing for billions of years without our influence. YOU are pulling the con of climate change can ONLY be caused by humans and I refuted that Dis-Info with peer-reviewed papers.
climate change =/= AGW except in the Politically Correct Speak of the UN.
The UN Framework Convention on Climate Change ratified 21/03/94 (signed 12/06/92) redefines the phrase “climate change” as 100% caused by humans.
Here’s the official definition:
“Climate change” means a change of climate which is attributed directly or indirectly to human activity that alters the composition of the global atmosphere and which is in addition to natural climate variability observed over comparable time periods.”
That’s from the official UN Framework Convention on Climate Change (http://unfccc.int/essential_background/convention/background/items/2536.php). or
https://web.archive.org/web/20140913102734/http://unfccc.int/files/documentation/text/html/list_search.php?what=keywords&val=&valan=a&anf=84&id=10
The term specifically excludes all natural climate change, and even excludes any caused by humans due to, for example, land clearance or city building, considering only atmospheric changes.
Typical COMMUNIST CRAP!
“I wonder where they got their figures from ”
And you will REMAIN ignorant, because its who you are.
30 July 1942: Soviet Pacific Fleet destroyers Razumny, Razyaryonny and Baku entered the Bering Strait and travelled west to reach the Soviet Northern Fleet on 14 October
Question for Tony.
Firstly thanks for the National Geographic map they did back in the early 1970’s, it is a fantastic map showing lots of history and detail, book marked it for further reference, lots of information to read about. Nice find.
However I do think it cannot be taken to show a historic representation of the ice extent at that time. My reasons for this is the following.
1. Assuming it came out in the October issue then in those days the article must have been written late August or early September. Given this is the time that they did the map, and given the low extent, they have Iceland completely covered in ice. But if you look at Iceland in Sept 2016
https://visibleearth.nasa.gov/view.php?id=62109
It ain’t like that, so some artistic license is being used. To quote the text “By mid-October, the northern part of the island is snow covered, and by late October, the entire island is wearing its wintry blanket.”
2. We have seen before when map makers get it wrong, this time making Greenland more green that it should have been !
https://www.theguardian.com/environment/2011/sep/20/times-atlas-incorrect-greenland
I therefore think it is pointless trying to equate 2017 sat images to 70’s cartography where the artist had to fit all that information on.
Unless there are 3rd party links to show the ice extent, I am sure you will point them out if so, I have not dug that deep as doing other stuff.
It’s a very interesting topic though.
Andy
“I have not dug that deep as doing other stuff.”
Like making an abject FOOL of yourself.
I’m still waiting for Andy to show us where he has harrassed a warmist nearly daily for years on end. Andy lies about being fair minded, he is simply another doomer through and through, with no concern for the millions of humans the religion CAGW kills through starvation.
Not Andy
little andy has now been shown to be a deceitful liar, making up things that were never said, in his continued slithering to escape admitting to natural climate change.
little andy is nothing but another anti-science troll and climate change denier..
“they have Iceland completely covered in ice.”
BULLSHIT…… what hallucinogens are you taking today.?
Gail wrote this:
“The national Geographic map has as a label
….nationalgeographicmap.aspx?mapname=1971_10…. or October 1971 Arctic Ocean. Around the edges of the ices is the label LIMIT of Multi-Year Ice…”
AndyG55 posted this:
http://data.cdn.realviewdigital.com/ngmaps/nationalgeographicmap.aspx?mapname=1971_10_Arctic%20Ocean_side%201&label=ARCTIC%20OCEAN
It is clearly OCTOBER,1971
they have Iceland completely covered in ice.,,,
Andy, look again…..they do not have Iceland any more covered in ice than they do all of Alaska or all of Sweden….it’s a very light gray
little andy has NOTHING as always.
Why does he continue to parade his monumental ignorance and incompetence for all to see?
Is it just childish attention seeking?
I believe Andy, LIED about having e-mail correspondence with Dr. Stein,who should be thrilled in having his interesting paper get a vastly increased exposure to the world.
During these wars of the Andys, I feel obligated to add my two cents worth. Does Andy deny that 1979 was an absurd outlier year, where sea ice was at an anomalously high level, not seen since the Little Ice Age? Which was a deliberate attempt to deceitfully sneak a fast one in on the public. Namely that the sea ice was in a death spiral, while in reality it was merely returning to 1960 levels?
I don’t know if it started out being deliberately deceitful… (probably was though, because they did have prior satellite data)
.. but continued references starting in 1979, without the mention of it being the outlier with huge extent…
…certainly is wilful and deliberate DECEIT.
This sure looks like willful deception to me.
https://notalotofpeopleknowthat.wordpress.com/2017/09/23/crooks-still-pursuing-arctic-ice-scam/
Its as though they are trying to push some socialist totalitarian SCAM of some sort.
Ha well, the ice does what the ice does no matter how many people deny it or lie about it.
https://sunshinehours.net/2017/09/18/arctic-recovers-2017-is-8th-lowest-arctic-minimum/
sunshinehours uses NSIDC.
MASIE has 2017 at 7th lowest with the difference being 2010 higher
And let’s not forget that we should always add… “in the tiny period since the extreme highs of the late 1970’s”,
….. the current level is actually in the top decile of the last 10,000 years.
Try getting any AGW fanatic to admit to that fact, though. ;-)
2017 also has the smallest “melt from maximum” since 2006.