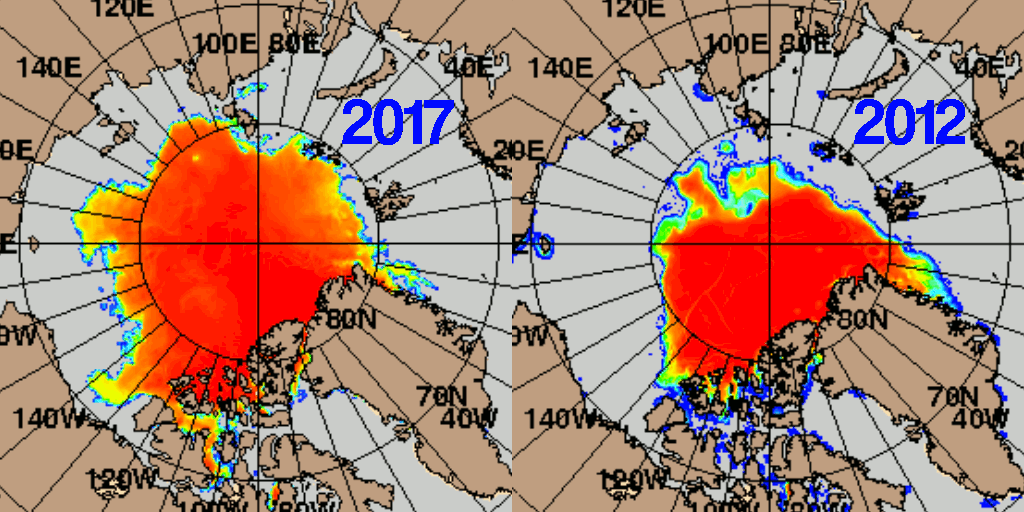
Massive Expansion Of Arctic Ice Over The Past Five Years

Something you won’t read in the fake news press is that there has been a massive expansion of Arctic ice over the past five years.

2012       2017

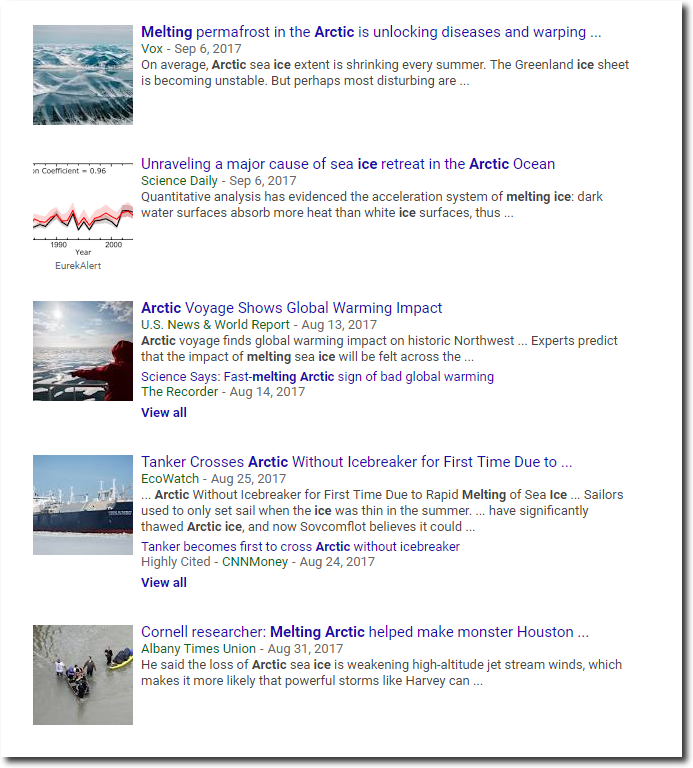
Climate scientists and the press are too busy committing fraud and lying to the public to cover this topic.

This entry was posted in Uncategorized. Bookmark the permalink.

48 Responses to Massive Expansion Of Arctic Ice Over The Past Five Years

  1. Thunder98 says:

    Griff will blame it on Global Warming

    • Griff says:

      Well duh!

      why do you think the ice is in its current state?

      Polar bears taking more ice with their gin?

      • Paul Homewood says:

        So global warming is responsible for the increased ice!

        Nice one Griff

      • arn says:

        Tell us why we have now more polar bears then when Al Gore told us they are about to go extinct.

        Is the reason “too much ice” or “not enough ice”.
        As lack of ice was,according to the AGW cult, the reason polar bears will disappear :
        What is the reason that these days there are 500% more polar bears than in the 60ies.

        What is your excuse for the next massivly failed prediction
        of your AGW gurus?

      • AndyG55 says:

        And how much Arctic sea ice SHOULD there be.?

        Should it be slightly more than now, like during the LIA?

        Should it be considerably LESS than now , like during the MWP?

        Or should it be A LOT LESS than now like during the first 7000+ years of the current interglacial.?

        You have dodged this question long enough, griff.

        If all you have is a highly beneficial drop from the abnormally high levels of the LIA and late 1970’s, why are you continuing to need constant nappy changing?

        • richard verney says:

          Sometimes less is more.

          It would be of great benefit if there was less sea ice. And I personally doubt that it would have any great impact on albedo.

          For sure, ice has a low albedo, but for much of the year there is little if any solar, and when the days are lengthy, the sun is still low in the sky such that the grazing angle over oceans will remain low leading to much reflection. The basic physics therefore does not suggest that there would in practice be much overall difference in albedo.

          But on top of that with open oceans there will be more evaporation from the ocean leading to more cloudiness thereby blocking some of the incoming solar. Thus albedo will likely increase due to increased cloudiness.

          When all these factors are put together, the loss of albedo due to the reduction of ice will be balanced out by the increase in cloudiness due to greater evaporation from the open ocean waters.

          the polar bears survived the Holocene Optimum so we know that they can survive periods of low 9or no) sea ice, and of course, we are presently seeing an increase in their numbers. So there is no genuine concern on that front either.

          That being the case, what is there not to like by a reduction in floating sea ice?

          Perhaps Griff can explain.

          • AndyG55 says:

            griff RUNS and HIDES from the very question.

            Brain-washed parroting is all the little bed-wetting tapeworm knows.

    • Martin says:

      The “ArcticMission” is almost back to Nome now having failed to get anywhere near the North Pole and having failed in it’s “voyage around the North Pole” Their blog has gone rather quiet – nothing posted for a week now.

      Perhaps it should be called “the ship of fails ” :)

      http://www.arcticmission.com/follow-arctic-mission/

      • pmc47025 says:

        The arctic mission website still has this description:
        “So welcome aboard, as we make one of history’s most extreme and urgent voyages”.

        Image?

  2. RAH says:

    I guess one could say that Arctic sea ice is “recovering” from it’s anomalous low of 2012. What ever “recovering” is supposed to mean.

    • Griff says:

      Recovering would surely mean heading back to pre 2007 levels?

      and the volume is lower than in 2012

      • RAH says:

        Who says pre-2007 levels are the proper amount of sea ice and why?

        And volume in 2017 is considerably higher than that of 2012 and even with 2011 according to PIMOAS

        Now show any evidence to back your claim.

      • Steve Keohane says:

        After several thousand years of ZERO ice, it has begun to grow again as we head towards re-glaciation, and you’re whining that it’s not fast enough?!?!?!

      • AndyG55 says:

        No griff. RECOVERY would mean a drop back towards the Holocene norm of considerably LESS Arctic sea ice.

        Why do you continue to DENY that current levels are actually abnormally HIGH?

  3. Griff says:

    no there hasn’t…

    while the 2012 ice shown was mostly concentrated, thick ice over 2 m, this year the ice has been frankly slush over much of the area shown in that diagram – and not much of it even 2m

    “average sea ice extent for August 2017 ended up third lowest in the satellite record. Ice loss rates through August were variable, but slower overall than in recent years. Extensive areas of low concentration ice cover (40 to 70 percent) are still present across much of the Eurasian side of the Arctic Ocean.”

    http://nsidc.org/arcticseaicenews/

    https://seaice.uni-bremen.de/data/amsr2/today/Arctic_AMSR2_nic.png

    https://www7320.nrlssc.navy.mil/hycomARC/navo/arcticictnnowcast.gif

    • Gator says:

      Still a lot of ice for an interglacial Ms Griff.

      Why do you hate poor brown people?

    • sunsettommy says:

      Griff,

      I see that you continue to be a stubborn moron,since YOU and Wadhams among others were wrong about this years minimum.

      You need to wake up to the fact that you have been conned.

    • Stewart Pid says:

      Ha ha … all that Griff the LOSER has to fall back on is that the ice is thin rotten ice. Too funny as that excuse is what 10 or 12 years old.
      Griff with the lack of the record melting you were beaking off about don’t you think it is appropriate to reconsider your logic?????
      The truly rotten thing is your reasoning process! The ice is just fine.

    • Paul Homewood says:

      average sea ice extent for August 2017 ended up third lowest in the satellite record.

      Not according to DMI.

      It is only the fifth lowest since 2007, in other words pretty much average.

      http://ocean.dmi.dk/arctic/sie_monthmean.uk.php

      • AndyG55 says:

        Average of what period, Paul?

        Normal for the last 10 years… zero trend.

        Yes, a drop from the abnormal extremes of the LIA and late 1970’s

        But considerably higher than the levels of the MWP.

        and during the first 7000+ years of the Holocene, there was often zero summer sea ice.

        So.. what is “average” ?

        Looking at the full interglacial, there is no doubt that current levels are still very much within the top quartile, possibly even top decile !!

    • AndyG55 says:

      You are a DENIER and a LIAR , griff.

      You KNOW that current levels are far higher than for most of the last 10,000 years.

      So your continued yapping, squawking and attention-seeking Arctic bed-wetting, can only be from your complete and utter DENIAL of facts.

      You are NOTHING but a DELIBERATELY DISHONEST TROLL.

  4. AndyG55 says:

    Nilas starting to form around the edges and in the NWP. (darker blue)

  5. AndyG55 says:

    Hey Tony,

    what’s happened to images?

    They don’t seem to be showing up.

  6. Lia says:

    Climatologists must be forced to accept different opinions, and those who don’t agree with them. Time to end their dictatorship.

  7. Avril Lavigne says:

    Stop cherry picking data that suits your narrative.

  8. Brian says:

    Here’s a graph from the DMI. Definitely shrinking.

    • sunsettommy says:

      Hello Brian,

      here is the TEN year chart:

      http://www.natice.noaa.gov/ims/images/sea_ice_only_small.jpg

      The decline has stopped.

      • Brian says:

        Hi Sunsettommy,
        Your chart is for 6 months Vs Ten year mean. It’s not a “ten year”chart. Lets take the DMI observations referred to above.
        Here’s the link.
        http://ocean.dmi.dk/arctic/icecover_30y.uk.php
        Here’s what the Danes say
        “The graph illustrates a decreasing trend in sea ice extent since 1978, with annual variations of occasionally more than 1 million square kilometres. The 2012 sea ice minimum extent set a new minimum record. The 2012 September minimum ice extent was only approximately half the mean sea ice extent from the period 1979-2000, – often referred to as a relative stable period for the sea ice extent. The blue trend line in the figure has a negative slope of approximately 60000 km2 per year. The data is provided by Ocean and Sea Ice Satellite Application Facility (OSISAF)

        • gator69 says:

          In 1979 the Arctic had an abnormally high concentration of ice for this interglacial. Cherry picking 1979-2000 and calling it anything other than what it was, a high point for Arctic ice, is just being dishonest.

          So what does that make Arctic alarmists?

          • sunsettommy says:

            That’s right Gator, Brian like many warmists,leave out the 1973-1990 Satellite data line.

          • AndyG55 says:

            Icelandic sea ice charts CLEARLY show the BIG DIP in sea ice extent from about 1930 to the mid 1970’s..
            Then a HUGE spike up to Little Ice Age levels in the late 1970’s

            1979 is probably the STUPIDEST and most DECEITFUL time in the last 100 years to start a trend.

            The whole period from the early 1600’s through was the actual anomaly…..
            …. anomalously EXTREME HIGHS. !!

            You would do it ONLY if you were trying to push some ANTI-SCIENCE AGENDA of some kind.

            https://s19.postimg.org/bkgbf2prn/Icelandic_sea_ice_index_2.png

        • AndyG55 says:

          Continued cherry-picking of the late 1970’s really makes sea ice bed-wetters look like CLIMATE CHANGE DENIERS

          late 1970’s was a peak, up there with those of the LIA,

          Current sea ice levels is still in the top decile of areas for the last 10,000 years.

          https://s19.postimg.org/vgdnb299v/Arctic-_Sea-_Ice-_Holocene-_Stein-17.jpg

          ie, they are FAR above “normal” for the Holocene.

          Learn some proper history, Brian, or you will continue to look like just another ignorant chicken-little Arctic sea ice bed-wetter.

        • AndyG55 says:

          “often referred to as a relative stable period for the sea ice extent. ”

          Really? by who.

          It was stable in the sense that there was ONE HECK OF A LOT OF SEA ICE UP THERE.

          Just like there is now. !

          significantly above the levels of the MWP, and

          And FAR above the levels of the first 7000+ years of the current interglacial.

          If you REALLY think that the Arctic should be one solid plate of ice all year round, then move to the Siberian coast.

          I bet that you choose to live somewhere WARM, don’t you, little hypocrite.

        • sunsettommy says:

          Brian, like many dishonest warmists create a false narrative by telling only part of the story.Here is what the website actually says:

          “Total ice coverages are only calculated from March – September of each year to capture the maximum and minimum values for the season. Values represent the entire area of ice covered water bodies over the entire Northern Hemisphere and are calculated in Lambert Azimuthal Equal Area Projection with a WGS84 Datum. The daily total ice extents are calculated from a 3-day running mean to eliminate daily variability and provide a clear trend line.”

          The chart itself shows a TEN year maximum-minimum as the blue shaded area,TEN year average for the date in dotted line,current year 2017 as the solid line.

          Therefore you tried to mislead people,which is a common tactic of warmist slimebags.

          • Brian says:

            OK, fair enough. I’m not trying to mislead anyone. I’m just looking at the data, no agenda, and trying to understand how it can be reconciled against the headline that it’s growing.
            It’s a pretty straightforward question demanding a straightforward response.
            See this link from the same website.
            http://ocean.dmi.dk/arctic/icecover_30y.uk.php

            Let me know if you can find data from the DMI that contradicts this.

            Regards

          • gator69 says:

            Brian, I believe you need to carefully reread the headline and look at your chart again. It is what it is.

          • AndyG55 says:

            That chart directly confirms the headline. :-)

  9. John Niclasen says:

    The new young ice is formed earlier each year. I have plotted the day of the year, where the young ice is first seen on the russian ice charts since 2010. Each chart span three days, and I use the middle day of the three.

    Charts can be found at:
    http://www.aari.ru/odata/_d0015.php?lang=1&mod=0&yy=2017

Leave a Reply to AndyG55 Cancel reply

Your email address will not be published. Required fields are marked *