I’ve just discovered a spectacular new type of data fakery in the GHCN database.
NOAA only had about ten stations in South America with daily temperature data in 1950
In my previous post I showed how UHI from Buenos Aires is contaminating rural La Estanzuela.
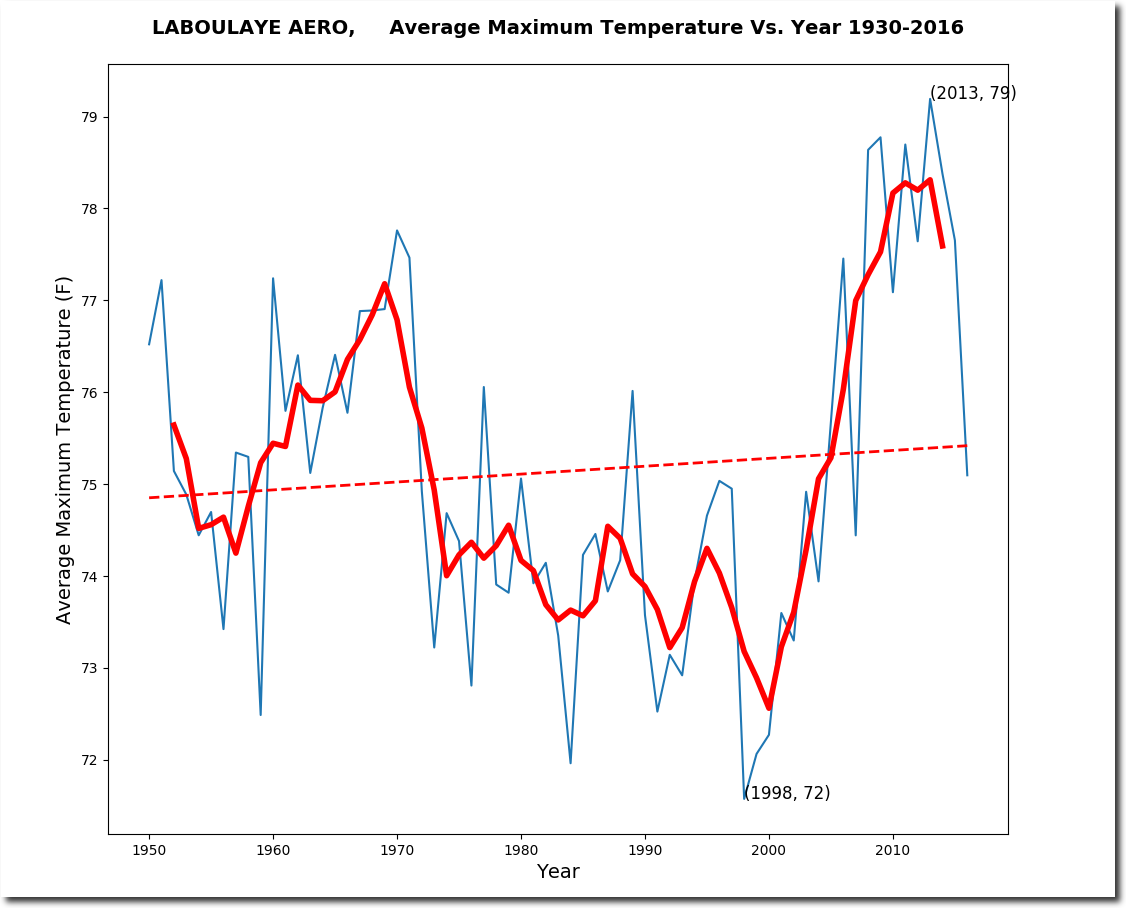
Now we are going to look at a completely different type of data fakery in Argentina. Laboulaye Airport is about three hundred miles west of Buenos Aires, and showed cooling from 1950-2003. But then there was a sharp spike upwards after 2003.
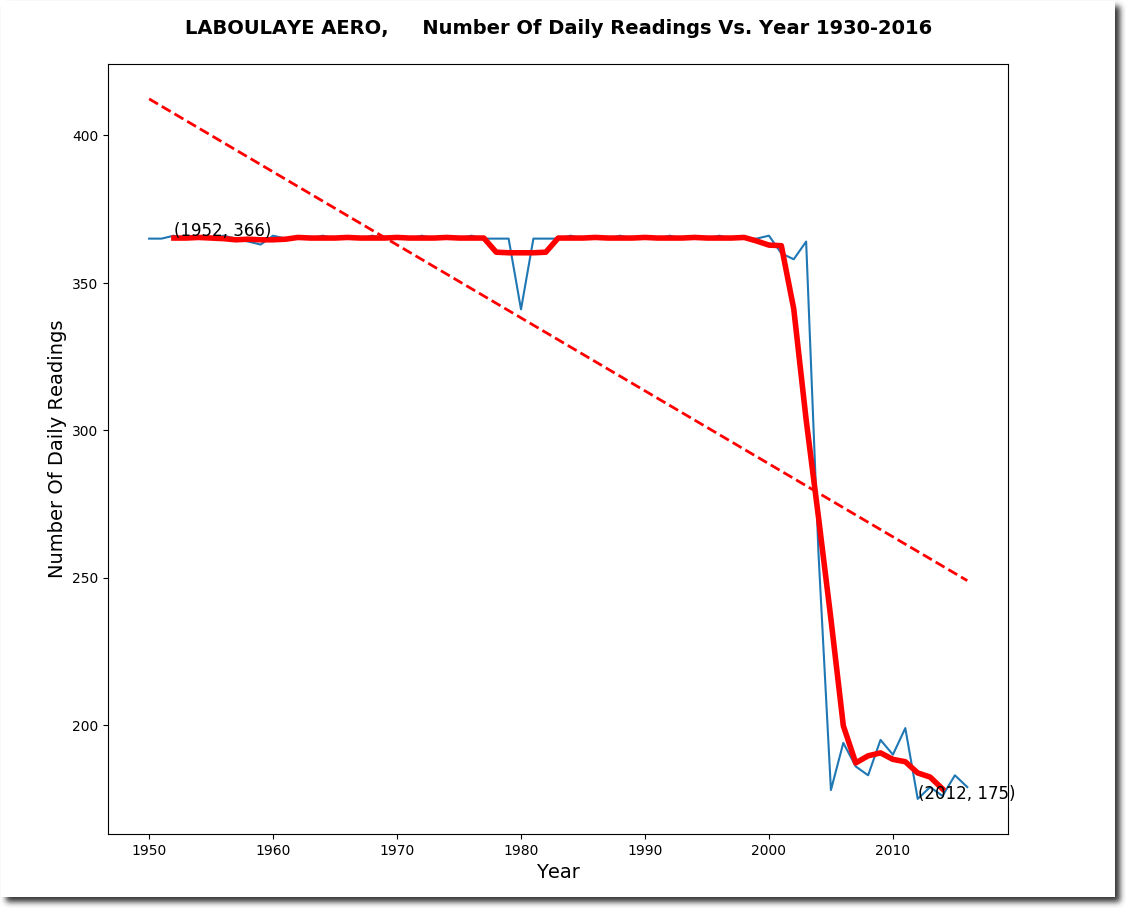
So what happened after 2003? NOAA started losing daily temperatures. Until 2003, they have daily temperature data for almost every single day of the year. But after 2003, they started losing about half of their days.
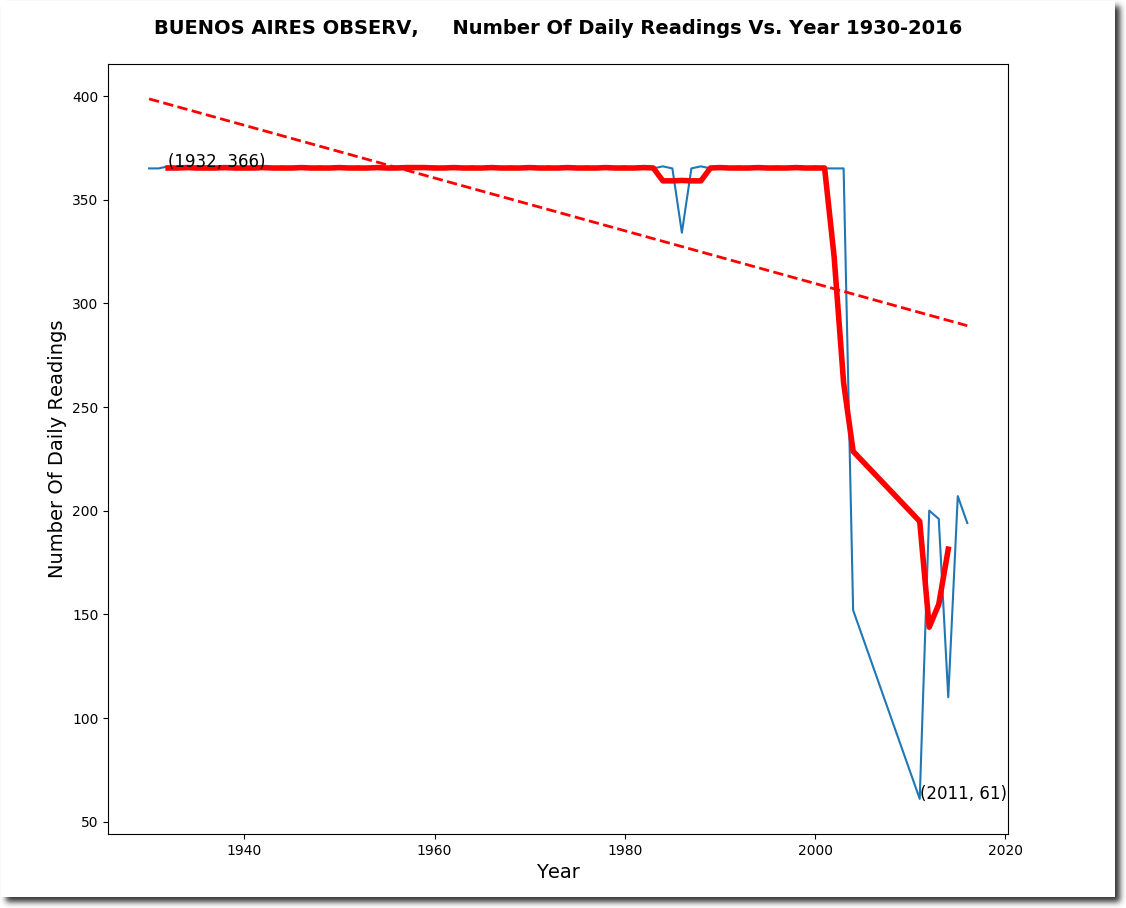
The loss of data corresponds precisely to the spike in temperatures. And NOAA did exactly the same thing at Buenos Aires.
It could be just a million to one coincidence, but it looks very suspicious. And it is very similar to how NOAA manipulates post-1990 US temperatures, except with US data they manipulate monthly temperatures rather than daily temperatures.
Tony – why do many charts reference this 1961-1990 baseline (like in the article linked below)? The adjustments don’t seem to match up to the trends you have outlined and I’m assuming it has to do with this ‘baseline’ but am unsure. Thanks for all that you do!
https://www.theguardian.com/environment/climate-consensus-97-per-cent/2016/feb/08/no-climate-conspiracy-noaa-temperature-adjustments-bring-data-closer-to-pristine
Should have been more clear – the trends you have shown refer to this article: https://realclimatescience.com/100-of-us-warming-is-due-to-noaa-data-tampering/
Multiple choice time, folks, with today’s Climate Catastrophe Quiz of the Week! Select what you think could be the right answer to explain how yet another piece of NOAA’s climate data appears to be all at sea without a paddle.
1. For unexplained reasons they’ve ‘lost’ a large number of cooler data points, magically causing a strong cooling trend to be transformed and allowing the remaining warmer data points to drive published temps upwards.
2. For unexplained reasons they’ve ‘lost’ a large number of cooling data points and have simply inserted their own ‘estimated’ data instead, which coincidentally transforms a strong cooling trend into a warming trend.
3. For unexplained reasons they really have had a legitimate* failure of data recording which amazingly has over-turned a strong cooling trend leaving the remaining data to show strong warming. *Unfortunately it slipped their mind to bring this ‘legitimate’ failure to anyone’s attention.
4. They’ve been caught red-handed (yet again) deliberately manipulating data across the world to show warming trends where previous data showed inconvenient cooling trends, in order to further their own ‘climate change’ interests.
5. None of the above, because Tony Heller is a lying climate denier who – look, over there, squirrel!
Simple, Noble Cause Corruption, they really think they are saving the world from a Falling Sky! They want to be world heroes! Also WHO asked nicely for results to prove Global Warming.
They are fighting for the oppressed and exploited masses. And the Party asked.
———-
Emphasis in bold is mine
Those NOAA alarmists are very creative in their efforts to fool the people of the world into believing the lie of CAGW.
The Red Team needs to look into all of these shenanigans and expose them to the light.
Good work, Tony.
Think of all the lies we wouldn’t know about except for Tony and his hard work. One guy can make a difference.
In science, one guy usually provides the necessary path forward.
it’s interessting to see that out of all these weatherstations in southamerica
almost half are around the equator.
Than you have several million square miles of 0 weatherstations.
Than 2 at the west coast a few at the downer part,then again-in cold windi patagonia- a thousand miles of nothing.
Having a dozen weather in a 18million sq.km2 region and half of the weather stations in the warmest regions and zero in the coldest region
and then dare to come up with statistics is exactly what you can expect from charaltans who call carbon a pollution and still dare to call themselve scientist.
(when someone gives you 10 hairs from an unknown person would you be able to tell how this person looks like and how she looked 50 years ago?-you would neither know gender nor age of this person)
Buenos Aires is about the same distance from the equator as Los Angeles.
Good point. And if you add up the populations, only a ninth of humanity lives south of the Equator. British scientists, A.W. Brewer and G.M.B. Dobson developed a picture of atmospheric circulation known as the Brewer-Dobson effect back during bomb testing. The upshot is that fallout tends to stay in the hemisphere in which it originated. If Satan’s CO2 is indeed industrial, then some 8/9 of it should originate in the Northern Hemisphere. Has any corresponding difference or gradient been measured?
this would mean that 8/9 of the co2 ‘fallout’ should be still in the northern atmosphere,
therefore co2 concentration in the northern atmosphere should be 300 ppm +180 ppm manmade
and in the southern atmosphere 300ppm + 20 ppm.
Therefore global warming should be much stronger than in the north than the south.
Sounds to me much like the scientific ozon hole logic where 90% of the cfc was produced in the north,
but the(of course man made) ozon hole in the south
was much much bigger.
CO2 is a well mixed gas.
https://www.youtube.com/watch?v=x1SgmFa0r04&t=5s
Gases are fully miscible. They will mix completely and uniformly, given enough time and a lack of variable sources and sinks (things that add and remove the gas in question), since the constituent atoms and molecules are moving on the order of 1 km/sec or 0.609 mi/sec at typical temperatures (the geometric mean of the mixture’s kinetic energy and only its kinetic energy) and pressures.
This is sooo transparent! Republican prohibition fanatics send thugs and silky hidden persuaders to “our” Monroe colonies, wreaking havoc on economies accustomed to pandering to pent-up demand under prohibition. The Glucose Trust and yeast factories had the same problems from Herbert Hoover. So the Dems pretend to be different. Suddenly, the chief Dem Goracle is “stabbed in the back” by econazi spoiler votes and Tammany Hall loses jobs, honest graft and the unproductive hand in the till. The Dems adopt the entire Green platform as their own, fake data to sell the fraud, and enlist the eager cooperation of foreigners who hate meddling Republican prohibitionists as we ourselves would in their place. Result: Brazilian sea level data is a hoax.
Prohibition is a Progressive venture, not republican. And who penned the 18th Amendment you ask?
John Morris Sheppard (May 28, 1875 – April 9, 1941) was a Democratic United States Congressman and United States Senator from Texas. Because he authored the Eighteenth Amendment (Prohibition) and introduced it in the Senate, he is referred to as “the father of national Prohibition.
https://en.wikipedia.org/wiki/Morris_Sheppard
The only party that wants total dominion over our lives is the Democrat party, a party chock full of Progressives.
Ranting against republicans is not the answer Hank.
I’m curious why a sudden drop in readings or reporting would shoot temperatures up. Is it because the few remaining readings were in the summer?
Most likely the missing readings are replaced with values generated from computer models, and are much hotter than what the thermometer would have shown. Eventually we’ll have zero thermometer readings and instead just use the models as observations.
Excellent work. Could you consider doing a detailed piece on the significance of “lost” stations and readings? It seems that there are several different reasons that might cause them to lose a station or a set of readings, and a variety of effects that are induced on the data.