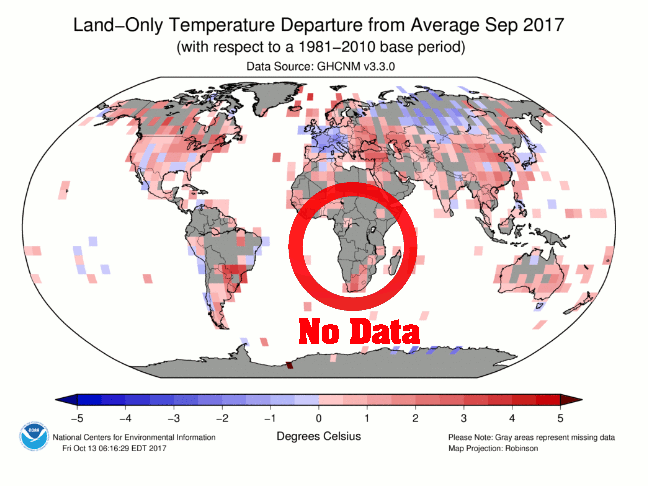
NOAA’s climate reporting is spectacularly fraudulent and cynical. They do things like report record heat in parts of the world where they had no temperature data that month..
But none of NOAA’s climate fraud is more cynical then their Climate Extremes Index. NOAA claims that the occurrence of hot summer afternoons has increased in the US, with 2012 being the hottest.
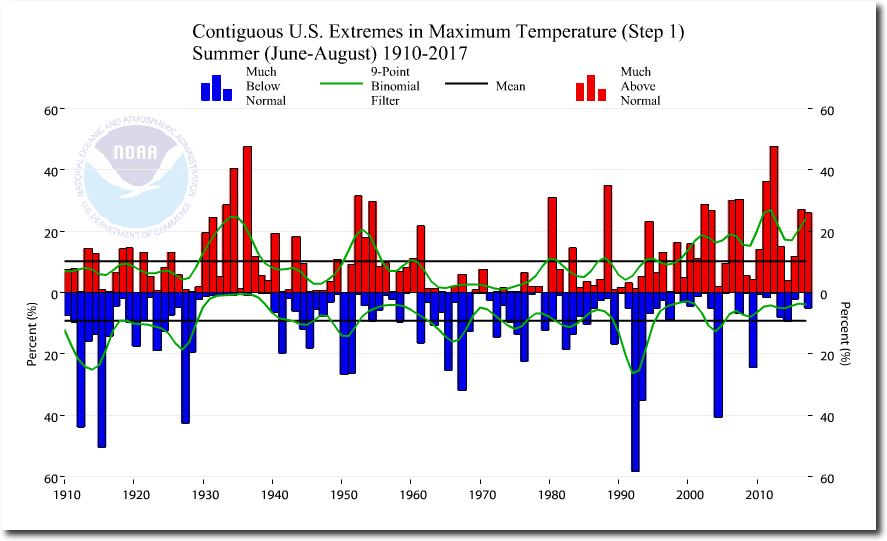
This is wildly fraudulent misinformation. The frequency and areal coverage of hot summer afternoons in the US has plummeted over the past 80 years, and is now near record lows.
The average summer maximum temperature has plummeted.
The percent of hot days has plummeted.
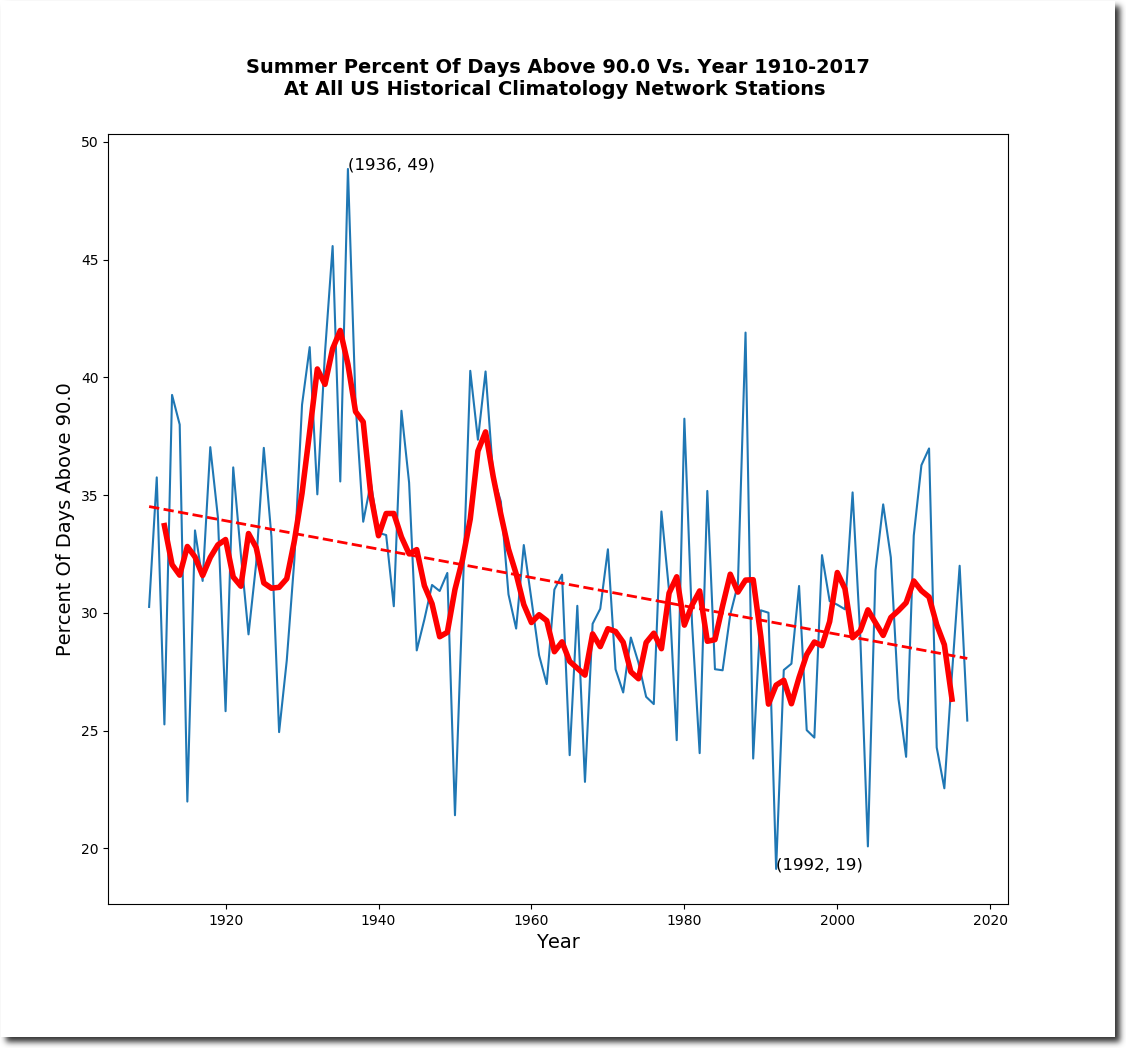
During the 1930’s about two-thirds of the US would reach 100 degrees during the summer. In recent years, that percentage has been less than one-third.
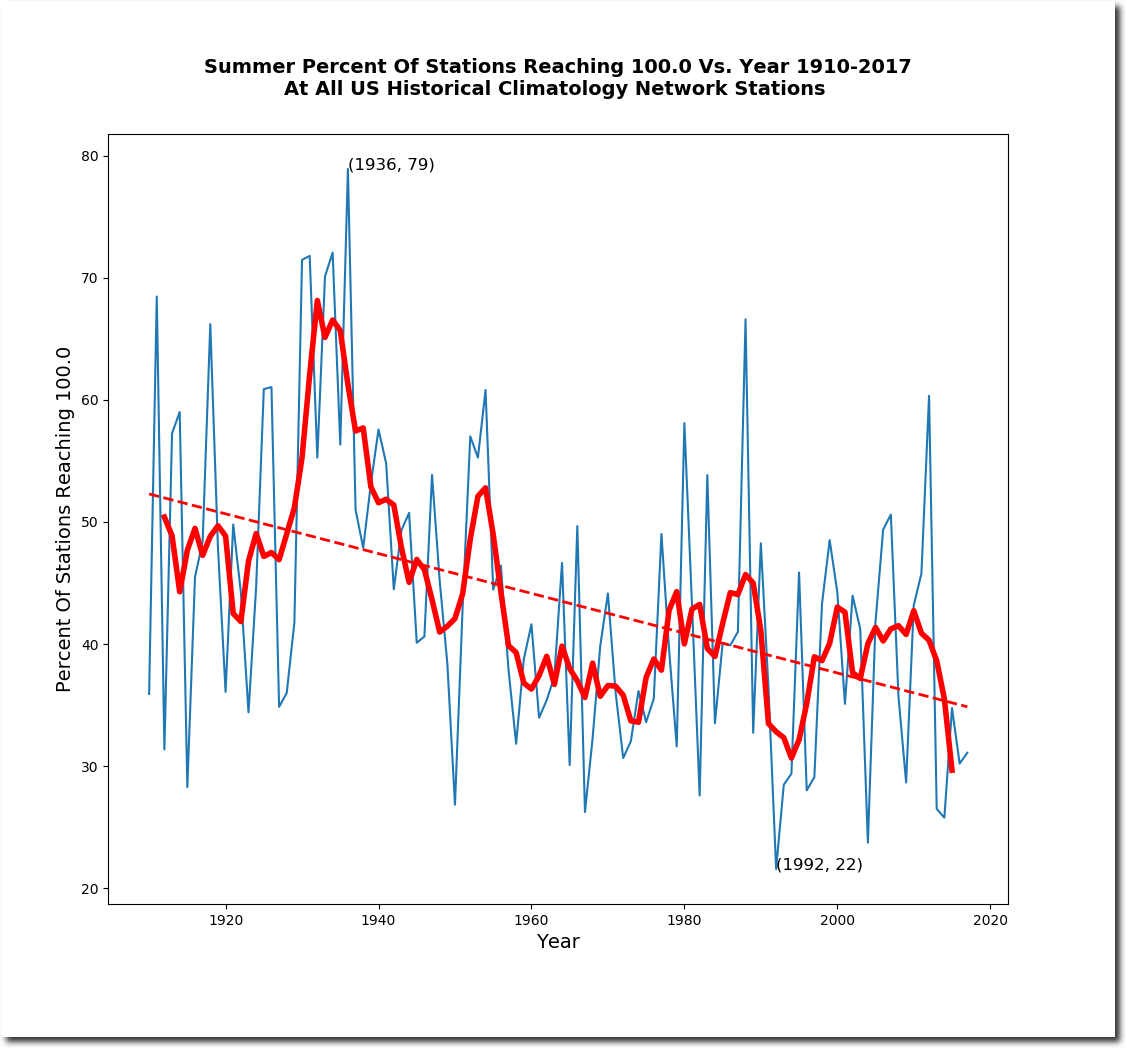
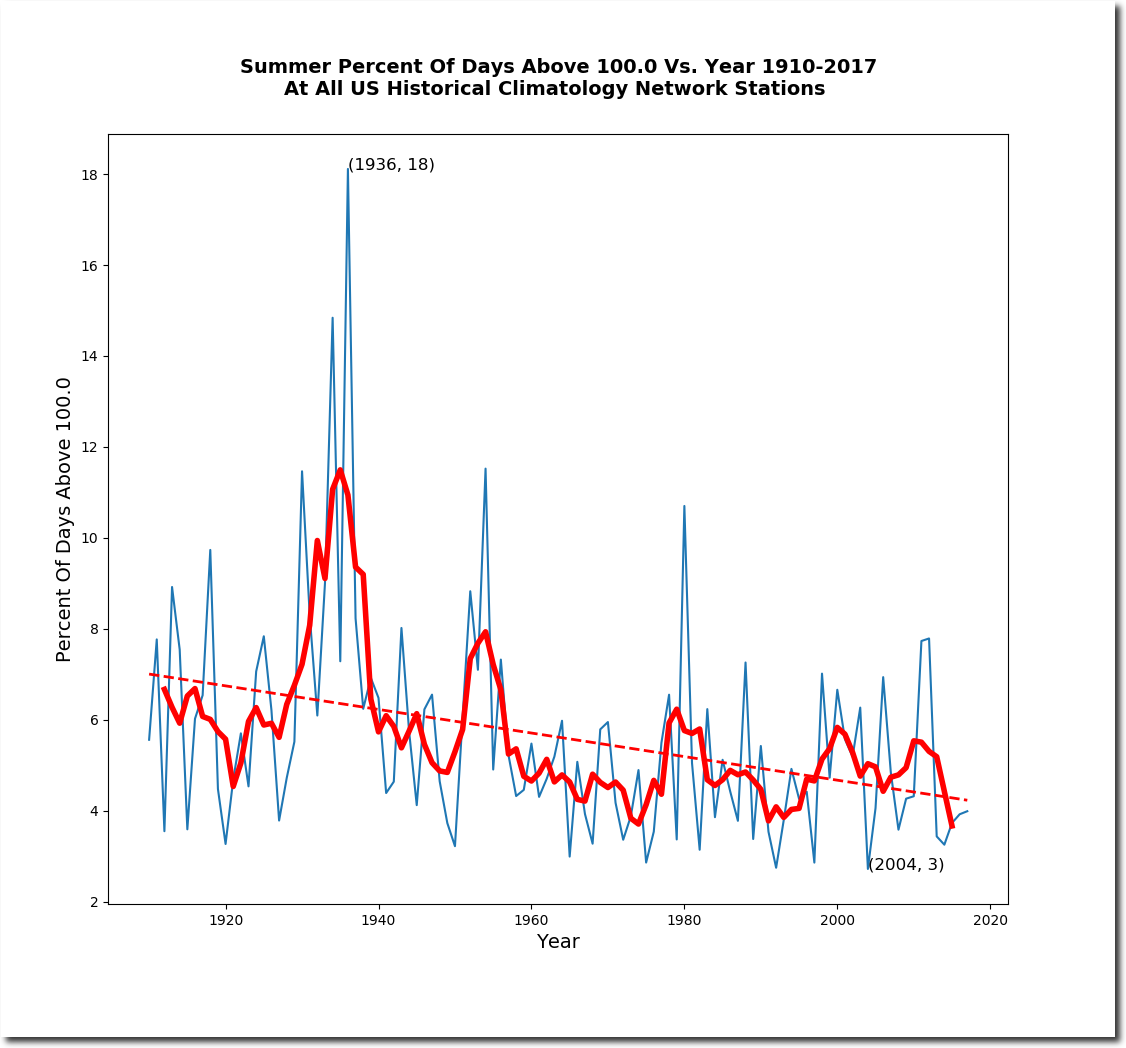
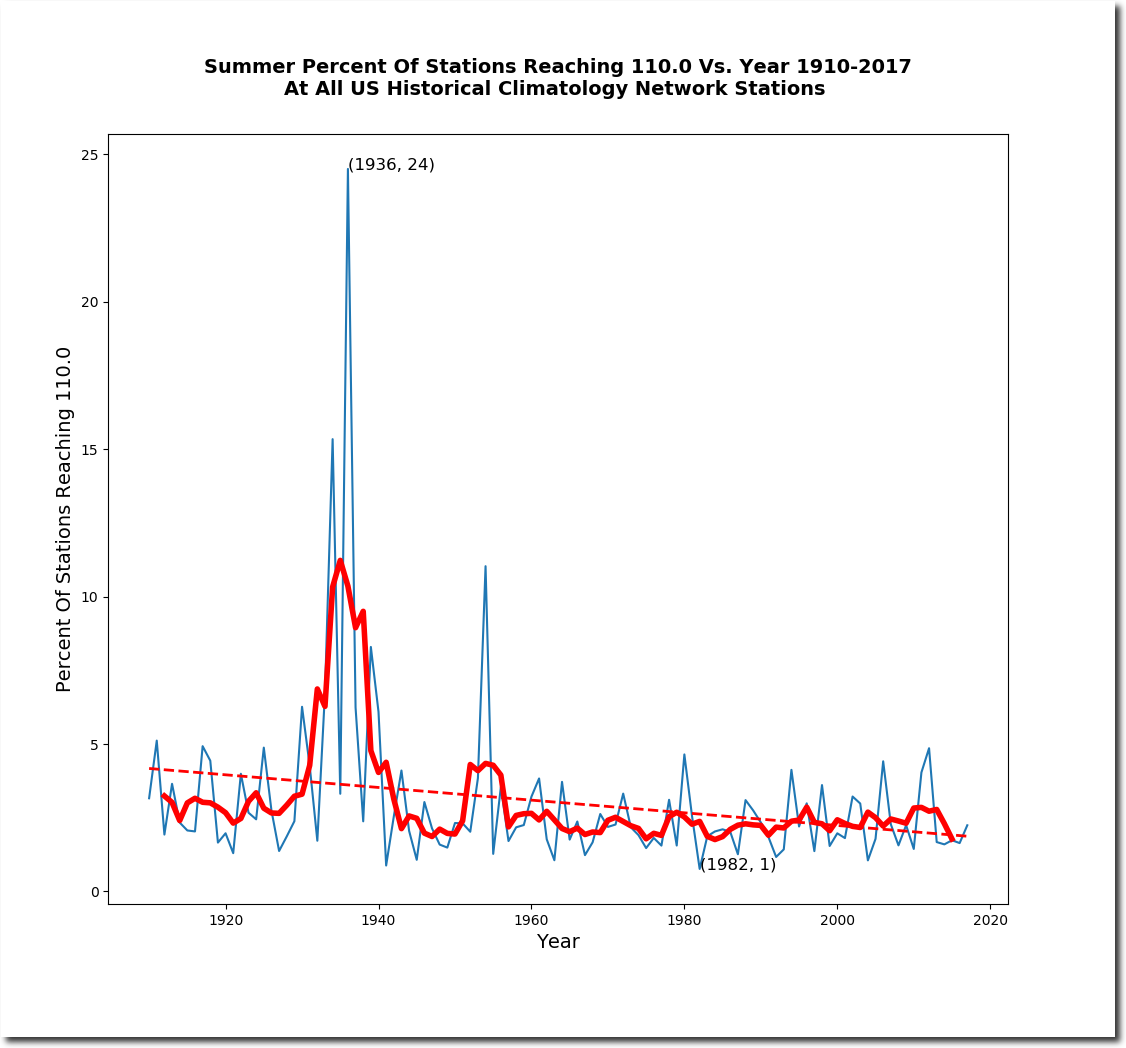
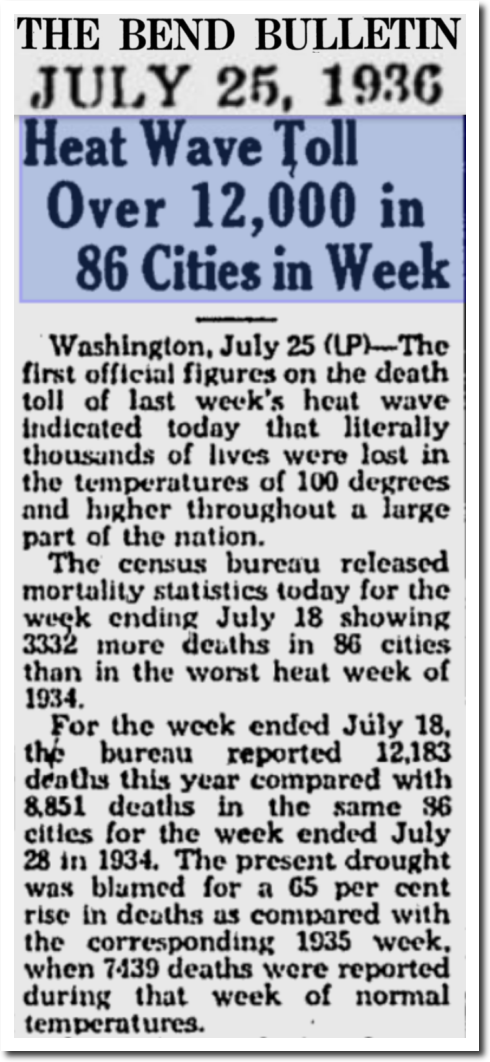
Summer afternoons are getting much cooler in the US. The 1930’s were very hot, with temperatures over 120 degrees in the Great Plains, and over 110 degrees across much of the US.
The Bulletin – Google News Archive Search
It is bad enough when NOAA makes up record high temperatures, but even more disturbing when they report the exact opposite of the actual trend. The people behind this are criminals, not scientists – and they are enabled by their fellow travelers in the press who refuse to question their work, or talk to anyone who does.
These individual posts are excellent but maybe you could do a single round-up of the data manipulations that you’ve discovered so far? There’s been so many it’s hard to keep tabs on them all. It could be a really strong single point of reference and would show how you’ve caught them systematically targeting and manipulating multiple areas of AGW theory to try to create a point by point catalogue of overwhelming ‘evidence’ – when no such evidence actually exists. Could be a slam-dunk moment and it’d definitely be fun!
He’s writing a book.
How does one even calibrate ocean temperature data with terrestrial temperature data to portray a homogenous graphic? I would think it takes a lot of assumptions and liberties, even if all we’re looking at are “trends.”
Maybe I don’t know what I’m talking about.
Darwin shows warming, bulltish!
Dawin’s temperature has not moved in 50 years, it is a standing joke that a hot day during the wet is 34C and a cold day during the dry is 28C.
You could forecast the weather for any given day for the next 20 years and be 80% correct.
A weatherman’s dream!! In Canada our weathermen and women couldn’t get yesterday’s weather correct :-(
Actually, even in looking at NOAA’s brightly colored chart, I don’t see much difference in extreme temps between the 1930’s and 1950’s periods vs the 2000’s and 2010’s. Looks like they need to do some more adjusting if they really want it to slap me in the face.
The warmists know that the 1940’s heat was a problem. They have been working diligently to get rid of it.
From: Tom Wigley
To: Phil Jones
Subject: 1940s
Date: Sun, 27 Sep 2009 23:25:38 -0600
Cc: Ben Santer
“Phil, Here are some speculations on correcting SSTs to partly explain the 1940s warming blip. If you look at the attached plot you will see that the land also shows the 1940s blip (as I’m sure you know). So, if we could reduce the ocean blip by, say, 0.15 degC, then this would be significant for the global mean — but we’d still have to explain the land blip.
I’ve chosen 0.15 here deliberately. This still leaves an ocean blip, and i think one needs to have some form of ocean blip to explain the land blip (via either some common forcing, or ocean forcing land, or vice versa, or all of these). When you look at other blips, the land blips are 1.5 to 2 times (roughly) the ocean blips — higher sensitivity plus thermal inertia effects. My 0.15 adjustment leaves things consistent with this, so you can see where I am coming from. Removing ENSO does not affect this. It would be good to remove at least part of the 1940s blip, but we are still left with “why the blip”.
A 1975 Science News article reveals the scientific consensus in 1975
The cooling trend observed since 1940 is real enough, he says, but not enough is known about the underlying causes to justify any sort of extrapolation. Particularly dangerous would be any attempt to generalize from even shorter-term experience, like the bad weather in 1972 and following years, to prognosticate any future weather patterns. On the other hand, the cooling since 1940 has been large enough and consistent enough that it will not soon be reversed, and we are unlikely to quickly regain the “very extraordinary period of warmth” that preceded it.
Bloody ridiculous on their part and it is flat out criminal. That 2012 data isn’t even close!
When another inevitable “blip” of heat occurs, such as did in the 30’s and 40’s, it will be touted as the “tipping point event” that mandates immediate draconian policy implementation to “save us” from climate disaster. The ignorant and clueless will stampede, trampling sensibility, rushing like lemmings to implement the devices of their own oppression. When the pendulum swings back to the cool, the”scientists” will proclaim their Gaia-saving mojo to be great and powerful.
The places with the greatest rate of warming (according to NOAA) are always the places where they have no data. Curious!
These guys are so superior that they don’t need any data.
Climate scientists are the Chuck Norris among scientists
and they never facts or reality get in their way.
They learn from the very first day:There is no god but all….
there is no climate but warming and anything is allowed to keep the story alive.
Arn wrote “there is no climate but warming and anything is allowed to keep the story alive.” That is suspiciously like the followers of Islam. They ultimately will permit no other religion, and their religion permits any atrocities that further this goal. It seems like the CAGW crowd have their own form of Taqiyya, Tawriya, Kitman and Muruna .
There is a scientific justification for that. If the warming their hypothesis predicts has not been measured anywhere, by definition it can only exists in places where they didn’t measure at all.
Science.
Schrödinger’s heat.
And as Schrödingers Cat
their warming is half dead and half alive.
In terms of real Science global warming was dead on arrival-killed by the global cooling lies of the seventies from the yeasterday-ice-age/today AGW priest guys and the obvious contradictions.
And buried by a million failed predictions.
(AGW is just the climate version of former honored-all of a sudden demonised statesman like Saddam and Noriega.
For many years bests friends of the USA and as soon as they became useless for the wall street or tried to emancipate themselves
they became new hitlers while(just like the climate )
they didn”t really change ,
the only thing that changed was how western MSM and politicians talked about them.
But AGW it is also still well + alive in the media
and they define reality for us.
Watch SE Asia get the “warmista” treatment as well. !!
Tony & others (ie Steve) … has anyone tried to fit the IPCC assessment reports to the “adjustment” of data? Or other conferences to the bumps up?
It seems to me there may be some correlation there … I certainly noticed a flurry of upwards adjustments for Paris 2015.
Report dates AR 1 1990, AR 2 1996, AR 3 2001, AR 4 2007, AR 5 2014.
Notice the warm stripe between Spitzbergen (Svalbard) and Nova Zembla in north west Russian Arctic waters. This is also in an area with no data and is probably a key set of data used to demonstrate how warm the arctic has become. Based on some previous discussion around this I’m convinced it’sdue to meshing errors in the temperature averaging model and is a complete fiction. The model appears to take two land temps and assume that the sea between them is at the same tempetature.
They can adjust the observations to fit the models. They can’t adjust the sea into claiming islands nations and coastal cities. They can’t adjust the Amazon into a desert. They can’t adjust the extinction of polar bears. They can’t adjust food riots. They can’t adjust boiling oceans. They can’t adjust 50,000,000 climate refugees by 2010. They can’t adjust a long overdue ice free Arctic. They can’t adjust the melting of Antarctica.
They can only adjust the official historical ‘observed’ temperature record then tell us what great soothsayers they are. The models were always accurate, it was the thermometers that were broken.
One of the main historical observed temperature revisionists is James Hanson. He thinks we can get to a point where the oceans will start to boil. He compares Earth to Venus even though Venus has over 200,000 times as much CO2 in it’s atmosphere as Earth does and it’s much closer to the sun. He thinks Antarctica will melt in under 100 years (92 years now) if we continue to use petrol cars.
James Hansen – The Runaway Greenhouse Effect
https://youtu.be/ACHLayfA6_4?t=114
The man is not unbiased enough to make data adjustments. His adjustments, that happens to fit perfectly with the models, are not better than someone’s observation 20, 40, 60, 80 or 100 years ago. We are humans, we understand how to operate thermometers (mercury or digital) We do now and we did back then. If you were a doctor would you question the nurse’s observation of 37°C on a patient’s chart or would you change it without even touching the patient’s forehead?
James Hansen, Gavin Schmidt, Zeke Hausfather and all the other historical observed temperature revisionists. Trust the observations not the theory. Theories are expendable.
I really wish they would go back to raw data, even if it takes a few more years for them to prove themselves. I rather not think I live on a fireball planet just waiting for a spark. (tipping point) I prefer to think of Earth future in millions or billions of years.
No not only do I not believe we are heading towards catastrophe, I don’t want to.