
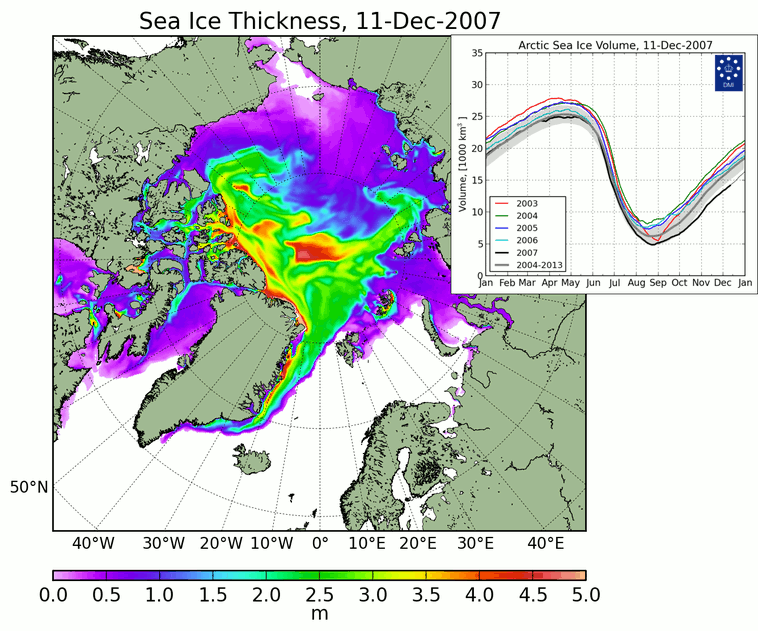
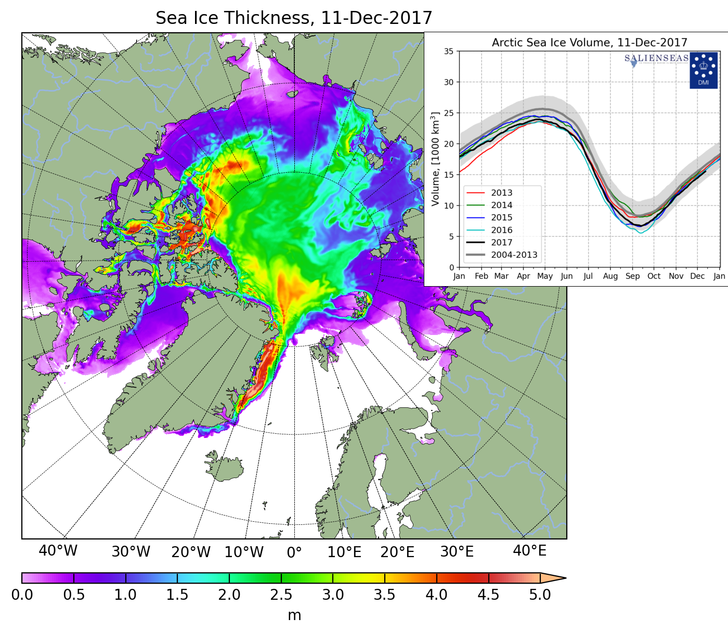
Arctic sea ice volume is up 15% from a decade ago, and the area of the Arctic covered with thick ice has massively expanded .
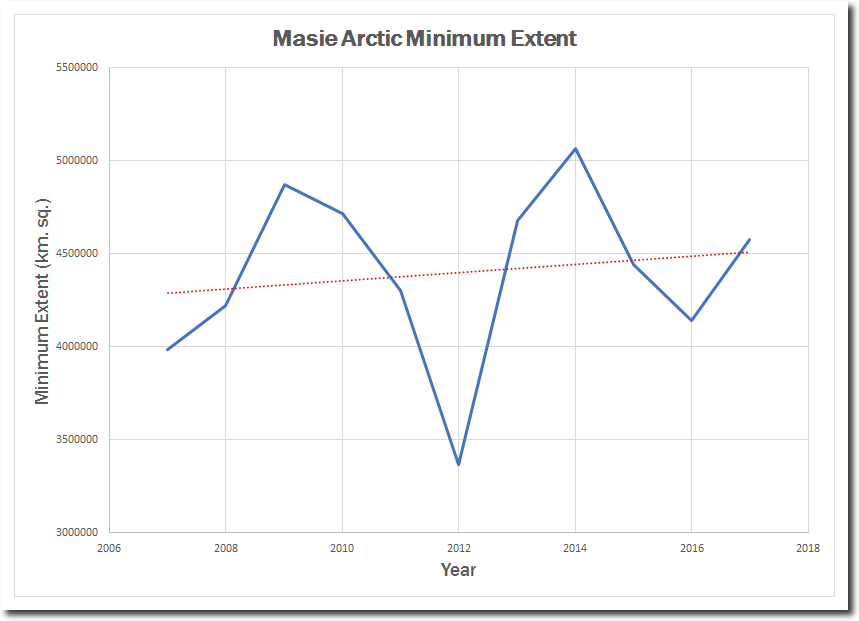
Summer minimum ice extent has increased over the past decade.
masie_4km_allyears_extent_sqkm.csv
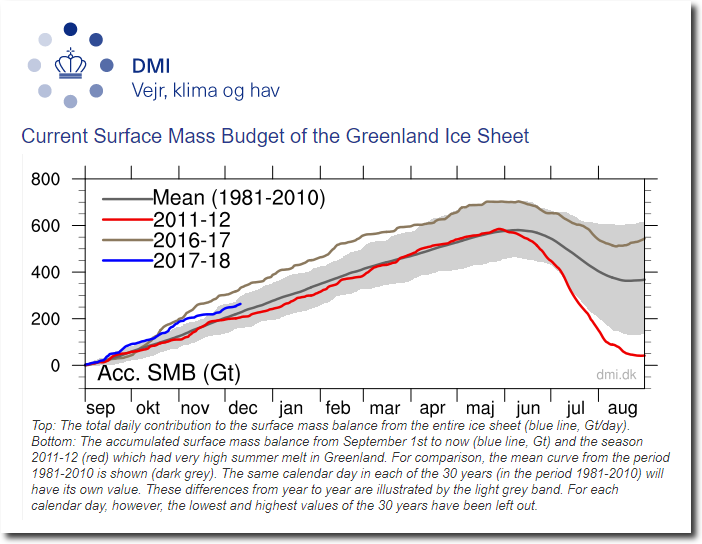
Greenland’s surface has been gaining ice at near record rates for the last two years.
https://www.dmi.dk/en/groenland/maalinger/greenland-ice-sheet-surface-mass-budget/
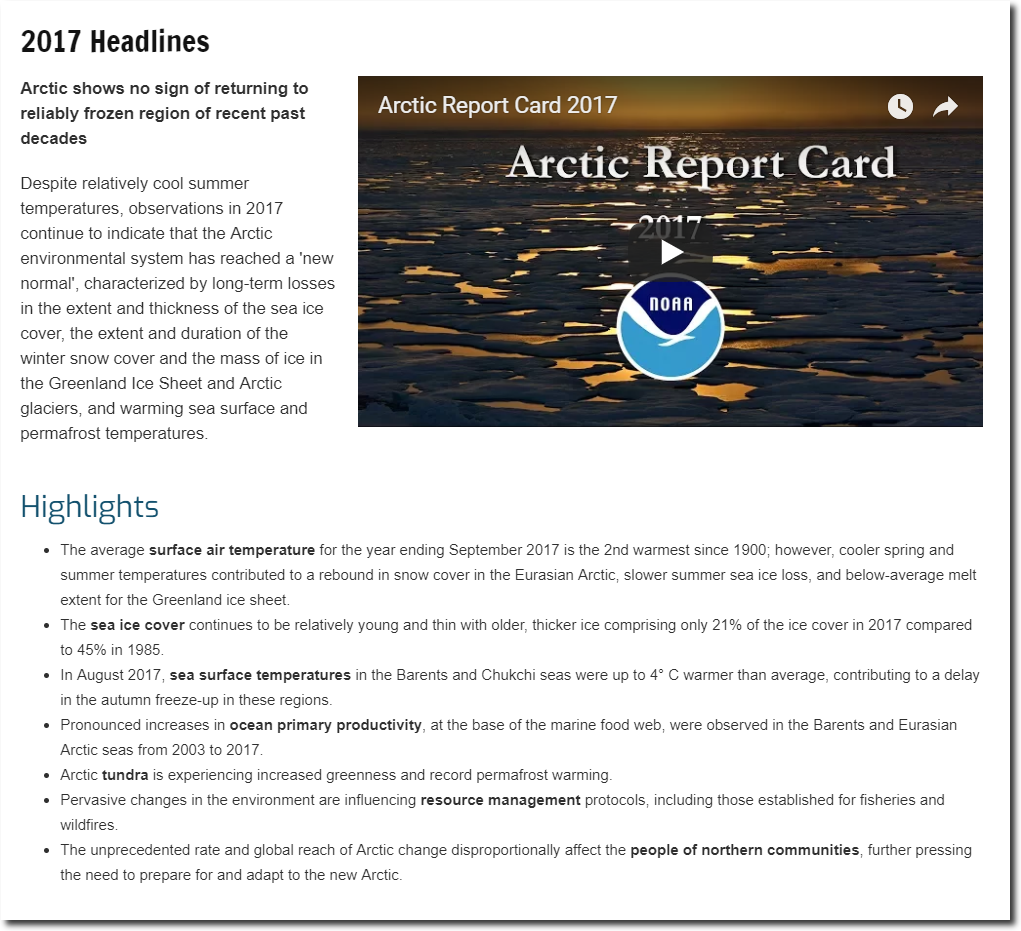
NOAA mysteriously forgot to mention that Arctic ice is expanding in their Arctic Report Card.
These people are propagandists, not scientists – and their scam is collapsing.
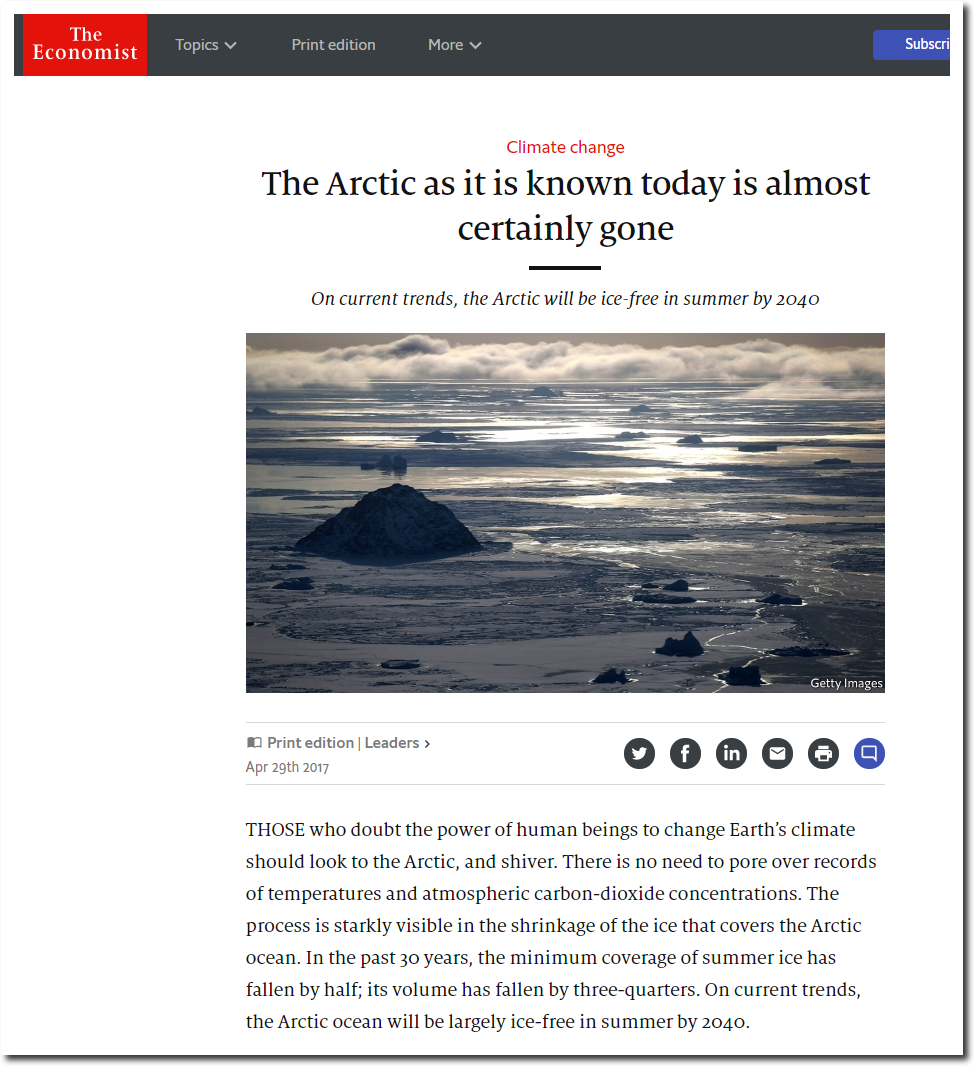
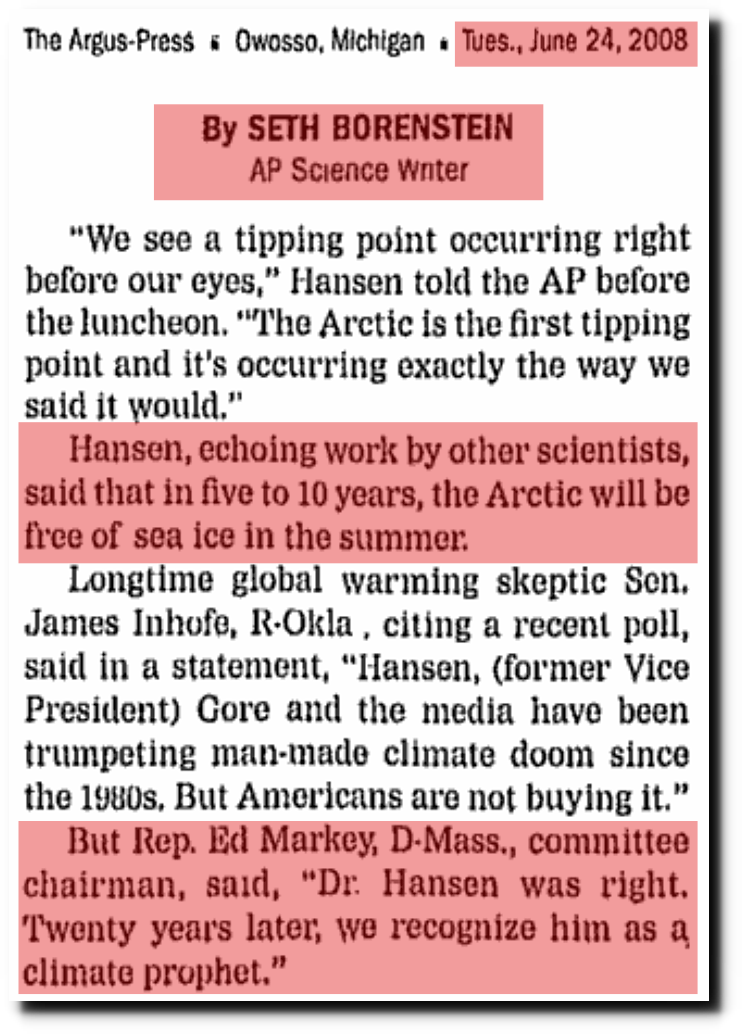
The Arctic as it is known today is almost certainly gone
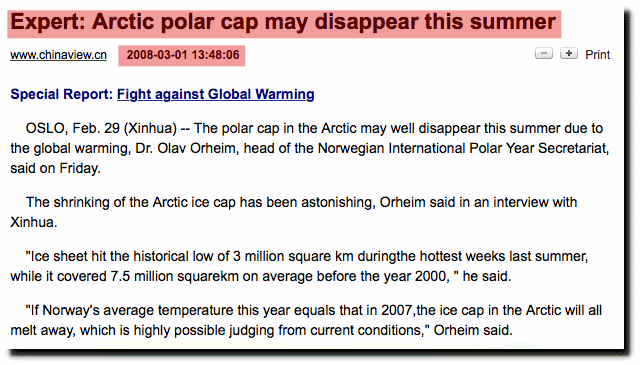
Expert: Arctic polar cap may disappear this summer_English_Xinhua
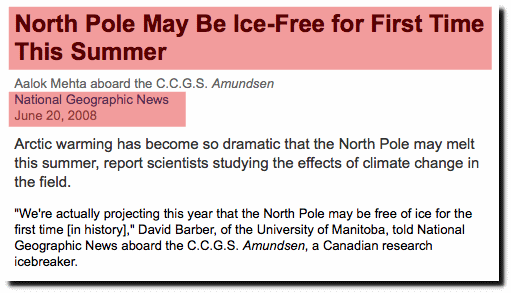
North Pole May Be Ice-Free for First Time This Summer
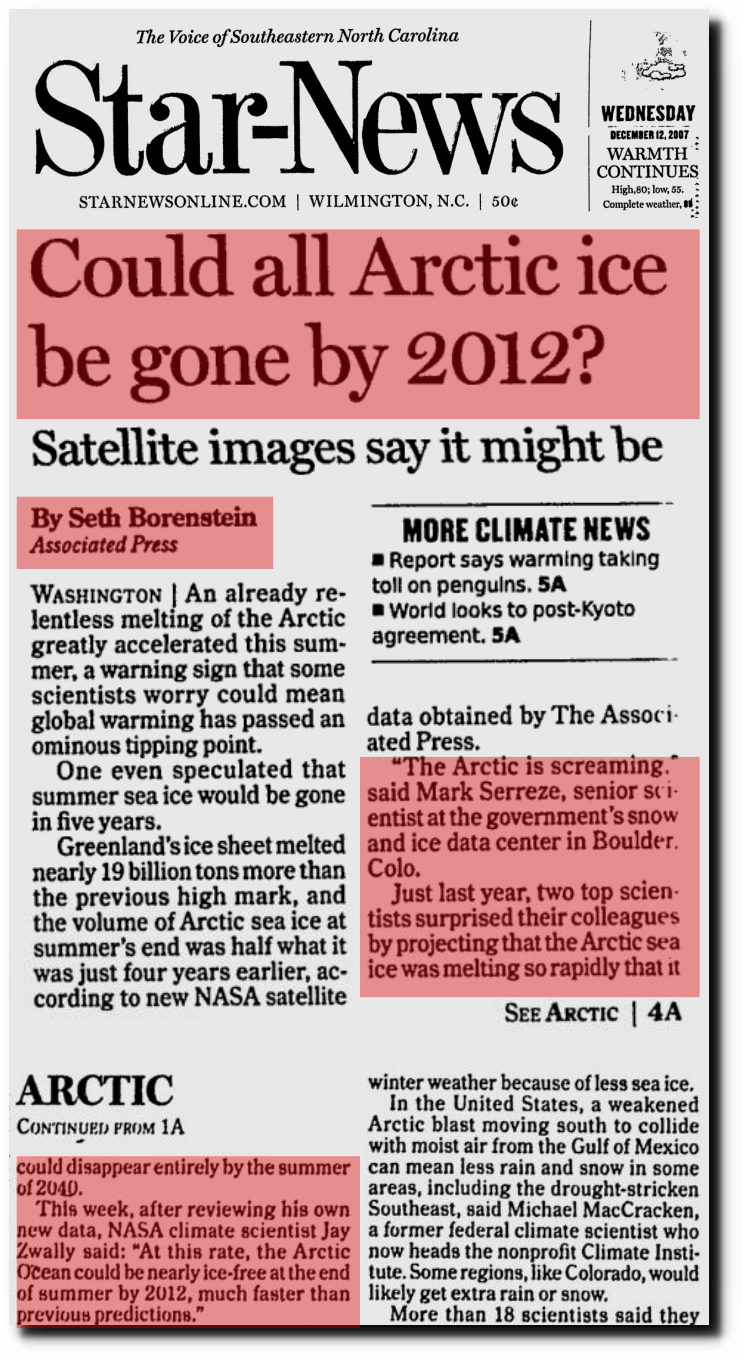
Star-News – Google News Archive Search
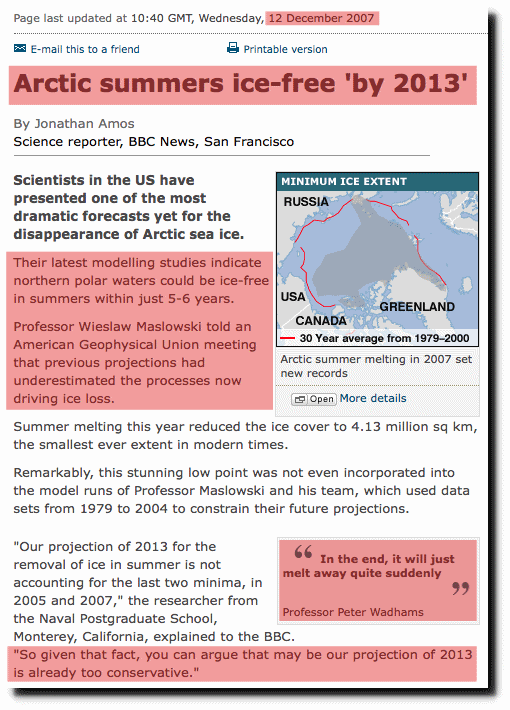
BBC NEWS | Science/Nature | Arctic summers ice-free ‘by 2013’
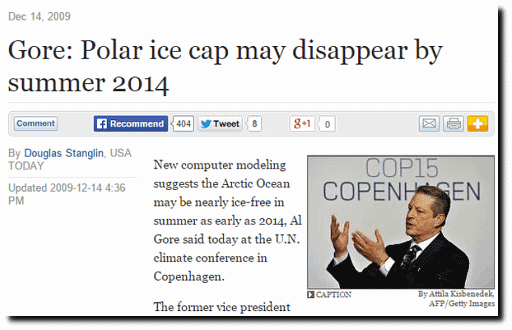
Gore: Polar ice cap may disappear by summer 2014
